. 2025 Sep 5;11(36):eadw2568.
doi: 10.1126/sciadv.adw2568. Epub 2025 Sep 5.

PTPN22-CD45 dual phosphatase retrograde feedback enhances TCR signaling and autoimmunity

Affiliations

PTPN22-CD45 dual phosphatase retrograde feedback enhances TCR signaling and autoimmunity

Shen Yang et al. Sci Adv. .

Abstract

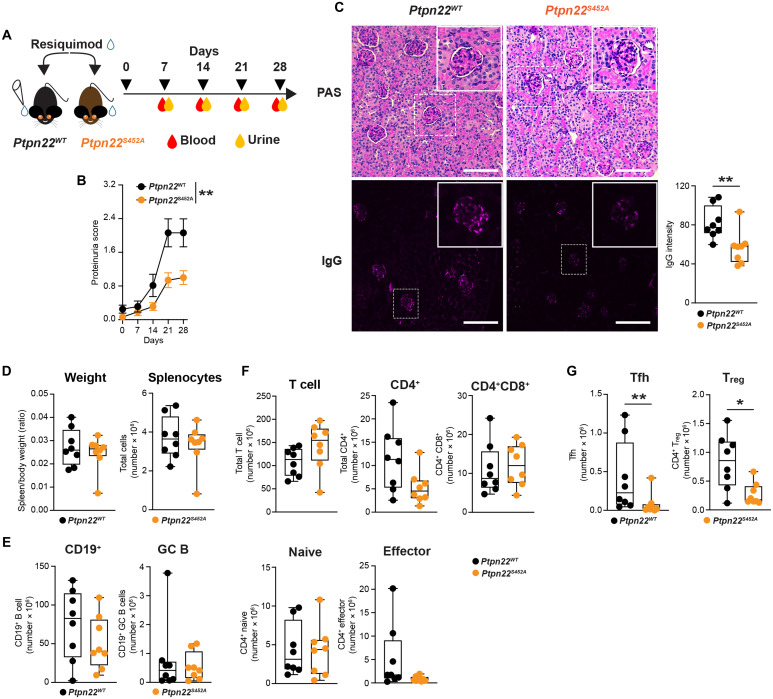
Protein tyrosine phosphatase nonreceptor type 22 (PTPN22) is encoded by a gene strongly associated with lupus and other autoimmune diseases. PTPN22 regulates T cell receptor (TCR) signaling through dephosphorylation of the kinases lymphocyte-specific protein tyrosine kinase (LCK) and zeta-chain-associated protein kinase 70 (ZAP70). The regulation of PTPN22 remains poorly understood. Here, we identify PTPN22 Ser449 as a protein kinase A phosphorylation site, which is triggered by TCR engagement and is hyperphosphorylated in lupus peripheral blood cells. PTPN22 Ser449 phosphorylation selectively lowered the affinity of PTPN22 for ZAP70 versus LCK but also indirectly suppressed inhibitory LCK Tyr192 phosphorylation through a ZAP70-CD45 signaling axis. The resulting dephosphorylation of LCK Tyr192 not only enhanced TCR signaling but also modulated pathway activation downstream the TCR. In vivo loss of PTPN22 Ser449 phosphorylation reduced T cell responses and suppressed experimental lupus nephritis. These results suggest that PTPN22 Ser449 phosphorylation promotes a CD45-mediated retrograde ZAP70-LCK feedback loop that enhances T cell responses and promotes autoimmunity.


Figures

Fig. 1.
Fig. 1.. Ser449 of PTPN22 is targeted by PKA and hyperphosphorylated in SLE PBMCs.
(A) Analysis of PTPN22 phosphorylation by Phos-tag SDS-PAGE and Western blotting in J.N22 KO and J.N22 WT Jurkat cells. Non–phos-tag gel served as control. (B) Schematic view of the PTPN22 structure with key catalytic residues, known phosphorylation sites including the Ser449 site in the interdomain and the R620W variation. (C to F) Ser449 phosphorylation was assessed by Western blotting following immunoprecipitation of PTPN22 from J.N22 WT Jurkat cells treated with calyculin A (C), or in J.N22 KO cells expressing FLAG-tagged WT or S449A PTPN22, with or without 10-min TCR stimulation (D), or in J.N22 WT cells after 0-, 1-, 5-, and 10-min TCR stimulation (E), or in primary human CD4+ effector T cells with or without 10-min TCR stimulation (F). (G) NetPhos hits with prediction score > 0.5, PKA (0.621) and RSK (0.541) were predicted Ser449 kinases. “Generic” indicates overall prediction of Ser449 as a phosphorylation site. (H and I) Effect of PKA Cα inhibitor [(H) H89 2HCl] or PKA Cα siRNA (I) on Ser449 phosphorylation in J.N22 WT cells after TCR stimulation. (J and K) In vitro PKA kinase assay using purified recombinant WT or S449A PTPN22 from HEK293T cells as substrates. (L) Ser449 phosphorylation in primary patients with SLE (n = 6) versus healthy controls (n = 4) PBMCs was analyzed by Western blotting following immunoprecipitation of PTPN22. Representative blots are shown (left). Histograms show comparison of Ser449 phosphorylation levels between stimulated/treated and control groups (right). Data are presented as means ± SEM and are from three (A, C, D, I, and K) or four (E, F, and H) independent experiments. Statistical significance was assessed by two-tailed Mann-Whitney test (C, F, H, I, and L), two-way analysis of variance (ANOVA) followed by Bonferroni’s post hoc test (D and K), or one-way ANOVA followed by Dunn’s post hoc test (E). *P < 0.05, **P < 0.01, ***P < 0.001. (J) Created with BioRender (69).
Fig. 2.
Fig. 2.. Ser449 phosphorylation inhibits PTPN22 functions during TCR signaling.
(A) Evaluation of TCR signaling–dependent PTPN22 activity by dual-luciferase reporter assay in J.N22 KO cells. Luciferase activity was measured (left, with pooled replicates) and normalized to the amount of PTPN22 relative to that of glyceraldehyde-3-phosphate dehydrogenase (GAPDH) as assessed by Western blotting (right). (B) Real-time RT-PCR analysis of IL2 and TNFA mRNA expression in J.N22 WT and J.N22 449 cells. (C) TCR-induced CD69 activation in J.N22 WT and J.N22 449 cells analyzed by flow cytometry and evaluated by median fluorescence intensity (MFI) of cells. (D) Protein phosphorylation induced by TCR stimulation in J.N22 WT and J.N22 449 cells analyzed by Western blotting. (E and F) TCR stimulation–induced SLP-76 Tyr128 phosphorylation in J.N22 WT and J.N22 449 cells assessed by flow cytometry (E) or Western blotting (F) at time points between 0 and 10 min. (G) Endogenous Rap1 activity in J.N22 WT and J. N22 449 cells assessed through RAS-like guanine nucleotide dissociation stimulator (Ral GDS) pull down was detected by immunoblotting and normalized to WT at 0 min. (H) The percentage of attached J.N22 WT or J.N22 449 cells to immobilized ICAM-1 was assessed following stimulation with or without antibodies against human CD3/CD28 and with plate-coated ICAM-1. (I) Integrin-mediated outside-in signaling in J.N22 WT and J.N22 449 cells was assessed by measuring protein phosphorylation as shown after stimulation with ICAM-1 for 0, 10, and 20 min. Representative blots are shown. Histogram shows quantification of phosphorylated protein normalized to total protein (D, F, and I). Data are presented as means ± SEM and are from three (A, E, and F), six (B and C), four (D, G, and I), or eight (H) independent experiments. Statistical significance was assessed by one-way ANOVA followed by Dunn’s post hoc test (A), Kolmogorov-Smirnov test (B), and two-way ANOVA followed by Bonferroni’s post hoc test (C to I). *P < 0.05, **P < 0.01, ***P < 0.001.
Fig. 3.
Fig. 3.. Ser449 phosphorylation impairs PTPN22 binding to ZAP70.
(A) Schematic illustration of PTPN22 variants and dephosphorylation of substrates LCK and ZAP70. (B) Immunoblotting analysis of COS-7 cells cotransfected with untagged LCK WT and 3× FLAG tagged WT, S449A, DACS WT, or DACS S449A PTPN22. Histogram shows quantification of the phospho-Tyr394 LCK /total LCK ratio (right). (C) Dephosphorylation of ZAP70 in COS-7 cells cotransfected with hemagglutinin (HA)–tagged ZAP70 and 3× FLAG tagged WT, S449A, DACS WT, or DACS S449A PTPN22 assessed by immunoblotting. Histograms show quantification of the phospho-Tyr319 or Tyr493 ZAP70 /total ZAP70 ratio. (D) PLA in J.N22 KO, WT and 449 cells stimulated by plate-bound anti-CD3 and soluble anti-CD28 antibodies for 30 min. (E) PLA was performed between PTPN22 and ZAP70 or LCK using mouse anti-FLAG and rabbit anti-ZAP70 or -LCK antibodies. Images of PLA (red, left) and quantification of PLA are shown (right). Scale bars, 10 μm. (F) Schematic model of PTPN22 intracellular FRET. (G) FRET measurements of PTPN22 conformation dynamics by flow cytometry. PTPN22 Ser449 phosphorylation and expression of PTPN22 FRET fusion proteins was evaluated by immunoprecipitation and Western blot analysis (left). FRET was assessed by adjusting the gates to identify cells that are negative in transfected with CFP-PTPN22 only, PTPN22-YFP only, CFP-PTPN22, and PTPN22-YFP. Histogram shows quantification of FRET % (right). Data are presented as means ± SEM and from three to five (B, C, and E) or six (G) independent experiments. Representative blots are shown (left). Statistical significance was assessed by one-way ANOVA followed by Dunnett’s post hoc test (B, C, and E), or two-tailed Mann-Whitney test (G). *P < 0.05, **P < 0.01, ***P < 0.001. (A) and (D) created with BioRender (69).
Fig. 4.
Fig. 4.. Mutation of PTPN22 Ser449 elevates LCK Tyr192 phosphorylation.
(A) Immunoblotting analysis of phospho-proteins in total lysates of TCR stimulated J.N22 WT and J.N22 449 cells. Blots show LCK phosphorylation (Tyr192, Tyr394, or Tyr505) induced by TCR stimulation. (B and C) LCK phosphorylation in HEK293T (B) or J.CaM1.6 (C) cells transfected with LCK variants. (D) TCR-induced LCK Tyr192 phosphorylation in ZAP70 knockdown WT cells. (E) LCK phosphorylation in J.CaM1.6 cells transfected with LCK Y505F variant and subjected to ZAP70 knockdown after 10-min TCR stimulation. (F) LCK Tyr192 and ZAP70 Tyr319 phosphorylation in CSK knockdown WT cells. (G) Immunoblotting analysis of LCK phosphorylation in P116 cells induced by TCR stimulation. Data are presented as means ± SEM and are from four (A, E, and F) or three (B to D, and G) independent experiments. Representative blots are shown (left), and histograms show quantification of phosphorylated LCK normalized to total protein (right). Statistical significance was assessed by two-way ANOVA followed by Bonferroni’s post hoc test (A and D to G), and one-way ANOVA followed by Dunnett’s post hoc test (B and C). *P < 0.05, **P < 0.01. Schematics in (B) to (G) created with BioRender (69).
Fig. 5.
Fig. 5.. ZAP70-CD45 axis regulates LCK Tyr192 phosphorylation.
(A) TCR stimulation–induced LCK phosphorylation in J45.01 cells. (B) TCR stimulation–induced LCK phosphorylation in CD45 knockdown WT cells. (C) Phosphorylation of LCK Tyr192 after CSK inhibition in CD45 deficient cells. J.CskAS/CD45 cells were treated with antibodies against CD3/CD28 or the CskAS inhibitor (5 μM 3-IB-PP1) for 2 min (left). (D and E) LCK Tyr192 phosphorylation in CD45 knockdown P116 cells (D) or in ZAP70 knockdown J45.01 cells (E) after TCR stimulation for 0, 5, and 10 min. Representative blots are shown (left). Histograms show quantification of phospho-Tyr192 LCK to total protein ratio (right). (F) PLA assay in J.N22 KO, WT, and 449 cells stimulated with antibodies against human CD3/CD28 for 30 min. PLA was performed between CD45 and LCK using mouse anti-LCK and rabbit anti-CD45 antibodies. Representative images of PLA (red, left) and quantification of PLA are shown (right). Scale bars, 10 μm. Data are presented as means ± SEM and are from three (A to F) independent experiments. Statistical significance was assessed by two-way ANOVA followed by Bonferroni’s post hoc test (A, B, D, and E) and by one-way ANOVA followed by Dunnett’s post hoc test (C and F). *P < 0.05, **P < 0.01, ***P < 0.001. Schematics in (A) to (E) created with BioRender (69).
Fig. 6.
Fig. 6.. PTPN22 Ser449 phosphorylation enhances T cell activation and modulates effector functions by promoting dephosphorylation of LCK Tyr192.
(A) Uniform Manifold Approximation and Projection (UMAP) of J.Lck cell clusters expressing optimized PTPN22 gene sequences. (B) Violin plots showing expression of optimized PTPN22 WT and S449A genes in single J.Lck WT or J.Lck Y192F cells; each dot represents a single cell; horizontal bars show median expression value. (C) Dot plot of GSEA GO pathway enrichment analysis of the differentially expressed genes (DEGs) in the optimized S449A versus WT populations of J.Lck WT and Y192F cells (P-adjust <0.05). NES, normalized enrichment score. (D) Heatmap of genes related to T cell activation enriched between optimized S449A and WT groups in J.Lck WT and Y192F cells (P < 0.05). (E) Violin plots showing the distribution of CD69 activation by CITE-seq; horizontal bars show median expression value. (F) Dot plot of GSEA GO pathway enrichment analysis of the DEGs in the optimized S449A versus WT populations of highly activated (as estimated by CD69 expression over median value of 0.65) J.Lck WT or Y192F cells. (G) Dot plot of GSEA GO pathway enrichment analysis of the DEGs in the optimized S449A versus WT populations of less activated J.Lck WT or Y192F cells (CD69 expression of all expressing cells below median 0.65). Specific enriched pathways are labeled in different colors (orange, purple, or blue).
Fig. 7.
Fig. 7.. Phosphorylation of PTPN22 Ser449 facilitates T cell recognition of peptide antigens presented by MHC.
(A) Schematic illustration of the interaction of J.OT1N22 and J.OT1N22 449 cells with antigen-presenting cells pulsed by multiple peptides. (B to D) Flow cytometry analysis of SLP-76, extracellular signal–regulated kinase (ERK) phosphorylation, and CD69 activation in J.OT1 N22 WT or J.OT1 N22 449 cells stimulated with or without 1 nM OVA, Q4R7, T4, Q4H7, G4, Catnb, or VSV control peptide–pulsed T2-Kb cells for the indicated time. Percentage of SLP-76 [Tyr128 (B)] and ERK1/2 [Thr202/Tyr204 (C)] phosphorylation was measured after stimulation for 1 and 5 min, respectively. The activation of CD69 (as % CD69+ cells) was assessed after 16 hours of stimulation (D). Data in histogram are presented as means ± SEM and are from at least three (B to D) independent experiments. Statistical significance was assessed by two-tailed Mann-Whitney test. *P < 0.05, **P < 0.01, ***P < 0.001. (A) created with BioRender (69).
Fig. 8.
Fig. 8.. Phosphorylation of Ptpn22 Ser452 promotes TCR signaling and adaptive responses to immunization.
(A) Protein phosphorylation induced by TCR stimulation in CD4+ effector T cells from Ptpn22WT (n = 3) or Ptpn22S452A mice (n = 3) analyzed by Western blotting (left) and quantification of phosphorylated Lck, Zap70, and Plcϒ normalized to total proteins (right). (B) Flow cytometry analysis of Cd69 activation in CD4+ effector T cells from Ptpn22WT (n = 4) or Ptpn22S452A (n = 4) mice stimulated with or without antibodies against mouse CD3/CD28. (C) Flow cytometry analysis of proliferation of CD4+ effector T cells from Ptpn22WT (n = 4) or Ptpn22S452A (n = 4) mice. (D) Endogenous Rap1 activity in CD4+ effector T cells from Ptpn22WT (n = 3) or Ptpn22S452A (n = 3) mice was assessed through Ral GDS pull down and detected by immunoblotting, and quantification of the precipitated Rap1 was normalized to WT at time 0. (E) Changes in the absolute numbers of CD4+ and CD8+ T cells with naïve (CD44lo CD62Lhi), effector (CD44hi CD62Llo), and central memory (CD44hi CD62Lhi) phenotypes in spleens of aged (over 6 months) Ptpn22WT (n = 11) or Ptpn22S452A (n = 9) mice. (F) An illustration of OVA immunization of Ptpn22WT or Ptpn22S452A mice. (G) OVA-specific IgGs were quantified in 8-week Ptpn22WT (n = 9) or Ptpn22S452A (n = 14) mice immunized by subcutaneous injection at day 10 (priming) and 21 (boosting). (H) Numbers of Tfh (Tcrβ+ CD4+ PD-1+ Bcl6+), GC B cells (Tcrβ CD19+ GL7+ Bcl6+), and Treg cells (Tcrβ+ CD4+ CD25+ FoxP3+) in draining lymph nodes of OVA-immunized Ptpn22WT (n = 7) or Ptpn22S452A (n = 12) mice were analyzed by flow cytometry at 21 days after primary immunization. Representative blots and flow gating are shown (A to D, E, and H). Data represent means ± SEM, and statistical significance was assessed by two-way ANOVA followed by Bonferroni’s post hoc test (A, B, and D) and two-tailed Mann-Whitney test (C, E, G, and H). *P < 0.05, **P < 0.01, ***P < 0.001.
Fig. 9.
Fig. 9.. Ptpn22 Ser452 phosphorylation promotes disease severity in a T cell–dependent lupus mouse model.
(A) Schematic illustration of the 28-day R848 treatment protocol performed on Ptpn22WT (n = 8) or Ptpn22S452A (n = 8) mice. (B) Proteinuria score of Ptpn22WT or Ptpn22S452A mice treated with R848 for 28 days and measured every 7 days. (C) Periodic acid–Schiff (PAS) staining of kidney sections and immunohistochemical staining of IgGs in kidney glomeruli from R848-treated Ptpn22WT or Ptpn22S452A mice. Images were taken at 10× magnifications. Scale bars, 50 μm. IgG intensity in the glomeruli was quantified in each mouse (right). (D) Spleen/body weight ratio and total splenocytes comparison between Ptpn22WT and Ptpn22S452A R848-treated mice. (E to G) Splenocytes analysis by flow cytometry was performed on cells collected at day 28 from Ptpn22WT or Ptpn22S452A mice, and total numbers of target cell populations were quantified. Numbers of total B cells (Tcrβ CD19+), GC B cells (Tcrβ CD19+ GL7+ Bcl6+) (E); total T cells (Tcrβ+), CD4+ T cells (Tcrβ+ CD4+), CD4+ CD8+ T cells (Tcrβ+ CD4+CD8+), CD4+ naïve (Tcrβ+ CD4+CD44lo CD62Lhi), CD4+ effector (Tcrβ+ CD4+CD44hi CD62Llo) T cells (F), Tfh (Tcrβ+ CD4+ PD-1+ Bcl6+), and Treg cells (Tcrβ+ CD4+ CD25+ FoxP3+) (G) were quantified. Data are presented as means ± SEM, and statistical significance was assessed by two-way ANOVA followed by Bonferroni’s post hoc test (B) and two-tailed Mann-Whitney test (C to G). *P < 0.05, **P < 0.01.
Fig. 10.
Fig. 10.. Current working model.
(A) PTPN22 Ser449 is phosphorylated by PKA and induces a PTPN22 conformational change that selectively lowers the affinity of the phosphatase for phosphorylated ZAP70. The consequent hyperphosphorylation of ZAP70 promotes a ZAP70-CD45 feedback loop, which leads to dephosphorylation of LCK Tyr192, which has been shown to facilitate dephosphorylation of inhibitory Tyr505. The overall effect of PTPN22 phospho-Ser449 is to promote TCR signaling and autoimmunity, and it is abolished by the S449A mutation (B), which causes gain-of-function inhibition of TCR signaling and protects mice from autoimmunity. Schematic created with BioRender (69).

References

    1. Moulton V. R., Tsokos G. C., T cell signaling abnormalities contribute to aberrant immune cell function and autoimmunity. J. Clin. Invest. 125, 2220–2227 (2015). - PMC - PubMed
    1. Moulton V. R., Tsokos G. C., Abnormalities of T cell signaling in systemic lupus erythematosus. Arthritis Res. Ther. 13, 207 (2011). - PMC - PubMed
    1. Rother N., van der Vlag J., Disturbed T cell signaling and altered Th17 and regulatory T cell subsets in the pathogenesis of systemic lupus erythematosus. Front. Immunol. 6, 610 (2015). - PMC - PubMed
    1. Moulton V. R., Lo M. S., Tsokos G. C., Methods and protocols to study T cell signaling abnormalities in human systemic lupus erythematosus. Methods Mol. Biol. 900, 25–60 (2012). - PubMed
    1. Park J. S., Perl A., Endosome traffic modulates pro-inflammatory signal transduction in CD4+ T cells—Implications for the pathogenesis of systemic lupus erythematosus. Int. J. Mol. Sci. 24, 10749 (2023). - PMC - PubMed

MeSH terms

Substances