. 2025 Sep 5:10.1158/0008-5472.CAN-25-0315.
doi: 10.1158/0008-5472.CAN-25-0315. Online ahead of print.

PAX3-FOXO1 Drives Targetable Cell State-Dependent Metabolic Vulnerabilities in Rhabdomyosarcoma

Affiliations

PAX3-FOXO1 Drives Targetable Cell State-Dependent Metabolic Vulnerabilities in Rhabdomyosarcoma

Katrina I Paras et al. Cancer Res. .

Abstract

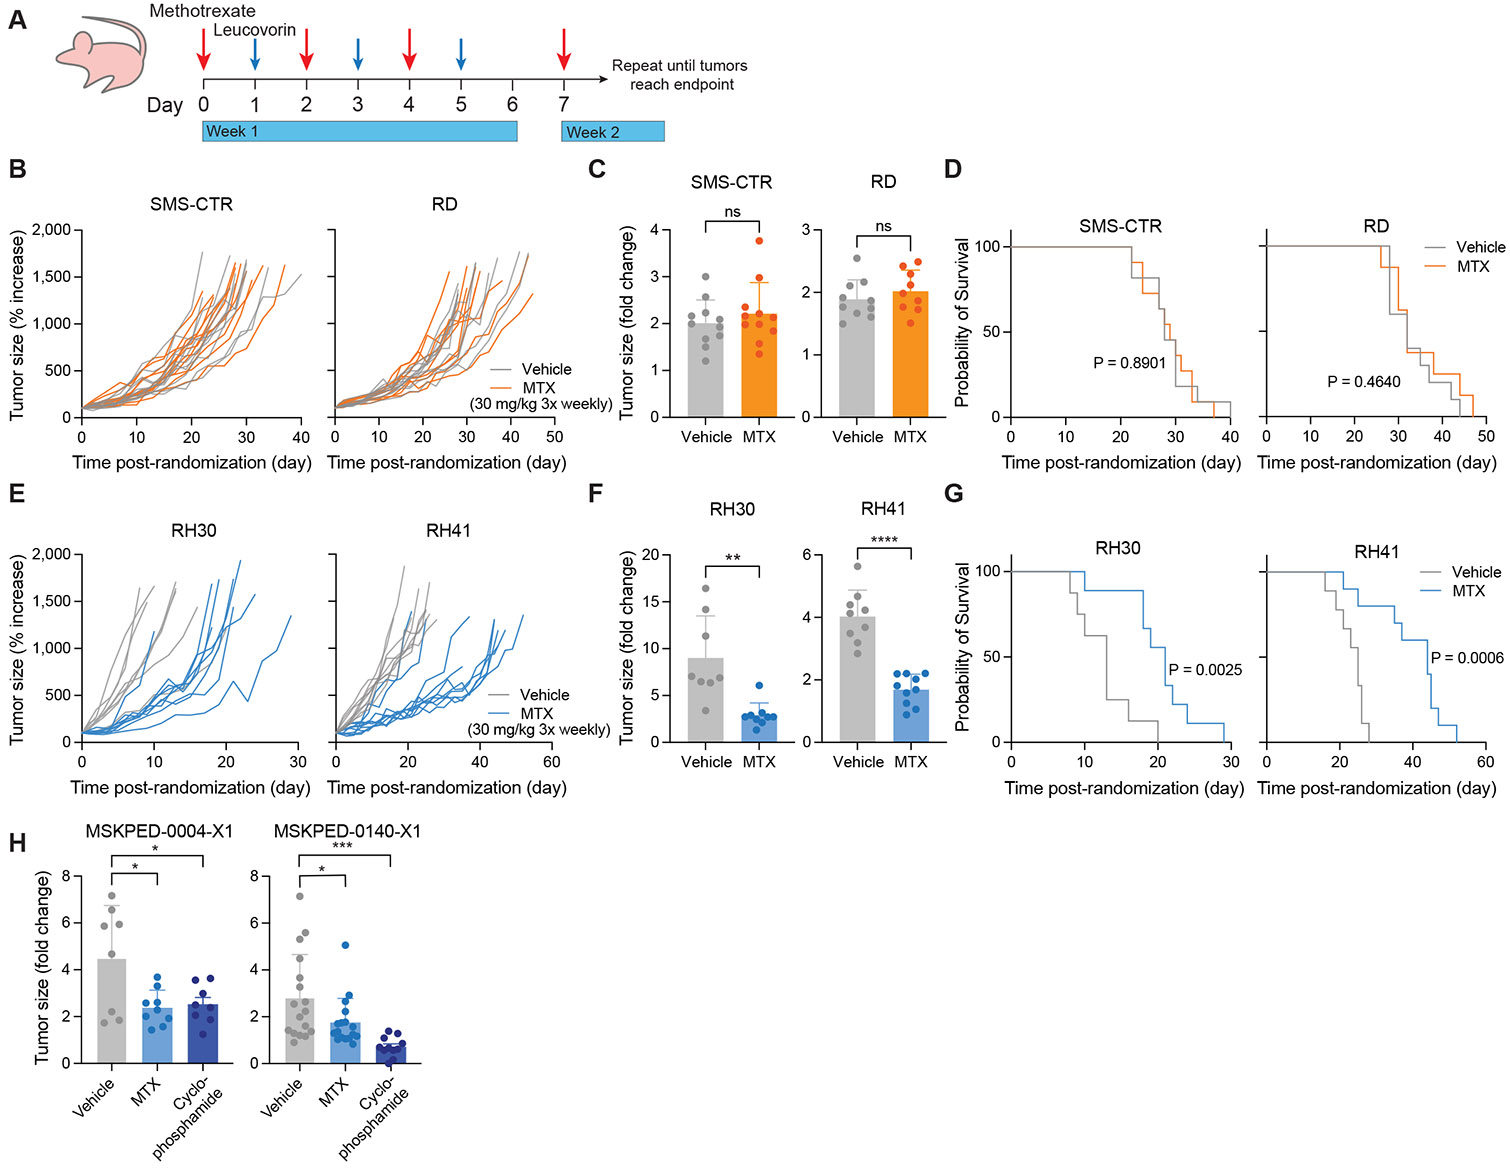
PAX3-FOXO1, an oncogenic transcription factor, drives a particularly aggressive subtype of rhabdomyosarcoma (RMS) by enforcing gene expression programs that support malignant cell states. Here, we showed that PAX3-FOXO1+ RMS cells exhibit altered pyrimidine metabolism and increased dependence on enzymes involved in de novo pyrimidine synthesis, including dihydrofolate reductase (DHFR). Consequently, PAX3-FOXO1+ cells displayed increased sensitivity to inhibition of DHFR by the chemotherapeutic drug methotrexate, and this dependence was rescued by provision of pyrimidine nucleotides. Methotrexate treatment mimicked the metabolic and transcriptional impact of PAX3-FOXO1 silencing, reducing expression of genes related to PAX3-FOXO1-driven malignant cell states. Accordingly, methotrexate treatment slowed the growth of multiple PAX3-FOXO1+ tumor xenograft models but not the fusion-negative counterparts. Taken together, these data demonstrate that PAX3-FOXO1 induces cell states characterized by altered pyrimidine dependence and nominate methotrexate as an addition to the current therapeutic arsenal for treatment of these malignant pediatric tumors.


Conflict of interest statement

The authors declare no potential conflicts of interest.

Figures

Figure 1.
Figure 1.. Rhabdomyosarcoma subtypes harbor intrinsic metabolic differences.
A, Principal component analysis of targeted metabolomics data of 126 metabolites obtained from four RMS cell lines. Ellipses represent 95% confidence intervals within each sample group. B, Venn diagram depicting metabolites that discriminate between PAX3-FOXO1+ and fusion-negative RMS across two independent LC-MS experiments. Metabolites with variable importance in the projection (VIP) scores over 1.0 were included in the analysis. C, Schematic depicting de novo pyrimidine synthesis pathway. D, Levels of N-carbamoyl aspartate, dihydroorotate (DHO), deoxycytidine monophosphate (dCMP), cytidine monophosphate (CMP), and uridine. E, Levels of N-carbamoyl aspartate, dihydroorotate, orotate, and dCMP measured in vehicle-treated fusion-negative (RD) or PAX3-FOXO1+ (RH30) cell line-derived xenograft tumors. F, Volcano plot showing log2 fold change in metabolite abundance in RH30 cells expressing shRNA against PAX3-FOXO1 compared to cells expressing shRNA against Renilla luciferase (control). Cells were cultured with doxycycline for 72 h to induce shRNA expression. Pyrimidine metabolites are highlighted in teal. Dotted horizontal line indicates significance threshold FDR < 0.05. G, Heatmap depicting levels of pyrimidine metabolites in RH30 cells expressing shRNAs against PAX3-FOXO1, expressed as the log2-transformed fold change relative to shRenilla. Data are from same experiment as data shown in F. H, Heatmap of gene signature scores for pyrimidine, purine, and TCA cycle genes obtained from published single-cell RNA-sequencing data of KFR RMS cells expressing shRNA against PAX3-FOXO1 (shScramble serves as a control). Cells were ranked in order of increasing cycling progenitor signature score. Gene lists are provided in Supplementary Table 2. For D, data are mean ± s.d., n = 3 independent replicates. For E, data are mean ± s.d., n = 8 (RH30) or n = 6 (RD). Statistical significance was assessed by ordinary one-way ANOVA with Tukey’s multiple comparisons test with each PAX3-FOXO1+ cell line compared to each fusion-negative cell line (D) or unpaired two-tailed Student’s t test comparing RD and RH30 (E). (*P < 0.05, **P < 0.01, ***P < 0.001, ****P < 0.0001)
Figure 2.
Figure 2.. Genome-wide CRISPR screens reveal metabolic vulnerabilities specific to PAX3-FOXO1+ RMS.
A, Results of differential essentiality analysis comparing PAX3-FOXO1+ and fusion negative cell lines. Genes are ranked in descending order of differential essentiality. Data were obtained from DepMap 24Q2 release. B, Bar graph of the top 15 metabolic genes more essential in PAX3-FOXO1+ RMS cell lines compared to fusion-negative RMS cell lines. DHFR and TYMS are highlighted in blue. Data were obtained from DepMap 24Q2 release. C, Violin plots of gene essentiality scores (obtained from DepMap 24Q2 release) for DHFR and TYMS in fusion-negative RMS cell lines (n = 5), PAX3-FOXO1+ RMS cell lines (n = 7), or all other cell lines (n = 1,121). Lines represent median of each group. D, Schematic depicting DHFR and TYMS in the folate cycle (DHF = dihydrofolate; THF = tetrahydrofolate; 5,10-CH2-THF = 5,10-methylene THF; 10-CHO-THF = 10-formyl THF). E, Relative proliferation of RMS cells in response to DHFR editing using two independent sgRNAs (sgDHFR-1, sgDHFR-2). Data are shown as a percentage of control (sgAAVS1) for each cell line, and are mean ± s.d., n = 3 independent replicates. F, Summary of effects of DHFR loss on proliferation in 3 fusion-negative and 2 PAX3-FOXO1+ RMS cell lines. Data are from the same experiment as E. Significance was assessed using ordinary one-way ANOVA with Dunnett’s (C) or Tukey’s (E) multiple comparisons test. In C, each RMS subtype was compared to all other lines in DepMap. In E, for each sgRNA, each PAX3-FOXO1+ cell line was compared to each fusion-negative cell line. Significance displayed is reflective of all comparisons. (ns = not significant, **P < 0.01, ****P < 0.0001)
Figure 3.
Figure 3.. PAX3-FOXO1+ cells exhibit increased sensitivity to DHFR inhibition in vitro.
A, Schematic of the folate cycle indicating targets of methotrexate (MTX). B, Dose response curve for MTX in RMS cell lines measured by CellTiter-Glo viability assay after 48 h of treatment. Maximum dose tested was 200 μM. C, Relative proliferation of RMS cells in response to MTX (0.2 μM) for 96 h. Data are shown as a percentage of the vehicle control (DMSO). D, Summary of the effects of MTX on relative proliferation from C. Each dot represents the average of all replicates from each cell line. E, Correlation matrix displaying Pearson correlation coefficients (r) for pairwise comparisons of metabolic effects of MTX in four RMS cell lines treated with MTX (0.2 μM) for 48 h. Correlation coefficients were calculated using the log2 fold change of MTX over vehicle (DMSO) for each metabolite. F, Volcano plots for two RMS cell lines (RH41, PAX3-FOXO1+ and RD, fusion-negative) showing the log2 fold change in metabolite abundance in cells treated with MTX (0.2 μM, 48 h) compared to cells treated with vehicle (DMSO). Dotted horizontal line indicates significance threshold FDR < 0.05. G, Relative proliferation of RMS cells in response to MTX (0.2 μM) in the presence or absence of thymidine (10 μM), hypoxanthine (100 μM), and/or cytidine (10 μM) for 96 h. Data are shown as a percentage of the vehicle control (DMSO, H2O, 0.1N NaOH). For B, C, and G, data are mean ± s.d., n = 3 independent replicates. Significance was assessed by ordinary one-way ANOVA with Tukey’s multiple comparisons test (B, C), unpaired two-tailed Student’s t-test (D), or 2-way ANOVA with Tukey’s multiple comparisons test (G). In B, C, and G, each PAX3-FOXO1+ cell line was compared to each fusion-negative cell line. For B, comparison shown at the 0.2 μM dose. (ns = not significant, *P < 0.05, **P < 0.01, ***P < 0.001, ****P < 0.0001)
Figure 4.
Figure 4.. Methotrexate phenocopies loss of PAX3-FOXO1.
A, Principal component analysis of RH30 cells treated with vehicle (DMSO) or MTX (0.2 μM) for 48 h, and RH30 cells expressing shRNA against Renilla luciferase (control) or PAX3-FOXO1 (cultured with doxycycline for 72 h to induce knockdown). MTX data were previously shown in Fig. 1A and shPAX3-FOXO1 data were previously shown in Fig. 1D. 101 metabolites were included in analysis. B, Scatter plot of metabolic data shown in A comparing metabolic effects of MTX and PAX3-FOXO1 silencing in RH30 cells. Pyrimidine metabolites are highlighted in teal. C, Overrepresentation analysis of genes significantly (Padj < 0.05) upregulated (“up with MTX”) or downregulated (“down with MTX”) upon MTX treatment in two PAX3-FOXO1+ cell lines (RH30, RH41). Analysis was performed using cell fate gene lists detailed in Supplementary Table 2. Cells were treated with MTX (0.2 μM) for 48 h. D, Gene set enrichment analysis (GSEA) depicting the effect of MTX on cell fate gene lists in two PAX3-FOXO1+ cell lines (RH30, RH41). Cells were treated with MTX (0.2 μM) for 48 h. E, Heatmap of Pearson correlation coefficients (r) comparing transcriptional effects of MTX (in each RMS cell line) against effects of PAX3-FOXO1 silencing (in KFR cell line, published data). Correlation coefficients were calculated for all genes and for genes involved in cell fate. Cells were treated with MTX (0.2 μM) for 48 h. F, Heatmap depicting normalized enrichment scores from GSEA analysis of data from four MTX-treated RMS cell lines. Gene lists (1, 2, and 3) are composed of genes significantly upregulated or downregulated by PAX3-FOXO1 in three independent published experiments,. G, Gene set signature scores in published RNA-sequencing of RMS patient tumors using gene lists composed of genes significantly (P < 0.05) upregulated (“MTX up”) or downregulated (“MTX down”) by MTX in two PAX3-FOXO1+ cell lines (RH30, RH41). Gene lists are provided in Supplementary Table 2. Significance was assessed in G by unpaired two-tailed Student’s t test comparing RMS subtypes. (*P < 0.05, **P < 0.01, ****P < 0.0001)
Figure 5.
Figure 5.. Methotrexate is effective as a single agent in PAX3-FOXO1+ tumors.
A, Schematic depicting dosing strategy for methotrexate and leucovorin rescue in RMS cell line xenograft experiments. B, E, Tumor growth curves for fusion-negative RMS (B, SMS-CTR and RD) and PAX3-FOXO1+ RMS (E, RH30 and RH41) cell line xenografts. Data are normalized to tumor size at the start of treatment. C, F, Change in tumor size for fusion-negative RMS (C, SMS-CTR and RD) and PAX3-FOXO1+ RMS (F, RH30 and RH41) cell line xenografts over the first week (6-8 d) of treatment with vehicle (corn oil) or MTX. Data are shown as a fold change relative to tumor size at the start of treatment. D, G, Survival curves for mice bearing fusion-negative RMS (D, SMS-CTR and RD) or PAX3-FOXO1+ RMS (G, RH30 and RH41) cell line xenografts. H, Change in tumor size for two PAX3-FOXO1+ PDX models (MSKPED-0004-X1, left and MSKPED-0140-X1, right) over the first week of treatment with vehicle (corn oil), MTX, or cyclophosphamide. Data are shown as a fold change relative to tumor size at the start of treatment. Data are mean ± s.d. For SMS-CTR (B, C, D), n = 11. For RD (B, C, D), n = 10 (vehicle) or 9 (MTX). For RH30 (E, F, G), n = 8 (vehicle) or 9 (MTX). For RH41 (E, F, G), n = 9 (vehicle) or 10 (MTX). For MSKPED-0004-X1 (H), n = 8 (vehicle, cyclophosphamide) or 9 (MTX). For MSKPED-0140-X1 (H), n = 17 (vehicle, MTX) or 11 (cyclophosphamide). Significance was assessed by log-rank (Mantel-Cox) test (D, G), unpaired two-tailed Student’s t-test (C, F), or ordinary one-way ANOVA with Dunnett’s multiple comparisons test (H). In H, each treatment group was compared to vehicle control. (ns = not significant, *P < 0.05, **P < 0.01, ***P < 0.001, ****P < 0.0001)

Update of

References

    1. Tippetts TS, Sieber MH, Solmonson A. Beyond energy and growth: the role of metabolism in developmental signaling, cell behavior and diapause. Development. Oct 15 2023;150(20):dev201610. - PMC - PubMed
    1. Jackson BT, Finley LWS. Metabolic regulation of the hallmarks of stem cell biology. Cell Stem Cell. Feb 1 2024;31(2):161–180. - PMC - PubMed
    1. Tu WB, Christofk HR, Plath K. Nutrient regulation of development and cell fate decisions. Development. Oct 15 2023;150(20) - PMC - PubMed
    1. Erez A, DeBerardinis RJ. Metabolic dysregulation in monogenic disorders and cancer - finding method in madness. Nat Rev Cancer. Jul 2015;15(7):440–8. - PubMed
    1. DeBerardinis RJ, Thompson CB. Cellular metabolism and disease: what do metabolic outliers teach us? Cell. Mar 16 2012;148(6):1132–44. - PMC - PubMed