. 2025 Sep 5;13(9):e012211.
doi: 10.1136/jitc-2025-012211.

Differential phagocytosis induces diverse macrophage activation states in malignant gliomas

Affiliations

Differential phagocytosis induces diverse macrophage activation states in malignant gliomas

Senthilnath Lakshmanachetty et al. J Immunother Cancer. .

Abstract

Background: Diffuse midline glioma (DMG) and glioblastoma (GBM) are aggressive brain tumors with limited treatment options. Macrophage phagocytosis is a complex, tightly regulated process governed by competing pro-phagocytic and anti-phagocytic signals. CD47-SIRPα signaling inhibits macrophage activity, while radiotherapy (RT) can enhance tumor immunogenicity. How RT and CD47 blockade together modulate macrophage "appetite" and activation states remains poorly understood, particularly in the context of glioma immune evasion and therapy resistance.

Methods: Human and mouse glioma cell lines were exposed to fractionated RT, anti-CD47 monoclonal antibody, or both. Flow cytometry and ELISA quantified the induction of immunogenic cell death (ICD) and expression of damage-associated molecular patterns (DAMPs). In vitro, phagocytosis assays were performed using peripheral blood mononuclear cell-derived and bone marrow-derived macrophages. Single-cell RNA sequencing (scRNA-seq) was used to analyze transcriptional changes in macrophage subsets that phagocytosed ("eaters") or did not phagocytose ("non-eaters") glioma cells. In vivo, efficacy of combination therapy was assessed using orthotopic xenograft and syngeneic mouse models of DMG and GBM.

Results: RT induced ICD in glioma cells, evidenced by dose-dependent increases in DAMPs such as phosphatidylserine, calreticulin, HSP70/90, and HMGB1. RT and anti-CD47 each promoted macrophage-mediated phagocytosis, with a synergistic effect observed when combined. scRNA-seq of phagocytic macrophages revealed transcriptionally distinct subpopulations associated with each treatment, characterized by enrichment in inflammatory, metabolic, and antigen presentation pathways. In vivo, combination therapy significantly reduced tumor burden, extended survival, and polarized tumor-associated macrophages toward a pro-inflammatory (M1-like) phenotype. Distinct macrophage markers (CLEC7A, CD44, CD63) validated scRNA-seq findings in vivo.

Conclusions: This study highlights that macrophage fate is intimately linked to the molecular properties of what they phagocytose. Phagocytosis is not a singular, uniform process but a dynamic and context-dependent event that drives macrophage specialization and plasticity. By demonstrating that RT and anti-CD47 therapy shape distinct macrophage phenotypes through their effects on tumor immunogenicity, this study provides a framework for understanding how to harness and reprogram macrophage activity for therapeutic benefit. These findings underscore the potential of targeting macrophage plasticity as a strategy to enhance antitumor immunity and improve outcomes in malignant gliomas and other diseases.

Keywords: Combination therapy; Immunotherapy; Innate; Macrophage.


Conflict of interest statement

Competing interests: No, there are no competing interests.

Figures

Figure 1
Figure 1. Radiation therapy induces surface expression and release of damage-associated molecular patterns in human DMG/DIPG. Human patient-derived DMG/DIPG cell lines were exposed to increasing doses of RT for three consecutive days. (A–D) Representative overlay histograms and median fluorescence intensity (MFI) values displaying the expression levels of phosphatidylserine, calreticulin, heat shock protein (HSP70), and HSP 90 on the surface of BT245, SU-DIPGXVII and SU-DIPGXXV cells. Results are expressed as mean+SD (n=3 technical replicates). Unpaired Student’s t-test: p<0.05, **p<0.01. (E) 24 hours post the final RT treatment, HMGB1 released in the supernatants of BT245, SU-DIPGXVII and SU-DIPGXXV cells were quantified. Results are expressed as mean+SD (n=3 technical replicates); Unpaired Student’s t-test: p<0.05, **p<0.01. DMG, diffuse midline glioma; HMGB1, high mobility group protein 1; RT, radiotherapy.
Figure 2
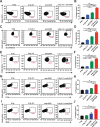
Figure 2. Combining radiation therapy with anti-CD47 mAb treatment enhances in vitro phagocytosis of human DIPG and mouse glioma cell lines. Human patient-derived DMG cell lines (BT-245, SU-DIPGXVII, and SU-DIPGXXV) were exposed to either 0 or 4 Gy×3 and incubated with human peripheral blood-derived macrophages in the presence of anti-CD47 mAb, HU5F9-G4. Flow cytometry (A, C, and E) as well as histogram (B, D, and F) plots show that combining fractionated irradiation and anti-CD47 antibody treatment increases the phagocytosis of DIPG/DMG cells by macrophages compared with individual treatments alone. (G–J) Mouse glioblastoma cell lines (SB28 and CT2A) were exposed to either 0 or 4 Gy×3 and incubated with mouse bone marrow-derived macrophages in the presence of anti-CD47 mAb, MIAP301. Data shown are consistent with two independent experiments (n=3) and are shown as mean+SD. Unpaired Student’s t-test. *p<0.05, **p<0.01 and ***p<0.0001. One-way analysis of variance, ****p<0.0001 (BT245), ***p<0.001 (DIPGXVII) and ****p<0.0001 (DIPGXXV). ***p<0.001 (CT2A) and **p<0.001 (SB28). DMG, diffuse midline glioma; mAb, monoclonal antibody.
Figure 3
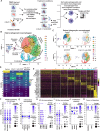
Figure 3. Single-cell RNA sequencing reveals the enrichment of distinct macrophage subsets following co-culture with diffuse midline glioma cells pretreated with either control, RT, anti-CD47 therapy, or combination of RT and anti-CD47 therapy. (A) Schematic diagram of the workflow used for in vitro phagocytosis and single-cell RNA sequencing. Briefly, BT245 cells were irradiated (4Gy×3) treated for three consecutive days and treated with either PBS or anti-CD47 mAb for 30 min at 37°C and co-cultured with PBMC-derived macrophages for 24 hours. BT245 cells not exposed to radiation and treated with PBS served as controls. Macrophages that either phagocytose (“eaters”) or do not phagocytose (“non-eaters”) tumor cells were sorted using flow cytometry and subjected to single-cell RNA-sequencing. (B) UMAP projection displaying 11 distinct cell clusters from the eater’s cohort. Each dotted line and arrow indicate the identity of that specific cell cluster. (C–D) UMAP plots and proportion of cells in each cluster from four treatment groups: control, 4 Gy×3, anti-CD47, or 4 Gy×3+anti-CD47. Dotted lines indicate the expansion/enrichment of distinct macrophage clusters in that treatment condition. Note the expansion/enrichment of two distinct cell clusters (1 and 3) in the combination treatment. (E) Heatmap of marker genes in each cell cluster. Representative genes with higher gene expression for each cluster are outlined on the left. Bubble plots demonstrating expression of marker genes associated with antigen presenting (F), inflammatory (G), M1-like (H), M2-like (I), proliferation (J), and tumor cell signature (K) by the various cell clusters. The dotted box indicates the cell clusters with higher average marker gene expression. The size of the bubble dot is proportional to the percentage of cells in a cluster expressing the marker gene and the color intensity is proportional to average scaled marker gene expression within a cluster. mAb, monoclonal antibody; PBMC, peripheral blood mononuclear cell; PBS, phosphate-buffered saline; RT, radiotherapy; UMAP, Uniform Manifold Approximation and Projection.
Figure 4
Figure 4. Characterization of macrophages that are enriched following phagocytosis of diffuse midline glioma cells pretreated with Control, anti-CD47 therapy or RT. (A) Volcano plot showing the top differentially upregulated and downregulated genes in the macrophages that are enriched after co-culture with control treated BT245 cells (cell Cluster 0) compared with macrophages that were enriched after co-culture with either anti-CD47 (cell Cluster 1) or RT (cell Cluster 3) treated BT245 cells. (B) Gene Ontology enrichment analysis of biological process for significantly upregulated genes between control-enriched macrophages versus anti-CD47-enriched and RT-enriched macrophages. Note only the top 15 biological processes are shown. (C) Volcano plot showing the top differentially upregulated and downregulated genes in the macrophages that are enriched after co-culture with anti-CD47 treated BT245 cells (cell Cluster 1) compared with macrophages that were enriched after co-culture with either control (cell Cluster 0) or RT (cell Cluster 3) treated BT245 cells. (D) Gene Ontology enrichment analysis of biological processes for significantly upregulated genes between anti-CD47-enriched macrophages versus control-enriched and RT-enriched macrophages. Note only the top 15 biological processes are shown. (E) Volcano plot showing the top differentially upregulated and downregulated genes in the macrophages that are enriched after co-culture with RT treated BT245 cells (cell Cluster 3) compared with macrophages that were enriched after co-culture with either control (cell Cluster 0) or anti-CD47 (cell Cluster 1) treated BT245 cells. (F) Gene Ontology enrichment analysis of biological processes for significantly upregulated genes between control-enriched macrophages versus anti-CD47-enriched and RT-enriched macrophages. Note only the top 15 biological processes are shown. BP, biological process; FC, fold change; NS, not significant; RT, radiotherapy.
Figure 5
Figure 5. Combination of RT and anti-CD47 treatment reduces tumor burden and prolongs the survival of mice bearing BT245 xenografts compared with monotherapy. (A) Schematic diagram showing the experimental treatment plan followed. (B) Quantification of total IVIS flux values over time course. (C) Kaplan-Meier survival analysis of BT245 xenografts with indicated treatments, control, n=10; RT, n=9; anti-CD47, n=10; and RT+anti-CD47, n=10. The log-rank test was used to calculate statistical significance. *p<0.05, **p<0.01. (D–F) Bar graphs demonstrating the relative percentages of F4/80+, CD80+ (M1-like) and CD206+ (M2-like) tumor-associated macrophages in control, RT, anti-CD47, or RT+anti-CD47 treated mice bearing BT245 xenografts. Data shown are obtained from n=3 mice for each group and are represented as mean+SD. Unpaired Student’s t-test: *p<0.05, **p<0.01 and ***p<0.0001. IP, intraperitoneal; IVIS, In Vivo Imaging System; RT, radiotherapy.
Figure 6
Figure 6. Combination of RT and anti-CD47 treatment reduces tumor burden and prolongs the survival of mice-bearing CT-2A intracranial allografts compared with monotherapy. (A) Schematic diagram showing the experimental treatment plan followed. (B) Quantification of total IVIS flux values over time course. (C) Kaplan-Meier survival analysis of CT-2A allografts with indicated treatments, control, n=8; RT, n=8; anti-CD47, n=8; and RT+anti-CD47, n=8. The log-rank test was used to calculate statistical significance. *p<0.05, **p<0.01, ***p<0.001. ns, not significant. (D–F) Bar graphs demonstrating the relative percentages of F4/80+, CD80+ (M1-like) and CD206+ (M2-like) tumor-associated macrophages in control, RT, anti-CD47, or RT+anti-CD47 treated mice bearing CT-2A intracranial allografts. Data shown are obtained from n=3 mice for each group and are represented as mean+SD. Unpaired Student’s t-test: *p<0.05, **p<0.01 and ***p<0.0001. IP, intraperitoneal; IVIS, In Vivo Imaging System; RT, radiotherapy.
Figure 7
Figure 7. Validation of marker genes identified from single-cell RNA-sequencing using tumor-associated macrophages obtained from murine diffuse midline gliomas and glioblastoma intracranial allografts treated with either control, RT, anti-CD47, or RT+anti-CD47. (A) Dot plot indicates the average expression of CLEC7A, CD44 (D), and (G) for each cell cluster identified from single-cell RNA-sequencing. (B–C) Representative overlay histograms and median fluorescence intensity (MFI) values of CLEC7A, CD44 (E–F), and CD63 (H–I), expression in gliomas isolated from mice treated with either phosphate-buffered saline (control), RT, anti-CD47 therapy, or RT with anti-CD47 combination therapy. Data shown are obtained from n=3 mice for each group and are represented as mean+SD. Unpaired Student’s t-test: *p<0.05, **p<0.01 and ***p<0.0001. RT, radiotherapy.

Update of

References

    1. Johung TB, Monje M. Diffuse Intrinsic Pontine Glioma: New Pathophysiological Insights and Emerging Therapeutic Targets. Curr Neuropharmacol. 2017;15:88–97. doi: 10.2174/1570159x14666160509123229. - DOI - PMC - PubMed
    1. Jiao Y, Cao F, Liu H. Radiation-induced Cell Death and Its Mechanisms. Health Phys. 2022;123:376–86. doi: 10.1097/HP.0000000000001601. - DOI - PMC - PubMed
    1. Sinn M, Ganeshan R, Graf R, et al. Intensity-modulated and image-guided radiotherapy in patients with locally advanced inoperable pancreatic cancer after preradiation chemotherapy. ScientificWorldJournal. 2014;2014:452089. doi: 10.1155/2014/452089. - DOI - PMC - PubMed
    1. Brandmaier A, Formenti SC. The Impact of Radiation Therapy on Innate and Adaptive Tumor Immunity. Semin Radiat Oncol. 2020;30:139–44. doi: 10.1016/j.semradonc.2019.12.005. - DOI - PubMed
    1. Yu S, Wang Y, He P, et al. Effective Combinations of Immunotherapy and Radiotherapy for Cancer Treatment. Front Oncol. 2022;12:809304. doi: 10.3389/fonc.2022.809304. - DOI - PMC - PubMed