. 2025 Oct;27(10):1771-1784.
doi: 10.1038/s41556-025-01760-4. Epub 2025 Sep 5.

Phase separation of ERCC6L2-CtIP regulates the extent of DNA end resection

Affiliations

Phase separation of ERCC6L2-CtIP regulates the extent of DNA end resection

Yixin Yin et al. Nat Cell Biol. 2025 Oct.

Abstract

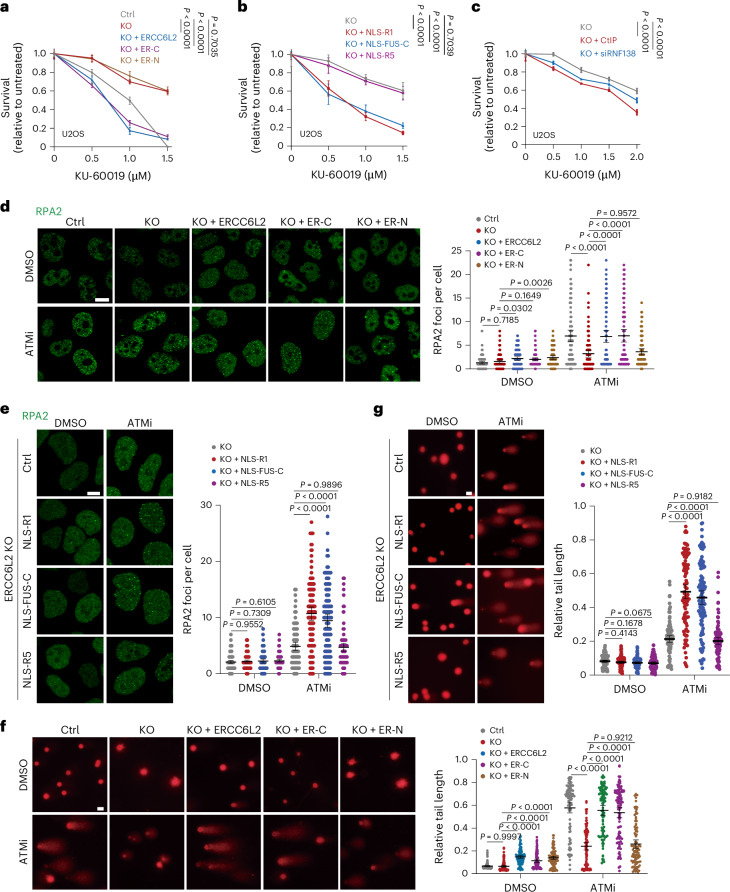
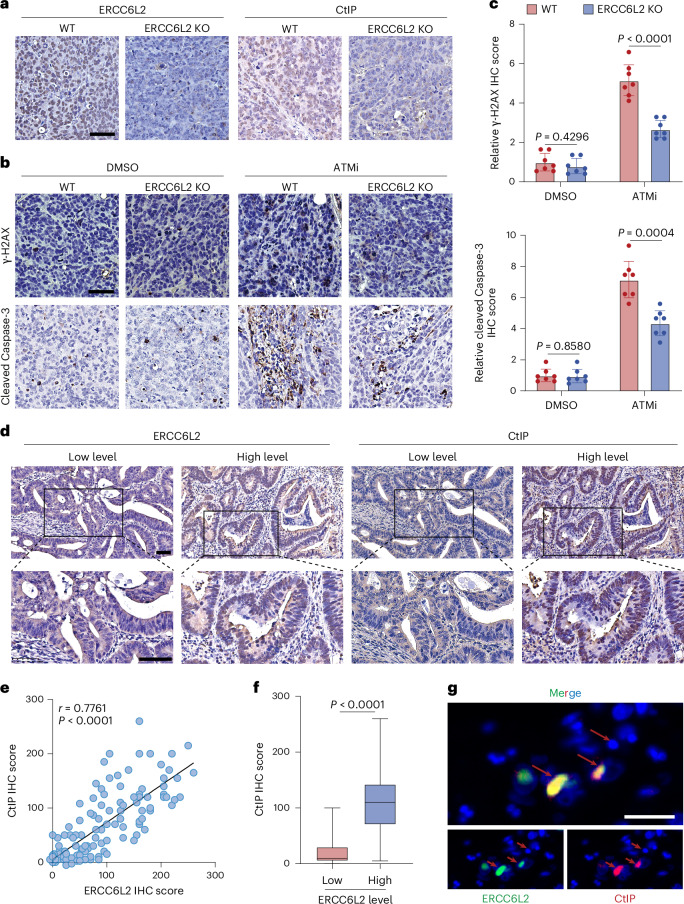
The ataxia telangiectasia mutated (ATM) kinase orchestrates the early stages of DNA double-strand break repair by promoting hyperphosphorylation of CtIP, a key step in the initiation of DNA end resection. However, the regulatory mechanisms controlling resection extent remain incompletely understood. Here we identify ERCC6L2 as a key regulator of DNA end resection in response to ATM inhibition. ERCC6L2 undergoes liquid-liquid phase separation via its intrinsically disordered regions, forming dynamic nuclear condensates that regulate CtIP stability. Disruption of these condensates renders CtIP susceptible to RNF138-mediated ubiquitination and degradation, thereby mitigating the heightened chromatin recruitment of CtIP induced by ATM inhibition. Intriguingly, ERCC6L2 is frequently downregulated in multiple cancer types and correlates with resistance to ATM inhibitors in both in vitro and in vivo settings. Our findings unveil the crucial role of ERCC6L2-CtIP condensates in governing the extent of DNA end resection and underscore the potential significance of ERCC6L2 as a predictive biomarker for ATM inhibitor response.


Conflict of interest statement

Competing interests: The authors declare no competing interests.

Figures

Fig. 1
Fig. 1. Loss of ERCC6L2 induces ATMi resistance in cancer cells.
ah, Clonogenic survival assays of U2OS (a and b), HeLa (c and d), DLD-1 (e and f) and HCT116 (g and h) cells after treatment with KU-60019 (a, c, e and g) or KU-55933 (b, d, f and h) in stable clones of ERCC6L2 KO via CRISPR–Cas9. #1 and #2 indicate independent sgRNAs. Colony formation was quantified based on the area covered by colonies. Data are presented as mean ± s.d. (n = 3 biological replicates, two-way ANOVA). i,j, Clonogenic survival assays detecting the impact of ERCC6L2 rescue after treatment with ATMi (KU-60019) in ERCC6L2-KO U2OS (i) and DLD-1 (j) cells. Colony formation was quantified based on the area covered by colonies. Data are presented as mean ± s.d. (n = 3 biological replicates, two-way ANOVA). km, Xenograft assay of ERCC6L2 in DLD-1 cells (n = 7 per group). Nude mice were injected subcutaneously with control (Ctrl) or ERCC6L2-KO DLD-1 cells, and randomly assigned to treatment with DMSO or ATMi (KU-55933, 10 mg kg−1). Tumour images (k), tumour volume (l) and tumour weight (m) are shown. Data are presented as mean ± s.d. (n = 7 biologically independent mice, two-way ANOVA or two-tailed Student’s t-test). Source data
Fig. 2
Fig. 2. KO of ERCC6L2 reduces DNA damage induced by the ATMi.
a, Neutral comet assays were performed using Ctrl or ERCC6L2-KO U2OS cells treated with DMSO or ATMi (KU-60019, 5 μM) for 24 h. Representative images (left) and quantification of the tail length relative to the nucleus (right). Scale bars, 25 μm. Data are presented as mean ± 95% confidence interval (CI) (DMSO, n = 103 Ctrl, 101 KO#1, 101 KO#2; ATMi, n = 105 Ctrl, 104 KO#1, 101 KO#2; one-way ANOVA). b, Immunoblot analysis of γ-H2AX levels in Ctrl and ERCC6L2-KO U2OS cells after ATMi (KU-60019, 5 μM) treatment. cf, IF and quantification analysis of γ-H2AX (c), RPA2 (d), RAD51 (e) and BRCA1 (f) foci, merged with DAPI-stained nuclei, following 24 h or 48 h exposure to DMSO or ATMi (KU-60019, 5 μM) in Ctrl and ERCC6L2-KO U2OS cells. Scale bars, 10 μm. Data are presented as mean ± 95% CI (c, e and f, n = 100 in each group; d, DMSO, n = 106 Ctrl, 105 KO#1, 103 KO#2; ATMi, n = 101 Ctrl, 103 KO#1, 102 KO#2; one-way ANOVA). Data are representative of at least three independent experiments (af). Source data
Fig. 3
Fig. 3. ERCC6L2 deficiency reduces the excessive end resection induced by the ATMi.
a, IF and quantification analysis of BrdU foci, merged with DAPI-stained nuclei, following 24 h exposure to DMSO or ATMi (KU-60019, 5 μM) in Ctrl and ERCC6L2-KO U2OS cells. Scale bar, 10 μm. Data are presented as mean ± 95% CI (DMSO, n = 102 Ctrl, 101 KO#1, 100 KO#2; ATMi, n = 119 Ctrl, 125 KO#1, 106 KO#2; one-way ANOVA). b, Changes in ssDNA length in Ctrl, ERCC6L2-KO and siCtIP U2OS cells following 24 h exposure to DMSO or ATMi (KU-60019, 5 μM). Representative images of the SMART assay (left) and the quantification (right) are shown, with siCtIP serving as a Ctrl. Scale bar, 5 μm. Data are presented as mean ± 95% CI (DMSO, n = 101 Ctrl, 102 KO#1, 100 KO#2; ATMi, n = 103 Ctrl, 104 KO#1, 106 KO#2; one-way ANOVA). c,d, Schematic of DNA end-resection measurement (c). ssDNA was quantified by qPCR at 335 bp or 1,618 bp downstream of the AsiSI-induced break site in U2OS cells transfected with siNC, siERCC6L2 or siCtIP, with or without DSB induction (4-hydroxytamoxifen). siCtIP served as a Ctrl (d). Data are presented as mean ± s.d. (n = 3 biological replicates; two-tailed Student’s t-test). e, Immunoblot analysis of the indicated proteins in subcellular fractions of Ctrl and ERCC6L2-KO U2OS cells after treatment with 5 μM ATMi (KU-60019) for 24 h. β-Actin was used as the Ctrl for the total cell lysates and the nucleus-soluble proteins. Histone H3 was used as the Ctrl for the chromatin-bound proteins. ‘Sol’ refers to nucleus-soluble proteins, and ‘Chr’ refers to chromatin-bound proteins. f, IF and quantification analysis of CtIP foci, merged with DAPI-stained nuclei, following 12 h exposure to DMSO or ATMi (KU-60019, 5 μM) in Ctrl and ERCC6L2-KO U2OS cells. Scale bar,10 μm. Data are presented as mean ± 95% CI (DMSO, n = 105 Ctrl, 115 KO#1, 108 KO#2; ATMi, n = 111 Ctrl, 124 KO#1, 105 KO#2; one-way ANOVA). Data are representative of at least three independent experiments (a, b, e and f). Source data
Fig. 4
Fig. 4. ERCC6L2 interacts and forms dynamic condensates with CtIP.
a, Immunoblot analysis of ERCC6L2 protein levels in cytoplasmic, nuclear and whole-cell lysate fractions of HEK-293T cells. Lamin B1 and GAPDH serve as nuclear and cytoplasmic markers, respectively. b, Co-IP assays showed the interaction between ERCC6L2 and CtIP in the nucleus of HEK-293T cells. c,d, Co-IP assays of the interaction between ERCC6L2 and CtIP in U2OS cells. Co-IP with anti-Flag antibody (c). Co-IP with anti-Myc antibody (d). e, IF analysis of endogenous ERCC6L2 and CtIP showed nuclear puncta in U2OS cells. Blue indicates DAPI-stained nuclei. Scale bars, 2 μm. f, The disordered region of ERCC6L2 was analysed using PONDR (https://www.pondr.com). Scores above 0.5 indicate disorder. g, A schematic diagram of truncated mutants of ERCC6L2. h, HEK-293T cells were transfected with EGFP-ERCC6L2, EGFP-ER-C or EGFP-ER-N plasmids for 48 h. EGFP-ERCC6L2 and EGFP-ER-C showed puncta in the nucleus. Blue indicates DAPI-stained nuclei. Scale bar, 5 μm. i, Representative images from the FRAP experiments of EGFP-ER-C (top) or mCherry-CtIP (middle). The dotted white square highlights the puncta undergoing targeted bleaching. Scale bars, 5 μm. Quantification of FRAP data for EGFP-ER-C (bottom left) and mCherry-CtIP puncta (bottom right). Bleaching event occurs at t = 0 s. Data are presented as mean ± s.d. n = 3 foci analysed in 3 independent experiments. j, HEK-293T cells were co-transfected with EGFP-ERCC6L2 and mCherry-CtIP. Left: representative images from the FRAP experiments of EGFP-ERCC6L2 and mCherry-CtIP. The dotted white square highlights the puncta undergoing targeted bleaching. Scale bars, 5 μm. Right: quantification of FRAP data for EGFP-ERCC6L2 and mCherry-CtIP puncta. Bleaching event occurs at t = 0 s. Data are presented as mean ± s.d. n = 3 foci analysed in 3 independent experiments. k, ERCC6L2-KO U2OS cells were transfected with NLS-EGFP-tagged constructs (vector, R1, R2, R3 or R4) for 48 h. R1 showed puncta in the nucleus. Scale bar, 2 μm. l, Representative images from the FRAP experiments of NLS-EGFP-R1 (left). The dotted white square highlights the puncta undergoing targeted bleaching. Scale bar, 5 μm. Quantification of FRAP data for NLS-EGFP-R1 (right). Bleaching event occurs at t = 0 s. Data are presented as mean ± s.d. n = 3 foci analysed in 3 independent experiments. Data are representative of at least three independent experiments (ae, h and k). Source data
Fig. 5
Fig. 5. The phase separation property of ERCC6L2 regulates CtIP abundance.
a, Co-IP assays in U2OS cells transfected with the indicated Flag-ERCC6L2 truncations. b, Co-IP assays in U2OS cells transfected with the indicated NLS-EGFP-ERCC6L2 truncations. c, A schematic diagram of truncated mutants of ERCC6L2. d, HEK-293T cells were transfected with EGFP-ER-C, NLS-EFGP-R5 or NLS-EGFP-FUS-C plasmids for 48 h. EGFP-ER-C and NLS-EGFP-FUS-C showed puncta in the nucleus. Representative images (top) and graphical quantitation of condensates (bottom). Scale bar, 5 μm. Data are presented as mean ± 95% CI (n = 53 EGFP-ER-C, 51 NLS-EGFP-R5 and 56 NLS-EGFP-FUS-C; one-way ANOVA). e, Top: representative images from the FRAP experiments of NLS-EGFP-FUS-C. The dotted white square highlights the puncta undergoing targeted bleaching. Scale bar, 5 μm. Bottom: quantification of FRAP data for NLS-EGFP-FUS-C. Bleaching event occurs at t = 0 s. Data are presented as mean ± s.d. n = 3 foci analysed in 3 independent experiments. f, Left: confocal microscopy images of condensate formation in HEK-293T cells transfected with the indicated constructs. Right: line-scan analysis of fluorescence intensity along the indicated lines. Scale bars, 5 μm. Blue indicates DAPI-stained nuclei. g,h, Immunoblot analysis of CtIP levels in ERCC6L2-KO U2OS cells transfected with the indicated doses of NLS-EGFP-R1 (g) or NLS-EGFP-FUS-C (h) plasmids. i, Immunoblot analysis of CtIP protein levels in HEK-293T and U2OS cells upon 1,6-hexanediol (1%) treatment. Quantification of protein levels by densitometry. j,k, Immunoblot analysis of the interaction between ERCC6L2 and CtIP following 1,6-hexanediol (1%) treatment, with immunoprecipitation using anti-Myc (j) or anti-Flag (k). Quantification of protein levels by densitometry. Data are representative of at least three independent experiments (a, b, d and fk). Source data
Fig. 6
Fig. 6. The ERCC6L2–CtIP condensates protect CtIP from RNF138-mediated ubiquitination and subsequent degradation.
a, Left: Ctrl and ERCC6L2-KO U2OS cells were exposed to 50 μg ml−1 CHX for the indicated time. Right: quantification of CtIP protein levels by densitometry. Data are presented as mean ± s.d. n = 3 biological replicates. b, Immunoblot analysis of CtIP levels in Ctrl and ERCC6L2-KO U2OS cells upon treatment with MG132 (10 μM, 6 h). cf, Immunoblot analysis of CtIP ubiquitination in Ctrl and ERCC6L2-KO U2OS cells, with untreated (c) or transfected (d and f) with the indicated plasmids (Flag-ER-C, NLS-EGFP-R1, NLS-EGFP-FUS-C). Cells were pretreated with MG132 (10 μM) for 6 h. Quantification of protein levels by densitometry. g, ERCC6L2-KO U2OS cells were exposed to 50 μg ml−1 CHX for the indicated time (left) following transfection with either siNC or siRNF138. Quantification of CtIP protein levels by densitometry (right). Data are presented as mean ± s.d. n = 3 biological replicates. h, Immunoblot analysis of CtIP ubiquitination levels in ERCC6L2-KO U2OS cells transfected with the indicated plasmids and siRNAs. Cells were pretreated with MG132 (10 μM) for 6 h. Quantification of protein levels by densitometry. i, Immunoblot analysis of CtIP ubiquitination levels in U2OS cells transfected with the indicated plasmids. Cells were pretreated with MG132 (10 μM) for 6 h. Quantification of protein levels by densitometry. j, Immunoblot analysis of the interaction between CtIP and RNF138 in U2OS cells following 1,6-hexanediol (1%) treatment. Quantification of protein levels by densitometry. k, Immunoblot analysis of CtIP ubiquitination levels in U2OS cells following 1,6-hexanediol (1%) treatment. Cells were pretreated with MG132 (10 μM) for 6 h. Quantification of protein levels by densitometry. Data are representative of at least three independent experiments (bf, j and k). Source data
Fig. 7
Fig. 7. The IDR of ERCC6L2 influences the DDR.
a,b, Clonogenic survival assays detecting the impact of different ERCC6L2 truncations in ERCC6L2-KO U2OS cells upon treatment with ATMi (KU-60019). Colony formation was quantified based on the area covered by colonies. Data are presented as mean ± s.d. (n = 3 biological replicates, two-way ANOVA). c, Clonogenic survival assays detecting the impact of CtIP overexpression or RNF138 knockdown in ERCC6L2-KO U2OS cells upon treatment with ATMi (KU-60019). Colony formation was quantified based on the area covered by colonies. Data are presented as mean ± s.d. (n = 3 biological replicates, two-way ANOVA). d,e, IF and quantification analysis of RPA2 foci following 24 h exposure to DMSO or ATMi (KU-60019, 5 μM) in ERCC6L2-KO U2OS cells transfected with ERCC6L2 truncations. Representative images (left) and graphical quantitation of foci (right). Scale bars, 10 μm. Data are presented as mean ± 95% CI (d, n = 100 in each group; e, DMSO, n = 113 KO, 109 KO + NLS-R1, 101 KO + NLS-FUS-C, 110 KO + NLS-R5; ATMi, n = 107 KO, 115 KO + NLS-R1, 112 KO + NLS-FUS-C, 112 KO + NLS-R5; one-way ANOVA). f,g, Neutral comet assays detecting the impact of ERCC6L2 truncations in ERCC6L2-KO U2OS cells upon treatment with DMSO or ATMi (KU-60019, 5 μM) for 24 h. Representative images (left) and quantification of the tail length relative to the nucleus (right). Scale bars, 25 μm. Data are presented as mean ± 95% CI (f, DMSO, n = 101 Ctrl, 100 KO, 102 KO + ERCC6L2, 103 KO + ER-C, 100 KO + ER-N; ATMi, n = 100 Ctrl, 100 KO, 100 KO + ERCC6L2, 100 KO + ER-C, 100 KO + ER-N; g, DMSO, n = 104 KO, 112 KO + NLS-R1, 111 KO + NLS-FUS-C, 108 KO + NLS-R5; ATMi, n = 112 KO, 107 KO + NLS-R1, 106 KO + NLS-FUS-C, 110 KO + NLS-R5; one-way ANOVA). Data are representative of at least three independent experiments (dg). Source data
Fig. 8
Fig. 8. KO of ERCC6L2 reduces DNA damage induced by the ATMi.
a, Representative IHC images of ERCC6L2 and CtIP in fixed tumour tissues from DLD-1 xenograft tumours. Scale bar, 50 μm. b, Representative IHC images of γ-H2AX and cleaved Caspase-3 in fixed tumour tissues from DLD-1 xenograft tumours following treatment with DMSO or ATMi (KU-55933, 10 mg kg−1). Scale bar, 50 μm. c, Graphical quantification of relative γ-H2AX and cleaved Caspase-3 IHC scores. Data are presented as mean ± 95% CI (n = 7 biologically independent mice; two-tailed Student’s t-test). d, Representative IHC images of ERCC6L2 and CtIP in CRC specimens. Scale bars, 50 μm. e, A dot plot showing the correlation between ERCC6L2 and CtIP levels in the CRC cohort (n = 127). The correlation coefficient r and the P value were obtained from linear regression analysis. f, Box-and-whisker plot showing the IHC scores of CtIP staining in tumours with low or high ERCC6L2 expression. The centre lines represent the median, the box edges denote the 25th and 75th percentiles, and the whiskers indicate the minimum and maximum values. n = 62 and 65 CRC samples for the ERCC6L2 low- and high-expression groups, respectively. Statistical analysis was performed using the two-tailed Mann–Whitney test. g, CRC samples were co-stained with anti-ERCC6L2 and anti-CtIP. Blue indicates DAPI-stained nuclei. The red arrow indicates representative cells. Scale bar, 50 μm. Source data
Extended Data Fig. 1
Extended Data Fig. 1. Loss of ERCC6L2 Confers Resistance to ATM Inhibitors in Cancer Cells.
a, b. Volcano plots showing genes targeted by sgRNAs that were differentially enriched in ATMi-treated versus DMSO-treated control cells in CRISPR screens in A549 (a) and NCI-H460 (b) cells. c. Gene-centric visualization of average log2 fold change (LFC) in ATMi-treated versus DMSO-treated cell lines. d. Schematic diagram of ERCC6L2 structure. sgRNA targeting sites are shown as black colored arrows. e, f. Sanger sequencing showed that ERCC6L2 was knocked out in the indicated cells. g. Immunoblot analysis showing the KO efficiency of ERCC6L2 in U2OS, HeLa, DLD-1, and HCT116 cells. h. Immunoblot analysis of ERCC6L2 levels in ERCC6L2-KO U2OS and DLD-1 cells transfected with Flag-ERCC6L2. i, j. Clonogenic survival assays detecting the impact of ERCC6L2 rescue in ERCC6L2-KO U2OS (i) and DLD-1 (j) cells upon treatment with ATMi (KU-55933). Colony formation was quantified based on the area covered by colonies. Data are presented as mean ± SD (n = 3 biological replicates, two-way ANOVA). Data are representative of at least three independent experiments (g, h). Source data
Extended Data Fig. 2
Extended Data Fig. 2. ERCC6L2 Engages in DNA Damage Repair.
a. Time-lapse confocal microscopy images showing EGFP-ERCC6L2 recruitment to microirradiation-induced DNA damage sites. Scale bars: 5 μm. b. Immunoblot analysis demonstrating the knockdown efficiency of BRCA1, 53BP1, and ERCC6L2 (left panel). Quantification of NHEJ and HR efficiency was performed using the EJ5-GFP and DR-GFP reporter assays in U2OS cells (right panel, one-way ANOVA). si53BP1 and siBRCA1 served as positive controls. Data are presented as mean ± SD. n = 3 biological replicates. c. Neutral comet assays were performed using control or ERCC6L2-KO DLD-1 cells treated with DMSO or ATMi (KU-60019, 10 μM) for 24 h. Representative images (top panel) and quantification of the tail length relative to the nucleus (bottom panel). Scale bars: 25 μm. Data are presented as mean ± 95% CI (DMSO, n = 104 Ctrl, 105 KO#1, 101 KO#2; ATMi, n = 102 Ctrl, 108 KO#1, 103 KO#2; one-way ANOVA). d. Immunoblot analysis of the γ-H2AX levels in control and ERCC6L2-KO DLD-1 cells upon ATMi (KU-60019, 10 μM) treatment (0, 6, 12, 24, 48 h). e. IF and quantification analysis of γ-H2AX foci, merged with DAPI-stained nuclei, following exposure to 4 Gy for 0.5 h in control and ERCC6L2-KO U2OS cells. Representative images (left panel) and graphical quantitation of foci (right panel). Scale bars: 10 μm. Data are presented as mean ± 95% CI (0 Gy, n = 109 Ctrl, 103 KO; 4 Gy, n = 103 Ctrl, 104 KO; two-tailed Mann-Whitney test). Data are representative of at least three independent experiments (a, ce). Source data
Extended Data Fig. 3
Extended Data Fig. 3. ERCC6L2 Interacts and Forms Dynamic Condensates with CtIP.
a. Detection of ERCC6L2-binding proteins by silver staining following IP assays using nuclear protein extracts from HEK-293T cells. Coomassie Brilliant Blue (CBB) staining was used to assess the loading control. b. Co-IP assays showed the binding partners of ERCC6L2 in U2OS cells. c, d. Co-IP assays showed the interaction of ERCC6L2 with CtIP in DLD-1(c) and U2OS (d) cells. e, f. The disordered region of ERCC6L2 was analysed using PONDR (e) or IUpred2 (f). Scores above 0.5 indicate disorder. g. HEK-293T cells were transfected with NLS-EGP-ER-N plasmids for 48 h. NLS-EGFP-ER-N was diffusely distributed in the nucleus. Blue indicates DAPI-stained nuclei. Scale bars: 5 μm. h. EGFP-ERCC6L2 was transfected into CtIP knockdown cells (top panel), and mCherry-CtIP was transfected into ERCC6L2-KO U2OS cells (bottom panel). Foci formation was observed in both conditions. Scale bars: 5 μm. i. Representative images from the FRAP experiment of EGFP-ERCC6L2 (left panel), the dotted white square highlights the puncta undergoing targeted bleaching. Quantification of FRAP data for EGFP-ERCC6L2 (right panel). Bleaching event occurs at t = 0 s. Scale bars: 5 μm. Data are presented as mean ± SD. n = 3 foci analysed in 3 independent experiments. j. Fusion of adjacent EGFP-ER-C droplets was observed in cells. An EGFP-ER-C droplet fissured to form two smaller droplets. Scale bars: 1 μm. k. Fusion of adjacent mCherry-CtIP droplets was observed in cells. An mCherry-CtIP droplet fissured to form two smaller droplets. Scale bars: 1 μm. l, m. Confocal microscopy images of EGFP-ER-C and mCherry-CtIP droplets after treatment with 10% 1,6-hexanediol for 1 min (l, top panels) or 0.4 M sorbitol for 30 min (m, top panels) and graphical quantitation of foci (bottom panel). Scale bars: 5 μm. (l, n = 51 EGFP-ER-C, 57 mCherry-CtIP; m, n = 55 EGFP-ER-C, 54 mCherry-CtIP; two-tailed Mann-Whitney test). n. IF and quantification of ERCC6L2 or CtIP foci after treatment with 10% 1,6-hexanediol for 1 min. Representative images (top panels) and graphical quantitation of foci (bottom panel). Scale bars: 5 μm. Data are presented as mean ± 95% CI (ERCC6L2, n = 51 Pre, 58 1,6-Hex; CtIP, n = 55 Pre, 53 1,6-Hex; two-tailed Mann-Whitney test). o. The crystal structure of ERCC6L2 was predicted using AlphaFold, with regions showing pLDDT < 50. p. Schematic diagram of truncated mutants of ERCC6L2. q. Quantitative analysis of NLS-EGFP-tagged constructs in ERCC6L2-KO U2OS cells. Three parameters were evaluated: (i) foci number per cell, (ii) relative fluorescence intensity, and (iii) foci vs intensity per cell. Data are presented as mean ± 95% CI (n = 50 in each group; one-way ANOVA). n.s.: no statistical significance. R1 vs. Vector: P = 0.9599, R1 vs. R2: P = 0.9942, R1 vs. R3: P = 0.8251, R1 vs. R4: P = 0.8562. r. HEK-293T cells were transfected with NLS-EGFP-tagged constructs (Vector, R1, R2, R3, or R4) for 48 h. R1 showed puncta in the nucleus (left panel). Scale bars: 2 μm. Quantitative analysis (right panel) of three parameters: (i) foci number per cell, (ii) relative fluorescence intensity, and (iii) foci vs intensity per cell. Data are presented as mean ± 95% CI (n = 50 in each group; one-way ANOVA). n.s.: no statistical significance. R1 vs. Vector: P = 0.8066, R1 vs. R2: P = 0.9875, R1 vs. R3: P = 0.7869, R1 vs. R4: P = 0.6538. Data are representative of at least three independent experiments (ad, g, h, j, k, n, q, r). Source data
Extended Data Fig. 4
Extended Data Fig. 4. ERCC6L2 Interacts with and Upregulates CtIP.
a. Co-IP assays in DLD-1 cells transfected with the indicated Flag-ERCC6L2 truncations. b. Co-IP assays in U2OS cells transfected with NLS-EGFP-ER-N. c. Co-IP assays in DLD-1 cells transfected with the indicated NLS-EGFP-ERCC6L2 truncations. df. Immunoblot analysis of CtIP levels in ERCC6L2-KO U2OS cells transfected with the indicated doses of Flag-ERCC6L2 (d), Flag-ER-C (e), or Flag-ER-N (f) plasmids. gj. Immunoblot analysis of CtIP levels in ERCC6L2-KO cells transfected with the indicated doses of NLS-EGFP-R2 (g), NLS-EGFP-R3 (h), NLS-EGFP-R4 (i), or NLS-EGFP-R5 (j) plasmids. k. Schematic diagram of truncated mutants of CtIP. l, m. Co-IP assays in U2OS cells transfected with the indicated plasmids. n. Confocal microscopy images of condensate formation in HEK-293T cells transfected with the indicated plasmids (top panel). Line-scan analysis of fluorescence intensity along the indicated lines (bottom panel). Scale bars: 5 μm. Blue indicates DAPI-stained nuclei. Data are representative of at least three independent experiments (aj, ln). Source data
Extended Data Fig. 5
Extended Data Fig. 5. ERCC6L2 Prevents the Ubiquitination and Degradation of CtIP.
a. qPCR analysis showed the relative CtIP mRNA expression in control and ERCC6L2-KO U2OS cells. n = 3 technical replicates. b, c. Control and ERCC6L2-KO U2OS (b) or DLD-1 (c) cells were exposed to 50 μg/mL CHX for the indicated time. Data are presented as mean ± SD. n = 3 biological replicates. Quantification of CtIP protein levels by densitometry. d. Immunoblot analysis of CtIP levels in control and ERCC6L2-KO DLD-1 cells upon treatment with MG132. e, f. Immunoblot analysis of CtIP ubiquitination levels in control and ERCC6L2-KO DLD-1 cells transfected with the indicated plasmids. Cells were pretreated with MG132 (10 μM) for 6 h. Quantification of protein levels by densitometry. g. Immunoblot analysis of CtIP ubiquitin linkage types in control and ERCC6L2-KO U2OS cells transfected with Myc-CtIP and Ub-HA WT or the ubiquitin mutants (K6R, K11R, K29R, K48R, and K63R). Cells were pretreated with MG132 (10 μM) for 6 h. Quantification of protein levels by densitometry. h. Immunoblot analysis of CtIP ubiquitin linkage types in control and ERCC6L2-KO U2OS cells transfected with Myc-CtIP and Ub-HA mutants (K6, K48, K63). Cells were pretreated with MG132 (10 μM) for 6 h. The plasmids are able only to form K6, K48, and K63 ubiquitin linkages, respectively. Quantification of protein levels by densitometry. Data are representative of at least three independent experiments (a, dh). Source data
Extended Data Fig. 6
Extended Data Fig. 6. The ERCC6L2-CtIP condensates protect CtIP from RNF138-mediated ubiquitination and subsequent degradation.
a. Predicted E3 ligases of CtIP by UbiBrowser. The scores were obtained from the UbiBrowser 2.0 website, where the “Confidence Score” quantifies the reliability of predicted E3/DUB-substrate interactions. A higher score indicates a stronger confidence in the predicted interaction, while a lower score suggests reduced reliability. b. ERCC6L2-KO U2OS cells were transfected with siRNAs specific for the potential E3 ligases of CtIP. Quantification of protein levels by densitometry. c. Immunoblot analysis of CtIP ubiquitin linkage types in U2OS cells transfected with Myc-CtIP, His-RNF138, and Ub-HA mutants (K6, K48, and K63). Cells were pretreated with MG132 (10 μM) for 6 h. Quantification of protein levels by densitometry. d, e. Co-IP assays in U2OS (d) or DLD-1 (e) cells transfected with the indicated plasmids or siRNAs. f, g. Immunoblot analysis of the interaction between RNF138 and CtIP in control and ERCC6L2-KO U2OS (f) or DLD-1 (g) cells. h. IF images showing CtIP or RAD51 foci (red channel) and the indicated proteins (green channel), merged with DAPI (blue channel), following treatment with the ATMi (KU-60019, 5 μM) for 24 h. Line scans of the red and green channels are provided. Scale bars: 5 μm. i. The disordered region of RNF138 was analysed using PONDR. Scores above 0.5 indicate disorder. j, k. Immunoblot analysis of CtIP levels in HEK-293T (j) and U2OS cells (k) upon 1,6-hexanediol (1%) or MG132 treatment. Quantification of protein levels by densitometry. Data are representative of at least three independent experiments (bh, j, k). Source data
Extended Data Fig. 7
Extended Data Fig. 7. The IDR of ERCC6L2 Influences the DNA Damage Response.
a. Immunoblot analysis of the Flag-ERCC6L2 truncated mutants in ERCC6L2-KO U2OS or DLD-1 cells. be. Clonogenic survival assays detecting the impact of ERCC6L2 truncation in ERCC6L2-KO DLD-1 (b, d) and U2OS (c, e) cells upon treatment with ATMi (KU-55933 or KU-60019). Colony formation was quantified based on the area covered by colonies. Data are presented as mean ± SD (n = 3 biological replicates, two-way ANOVA). f. Immunoblot analysis of CtIP and RNF138 levels in ERCC6L2-KO U2OS or DLD-1 cells following transfection with Myc-CtIP or siRNF138. gi. Clonogenic survival assays detecting the impact of CtIP overexpression or RNF138 knockdown in ERCC6L2-KO DLD-1 (g, i) and U2OS (h) cells upon treatment with ATMi (KU-55933 or KU-60019). Colony formation was quantified based on the area covered by colonies. Data are presented as mean ± SD (n = 3 biological replicates, two-way ANOVA). j. IF and quantification analysis of RPA2 foci detecting the impact of CtIP overexpression or RNF138 knockdown following 24 h exposure to DMSO or ATMi (KU-60019, 5 μM) in ERCC6L2-KO U2OS cells. Representative images (left panels) and graphical quantitation of foci (right panel). Scale bars: 10 μm. Data are presented as mean ± 95% CI (DMSO, n = 106 Ctrl, 103 KO, 105 KO + CtIP, 106 KO + siRNF138; ATMi, n = 110 Ctrl, 106 KO, 105 KO + CtIP, 101 KO + siRNF138; one-way ANOVA). k. Neutral comet assays detecting the impact of CtIP overexpression or RNF138 knockdown in ERCC6L2-KO U2OS cells upon treatment with DMSO or ATMi (KU-60019, 5 μM) for 24 h. Representative images (left panel) and quantification of the tail length relative to the nucleus (right panel). Scale bars: 25 μm. Data are presented as mean ± 95% CI (DMSO, n = 107 Ctrl, 106 KO, 111 KO + CtIP, 110 KO + siRNF138; ATMi, n = 117 Ctrl, 111 KO, 106 KO + CtIP, 107 KO + siRNF138; one-way ANOVA). Data are representative of at least three independent experiments (a, f, j, k). Source data
Extended Data Fig. 8
Extended Data Fig. 8. ERCC6L2 Is Downregulated in Multiple Cancer Types.
aw. ERCC6L2 mRNA expression in normal tissues and human cancer samples from TCGA database. Data are presented as mean ± SD, statistical analysis was performed using the two-tailed Mann-Whitney test. COAD: Colon Cancer, n = 41 normal, 469 tumour; READ: Rectal Cancer, n = 10 normal, 166 tumour; BLCA: Bladder Cancer, n = 19 normal, 411 tumour; BRCA: Breast Cancer, n = 113 normal, 1097 tumour; GBM: Glioblastoma, n = 5 normal, 155 tumour; KIRC: Kidney Clear Cell Carcinoma, n = 72 normal, 534 tumour; KIRP: Kidney Papillary Cell Carcinoma, n = 32 normal, 288 tumour; LUSC: Lung Squamous Cell Carcinoma, n = 49 normal, 501 tumour; PRAD: Prostate Cancer, n = 52 normal, 498 tumour; THCA: Thyroid Cancer, n = 58 normal, 502 tumour; UCEC: Endometrioid Cancer, n = 35 normal, 547 tumour; CHOL: Bile Duct Cancer, n = 9 normal, 36 tumour; STAD: Stomach Cancer, n = 259 normal, 375 tumour; CESC: Cervical Cancer, n = 3 normal, 304 tumour; KICH: Kidney Chromophobe, n = 24 normal, 65 tumour; ESCA: Esophageal Cancer, n = 12 normal, 161 tumour; HNSC: Head and Neck Cancer, n = 44 normal, 500 tumour; LIHC: Liver Cancer, n = 50 normal, 371 tumour; LUAD: Lung Adenocarcinoma, n = 59 normal, 524 tumour; PAAD: Pancreatic Cancer, n = 4 normal, 177 tumour; PCPG: Pheochromocytoma and Paraganglioma, n = 3 normal, 178 tumour; SARC: Sarcoma, n = 2 normal, 259 tumour; THYM: Thymoma, n = 2 normal, 119 tumour. Source data

References

    1. Broderick, R. et al. EXD2 promotes homologous recombination by facilitating DNA end resection. Nat. Cell Biol.18, 271–280 (2016). - PMC - PubMed
    1. Ciccia, A. & Elledge, S. J. The DNA damage response: making it safe to play with knives. Mol. Cell40, 179–204 (2010). - PMC - PubMed
    1. Pilié, P. G., Tang, C., Mills, G. B. & Yap, T. A. State-of-the-art strategies for targeting the DNA damage response in cancer. Nat. Rev. Clin. Oncol.16, 81–104 (2018). - PMC - PubMed
    1. Scully, R., Panday, A., Elango, R. & Willis, N. A. DNA double-strand break repair-pathway choice in somatic mammalian cells. Nat. Rev. Mol. Cell Biol.20, 698–714 (2019). - PMC - PubMed
    1. Ceccaldi, R., Rondinelli, B. & D’Andrea, A. D. Repair pathway choices and consequences at the double-strand break. Trends Cell Biol.26, 52–64 (2016). - PMC - PubMed

MeSH terms