. 2025 Sep 16;6(9):102289.
doi: 10.1016/j.xcrm.2025.102289. Epub 2025 Sep 5.

Lung virome convergence precedes hospital-acquired pneumonia in intubated critically ill patients

Affiliations

Lung virome convergence precedes hospital-acquired pneumonia in intubated critically ill patients

Hussein Anani et al. Cell Rep Med. .

Abstract

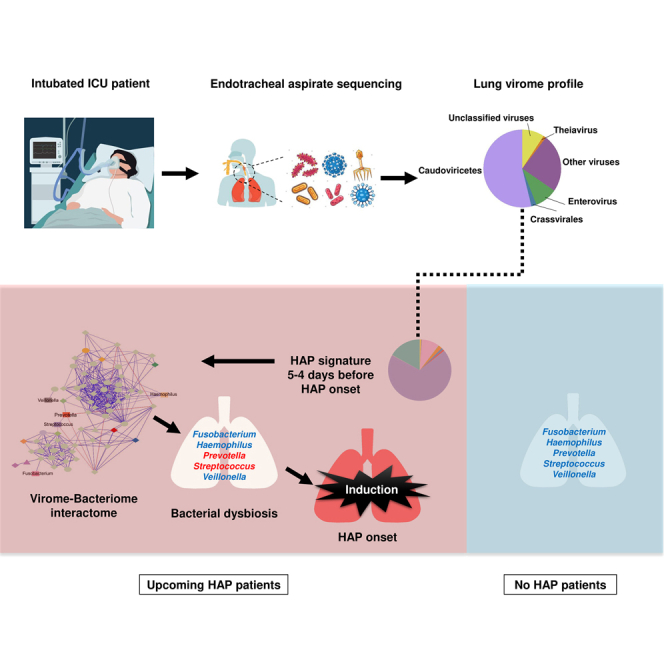
Hospital-acquired pneumonia (HAP) is one of the most common nosocomial infections, leading to significant morbidity and mortality in critically ill patients. HAP is previously associated with dysbiosis of the microbiota. However, the composition of the lung virome and its role in HAP pathogenesis remain unclear. Here, we longitudinally analyze the endotracheal virome in 87 critically ill patients, including 48 with HAP. Within the virome dominated by Caudoviricetes, a decrease in viral beta-diversity toward a bacteriophage-dominated signature and a distinct viral-bacterial interactome is observed 5-4 days before HAP onset. Lung virome composition, viral convergence before HAP onset, and conservation of 18% of the bacteriophage signature are validated in an external cohort of 40 patients. In silico causal inference further identifies bacteriophages associated with Streptococcus and Prevotella as a key regulator of HAP onset. These findings suggest an uncovered pathophysiological mechanism of HAP with virome involvement in lung microbiota dysbiosis. The discovery and validation studies are registered at ClinicalTrials.gov (NCT02003196 and NCT04793568).

Keywords: Caudoviricetes bacteriophages; Respiratory virome; cross-kingdom interactions; hospital-acquired pneumonia (HAP); intubated critically ill patients; microbiome; respiratory interactome; viral metagenomics.


Conflict of interest statement

Declaration of interests The authors declare no competing interests.

Figures

None
Graphical abstract
Figure 1
Figure 1
Respiratory virome in critically ill patients (A and B) Effect size of metadata factors on lung virome variation at ICU admission (A) and during ICU stay (B). Statistical significance assessed using a two-tailed permutation test (∗ and ∗∗ for FDR-adjusted p < 0.05 and p < 0.01, respectively). (C) Heatmap showing the top 30 viral genera, which make up the respiratory virome of all critically ill patients (values expressed in log10RPKM and corresponding to 121 endotracheal samples). NA, not detected (in gray). (D) Prevalence and log10 mean relative abundance (MRA) of the lung virome at the vOTU level (n = 19,015). Each dot represents a single taxon. (E) Predictions of the bacteriophage lifestyle (temperate or virulent) in lung virome (IBIS study) and previously published oral and gut viromes (https://github.com/snayfach/UHGV) using PhaBOX2. (F) Violin plots showing the median weighted Bray-Curtis (p = 1.15e−5), Hellinger (p = 8.9e−4), and Sorensen (p = 0.0011) dissimilarity indices in intra- and inter-patients. Data from 1,532 distance calculations (corresponding to 26 patients with available over time samples included in this analysis) are presented through boxplots, showcasing the 25th to 75th percentiles along with the median, while the whiskers extend to the minimum and maximum observed values. Statistical significance was calculated by the Wilcoxon test. ∗∗, ∗∗∗, and ∗∗∗∗ for p < 0.01, p < 0.001, and p < 0.0001, respectively. Repeated samples from the 87 patients were used in (C). Samples from 26 patients with at least two time points were used in (F) to calculate within-patient diversity and the median of samples per patient for inter-patient diversity.
Figure 2
Figure 2
Diversity profiles of HAP and no HAP viromes (A) Left: Shannon index in all samples in dotplots (Wilcoxon test, p = 0.13). (A) Right: Shannon index in all samples from treated and untreated patients with antibiotics (Wilcoxon test, p = 0.04). ATB, antibiotics. (B) Left: vOTU richness in all samples in dotplots (Wilcoxon test, p = 0.39). (B) Right: vOTU richness in all samples from treated and untreated patients with antibiotics (Wilcoxon test, p = 0.44). (C) Violin plots showing the median weighted Bray-Curtis (upper, p = 2.6e−4), Hellinger (left bottom, p = 7.38e−15), and Sorensen (right bottom, p = 1.79e−12) dissimilarity indices between HAP and no HAP groups. Statistical significance was calculated by the Wilcoxon test. ∗∗∗∗ and ∗∗∗ for p < 0.001 and p < 0.0001, respectively. Data from 109 (68 and 41 samples for HAP and no HAP groups, respectively) endotracheal samples were used in (A)–(C). 3,064 distance calculations were employed in (C) and are presented through boxplots, showcasing the 25th to 75th percentiles along with the median, while the whiskers extend to the minimum and maximum observed values. One sample (median of over time samples) per patient was used for inter-patient diversity in (C). ns for not significant in (A) and (B). Bray, Sorensen, and Hellinger distances were used in (C).
Figure 3
Figure 3
Virome diversity schemes of upcoming HAP and no HAP patients before the beginning of HAP (A) Shannon index in all samples in dotplots (Wilcoxon test, p = 0.2). (B) vOTU richness in all samples in dotplots (Wilcoxon test, p = 0.59) (ns for not significant). (C) PCoA of Bray-Curtis distance characterizing the clustering between samples of upcoming HAP and no HAP patients. The percentage of variability accounted for each PCoA is indicated in the respective axis labels (p = 2.244e−7 with PC1 and p = 0.6425 with PC2) (Adonis test, p = 0.001 and R2 = 0.062). (D) NMDS analysis between samples collected from upcoming HAP and no HAP patients (NMDS stress score = 0.162, permutation test p = 0.0013). (E) Violin plots showing the median weighted Bray-Curtis dissimilarity (upper, p = 0.1), Hellinger (left bottom, p = 1.14e−6), and Sorensen (right bottom, p = 6.22e−8) between upcoming HAP and no HAP groups. Statistical significance was calculated by the Wilcoxon test. ∗∗∗∗ for p < 0.0001; ns, not significant. Data from 49 endotracheal samples prior to HAP (28 and 21 samples for upcoming and no HAP groups, respectively) were used in (A)–(E). 587 distance calculations were presented by boxplots, showcasing the 25th to 75th percentiles along with the median, while the whiskers extend to the minimum and maximum observed values in (E). The Bray distance was used in (C) and (D). Bray, Sorensen, and Hellinger distances were used in (E).
Figure 4
Figure 4
Respiratory virome convergence before HAP onset and its interactions with the healthy respiratory microbiota (A) Median of weighted Bray-Curtis (left), Hellinger (central), and Sorensen (right) dissimilarities between upcoming HAP (pink) and no HAP (blue) in sliding window timing before the HAP onset (window of 2 days with a 1-day step). Medians with 95% confidence intervals are shown. At each window, statistical significance was assessed by a two-sided Mann-Whitney U-test. (B) Heatmaps showing the composition of the viral signature in upcoming and no HAP in the 5–4 day window. RPKM abundance was rescaled by row. (C) Correlation plots between the viral signature vOTUs and the healthy core bacteriome in upcoming and no HAP patients. Spearman correlation tests were performed using the log10 of the relative abundance of vOTUs and the core bacteriome. Data from 46 samples were used in (A)–(C). ns, not significant and ∗, ∗∗∗, and ∗∗∗∗ for p < 0.05, p < 0.001, and p < 0.0001, respectively. Bray-Curtis, Sorensen, and Hellinger distances were used in (A).
Figure 5
Figure 5
Validation of the viral convergence prior to the onset of HAP in an independent cohort (A) Heatmap showing the top 30 viral genera forming the respiratory virome (values expressed in log10RPKM and corresponding to 58 endotracheal samples) of all studied patients. NA, not available (in gray). (B) Median of weighted Bray-Curtis, Hellinger, and Sorensen dissimilarities in upcoming and no HAP patients during the sliding window 5–3 days before HAP onset. The boxplots show the 25th to 75th percentiles along with the median, while the whiskers extend to the minimum and maximum observed values. Statistical significance was assessed by a two-sided Mann-Whitney U-test. Data from 58 to 30 endotracheal samples were used. Bray-Curtis, Sorensen, and Hellinger distances were used in (B).
Figure 6
Figure 6
Validation of the bacteriophage signature (A) BLASTn-based similarity analysis of sequence identity between discovery cohort viral signature and validation cohort virome data. (B) Overview of the conserved viral signature: vOTUs and annotated protein lengths (upper left and middle), lifestyle prediction (bottom left), taxonomic classification (upper right), and viral protein and bacterial host composition (bottom right). (C) PLS-DA representation of upcoming and no HAP patients in the validation cohort using the conserved 66 vcOTUs. (D) Receiver operating characteristic (ROC) curve plot of the HAP predictors applying a 10-fold cross-validation scheme with ten repetitions. AUC, area under the curve; CI, confidence intervals. (E) Transkingdom network showing significant correlations between bacteriophage viral signature and the healthy core lung bacteriome before HAP onset. Edges are colored based on TkNA correlation type: red for negative correlations and blue for positive correlations. The color of the nodes reflects their taxonomic classification. (F) BiBC degree distribution of the top-ranked nodes with the highest node degree from 10,000 randomly generated networks. BiBC, bipartite betweenness centrality.

References

    1. He Q., Wang W., Zhu S., Wang M., Kang Y., Zhang R., Zou K., Zong Z., Sun X. The epidemiology and clinical outcomes of ventilator-associated events among 20,769 mechanically ventilated patients at intensive care units: an observational study. Crit. Care. 2021;25:44. doi: 10.1186/s13054-021-03484-x. - DOI - PMC - PubMed
    1. Schlechte J., Zucoloto A.Z., Yu I.-L., Doig C.J., Dunbar M.J., McCoy K.D., McDonald B. Dysbiosis of a microbiota-immune metasystem in critical illness is associated with nosocomial infections. Nat. Med. 2023;29:1017–1027. doi: 10.1038/s41591-023-02243-5. - DOI - PMC - PubMed
    1. Montassier E., Kitsios G.D., Radder J.E., Le Bastard Q., Kelly B.J., Panzer A., Lynch S.V., Calfee C.S., Dickson R.P., Roquilly A. Robust airway microbiome signatures in acute respiratory failure and hospital-acquired pneumonia. Nat. Med. 2023;29:2793–2804. doi: 10.1038/s41591-023-02617-9. - DOI - PubMed
    1. Li R., Li J., Zhou X. Lung microbiome: new insights into the pathogenesis of respiratory diseases. Signal Transduct. Target. Ther. 2024;9:19. doi: 10.1038/s41392-023-01722-y. - DOI - PMC - PubMed
    1. Bal A., Pichon M., Picard C., Casalegno J.S., Valette M., Schuffenecker I., Billard L., Vallet S., Vilchez G., Cheynet V., et al. Quality control implementation for universal characterization of DNA and RNA viruses in clinical respiratory samples using single metagenomic next-generation sequencing workflow. BMC Infect. Dis. 2018;18:537. doi: 10.1186/s12879-018-3446-5. - DOI - PMC - PubMed

MeSH terms

Associated data

LinkOut - more resources