Observational Study
. 2025 Sep 16;6(9):102334.
doi: 10.1016/j.xcrm.2025.102334. Epub 2025 Sep 5.

ctDNA detects residual disease after neoadjuvant chemoradiotherapy and guides adjuvant therapy in esophageal squamous cell carcinoma

Affiliations
Observational Study

ctDNA detects residual disease after neoadjuvant chemoradiotherapy and guides adjuvant therapy in esophageal squamous cell carcinoma

Zhichao Liu et al. Cell Rep Med. .

Abstract

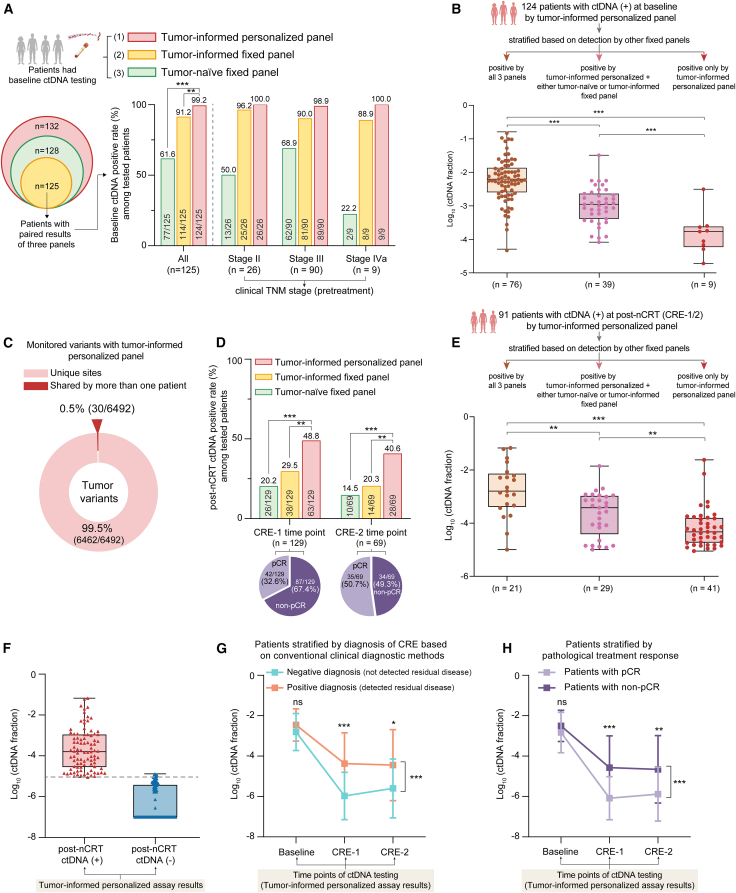
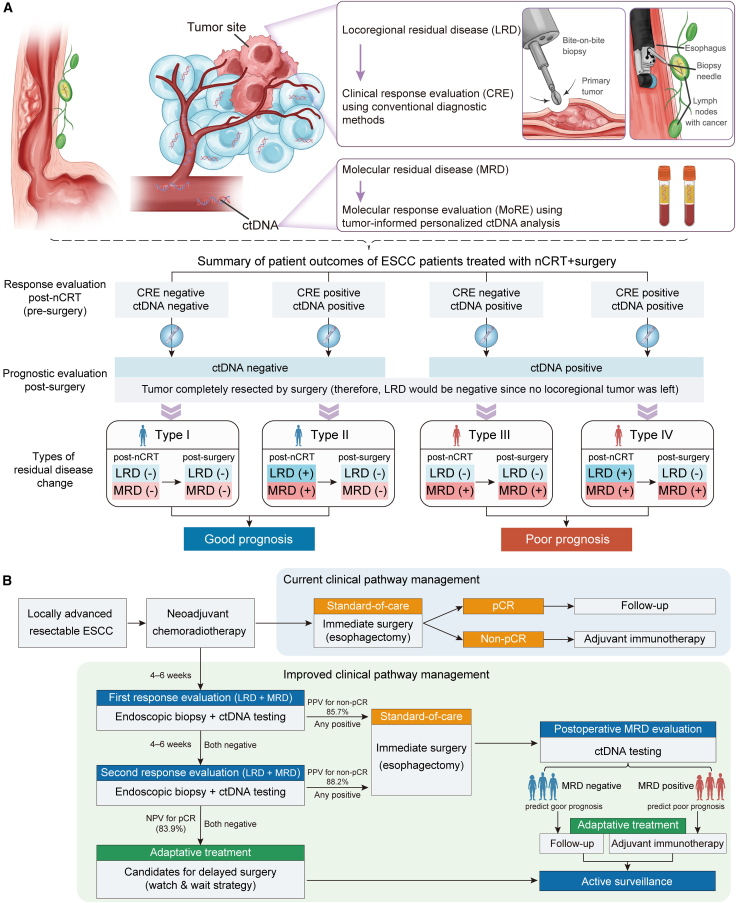
The diagnostic accuracy of circulating tumor DNA (ctDNA) for detecting molecular residual disease (MRD) after multimodal treatment remains unclear. In a prospective cohort of 132 patients with locally advanced esophageal squamous cell carcinoma (ESCC) undergoing neoadjuvant chemoradiotherapy (nCRT) followed by clinical response evaluation and surgery, tumor-informed personalized-panel and fixed-panel ctDNA assays are applied to serial blood samples. Personalized ctDNA assay demonstrates a superior baseline detection rate (99.2%) and outperforms fixed panels in diagnosing post-nCRT residual disease. Integrating personalized ctDNA with conventional clinical diagnostic methods increases sensitivity for predicting non-pathological complete response (non-pCR) from 78.4%-80.7% to 92.0%-93.2%. Patients with detectable MRD post-nCRT and/or post-surgery exhibit worse survival outcomes. In non-pCR patients, adjuvant immunotherapy improves disease-free survival in post-surgery MRD-positive cases, whereas MRD-negative patients derive no benefit. These findings support incorporating ctDNA into response assessment to guide organ-sparing strategies and adjuvant therapy decisions in ESCC. This study is registered at ClinicalTrials.gov (NCT03937362).

Keywords: adjuvant immunotherapy; circulating tumor DNA; esophageal squamous cell carcinoma; molecular residual disease; neoadjuvant chemoradiotherapy; organ preservation.


Conflict of interest statement

Declaration of interests X.G. has received a personal research grant from the Nijbakker-Morra Foundation. G.W., P.C., X.F., J.Y., Z.Z., and S.C. are employees of Burning Rock Biotech.

Figures

None
Graphical abstract
Figure 1
Figure 1
Study schematic (A) Flowchart of the study design. (B) Number of patients with available ctDNA data at each predefined time point. See also Figures S1 and S2 and Table S1.
Figure 2
Figure 2
Comparison of tumor-informed personalized and fixed-panel ctDNA assays for MRD detection before and after nCRT (A) ctDNA-positive detection rates of three assays at baseline, calculated as the proportion of ctDNA-positive patients among all tested individuals. See also Tables S2 and S3. (B) Boxplots comparing ctDNA fractions at baseline among patients with ctDNA detected by the tumor-informed personalized panel, stratified by additional detection by fixed panels: all three assays (brown), personalized plus either fixed panel (pink), or personalized only (red). (C) Pie chart showing the proportion of unique and shared tumor variants tracked by the tumor-informed personalized panel among 132 ESCC patients. Most variants were unique to individual patients, while only a small proportion were shared by more than one patient. See also Table S4. (D) ctDNA-positive detection rates of the three assays at post-nCRT time points (CRE-1/2), calculated as the proportion of ctDNA-positive patients among all tested individuals. Pie charts below show the proportion of patients with pCR and non-pCR among those who underwent ctDNA testing at each time point. (E) Boxplots comparing ctDNA fractions at post-nCRT (CRE-1/2) among patients with ctDNA detected by the tumor-informed personalized panel, stratified by additional detection by fixed panels: all three assays (brown), personalized plus either fixed panel (pink), or personalized only (red). (F) Boxplot comparing ctDNA fraction between ctDNA-positive and ctDNA-negative patients at post-nCRT (CRE-1/2), as determined by the tumor-informed personalized panel. (G) Dynamic changes in ctDNA fraction stratified by clinical evaluation (clinically diagnosed residual disease vs. those without) from baseline to post-nCRT (CRE-1 and CRE-2 time points). (H) Dynamic changes in ctDNA fraction stratified by pathological response (pCR vs. non-pCR) from baseline to post-nCRT (CRE-1 and CRE-2 time points). ns, not significant; ∗p < 0.05, ∗∗p < 0.01, and ∗∗∗p < 0.001, by chi-squared test (A and D) or Mann-Whitney test (B and E) or two-way ANOVA in (G and H). Boxplots in (B), (E), and (F) represent median ± interquartile range, and whiskers indicate full range of values.
Figure 3
Figure 3
Integrated ctDNA and clinical assessment improve prediction of residual disease and complete response after nCRT (A) Schematic of the diagnostic workflow for response evaluation. Diagnostic test performance was summarized using a confusion matrix to calculate sensitivity and false-negative rate. (B) Sensitivity and false-negative rates for detecting any residual disease (non-pCR) using conventional clinical methods, ctDNA-based molecular methods, and their combinations. Absolute numbers used for each calculation are displayed beneath each bar. ∗p < 0.05 of Fisher’s exact test; ns, not significant. See also Table S5 and Figure S3.
Figure 4
Figure 4
Postoperative ctDNA status predicts prognosis after nCRT (A) Sankey plot showing the change in ctDNA-based MRD status from post-nCRT/pre-surgery (CRE-1/2) to post-surgery among patients with matched ctDNA results at all time points. (B and C) Kaplan-Meier curves for (B) disease-free survival (DFS) and (C) overall survival (OS) stratified by ctDNA status changes from post-nCRT to post-surgery (F1): consistent negative, converted negative, converted positive, and consistent positive. (D and E) Kaplan-Meier curves of (D) DFS and (E) OS between patients with positive and negative ctDNA at F1 time point. (F) Forest plot of multivariable Cox regression analysis for DFS, showing adjusted hazard ratios for postoperative MRD status (F1 ctDNA), clinical factors, and adjuvant treatment. Log rank test was used in (B)–(E).
Figure 5
Figure 5
Postoperative ctDNA predicts benefit from adjuvant immunotherapy (A) Kaplan-Meier curves of disease-free survival (DFS) for patients with ctDNA positivity at F1 time point, stratified by three subgroups: pathological complete response (pCR) receiving surveillance only, non-pCR with adjuvant immunotherapy, and non-pCR without adjuvant immunotherapy. See also Figure S5 and Table S6. (B) Kaplan-Meier curves of overall survival (OS) for the same patient groups as in (A). (C and D) Kaplan-Meier curves of (C) DFS and (D) OS for patients with ctDNA negativity at F1 time point, stratified by the same three subgroups as in (A). Log rank test was used in (A)–(D); hazard ratio was calculated using Cox regression.
Figure 6
Figure 6
Proposed strategy for integrating ctDNA testing into post-neoadjuvant management of esophageal cancer (A) Summary of residual disease evaluation and outcome stratification for ESCC patients receiving neoadjuvant therapy and surgery. The diagram illustrates four types of residual disease changes based on locoregional residual disease and molecular residual disease status, with corresponding prognostic implications. (B) Graphical illustration of a proposed improved clinical pathway incorporating ctDNA testing for response evaluation and postoperative risk stratification. The upper panel shows the current standard-of-care pathway, while the lower panel outlines an adaptive management strategy using ctDNA-based molecular response evaluation to guide adaptive treatment decisions.

References

    1. Bray F., Laversanne M., Sung H., Ferlay J., Siegel R.L., Soerjomataram I., Jemal A. Global cancer statistics 2022: GLOBOCAN estimates of incidence and mortality worldwide for 36 cancers in 185 countries. CA Cancer J. Clin. 2024;74:229–263. doi: 10.3322/caac.21834. - DOI - PubMed
    1. Abnet C.C., Arnold M., Wei W.Q. Epidemiology of Esophageal Squamous Cell Carcinoma. Gastroenterology. 2018;154:360–373. doi: 10.1053/j.gastro.2017.08.023. - DOI - PMC - PubMed
    1. van Hagen P., Hulshof M.C.C.M., van Lanschot J.J.B., Steyerberg E.W., van Berge Henegouwen M.I., Wijnhoven B.P.L., Richel D.J., Nieuwenhuijzen G.A.P., Hospers G.A.P., Bonenkamp J.J., et al. Preoperative chemoradiotherapy for esophageal or junctional cancer. N. Engl. J. Med. 2012;366:2074–2084. doi: 10.1056/NEJMoa1112088. - DOI - PubMed
    1. Yang H., Liu H., Chen Y., Zhu C., Fang W., Yu Z., Mao W., Xiang J., Han Y., Chen Z., et al. Neoadjuvant Chemoradiotherapy Followed by Surgery Versus Surgery Alone for Locally Advanced Squamous Cell Carcinoma of the Esophagus (NEOCRTEC5010): A Phase III Multicenter, Randomized, Open-Label Clinical Trial. J. Clin. Oncol. 2018;36:2796–2803. doi: 10.1200/JCO.2018.79.1483. - DOI - PMC - PubMed
    1. Shah M.A., Altorki N., Patel P., Harrison S., Bass A., Abrams J.A. Improving outcomes in patients with oesophageal cancer. Nat. Rev. Clin. Oncol. 2023;20:390–407. doi: 10.1038/s41571-023-00757-y. - DOI - PubMed

Publication types

MeSH terms

Associated data