. 2025 Oct:86:103857.
doi: 10.1016/j.redox.2025.103857. Epub 2025 Sep 3.

GLP-1R activation restores Gas6-driven efferocytosis in senescent foamy macrophages to promote neural repair

Affiliations

GLP-1R activation restores Gas6-driven efferocytosis in senescent foamy macrophages to promote neural repair

Mingjie Xia et al. Redox Biol. 2025 Oct.

Abstract

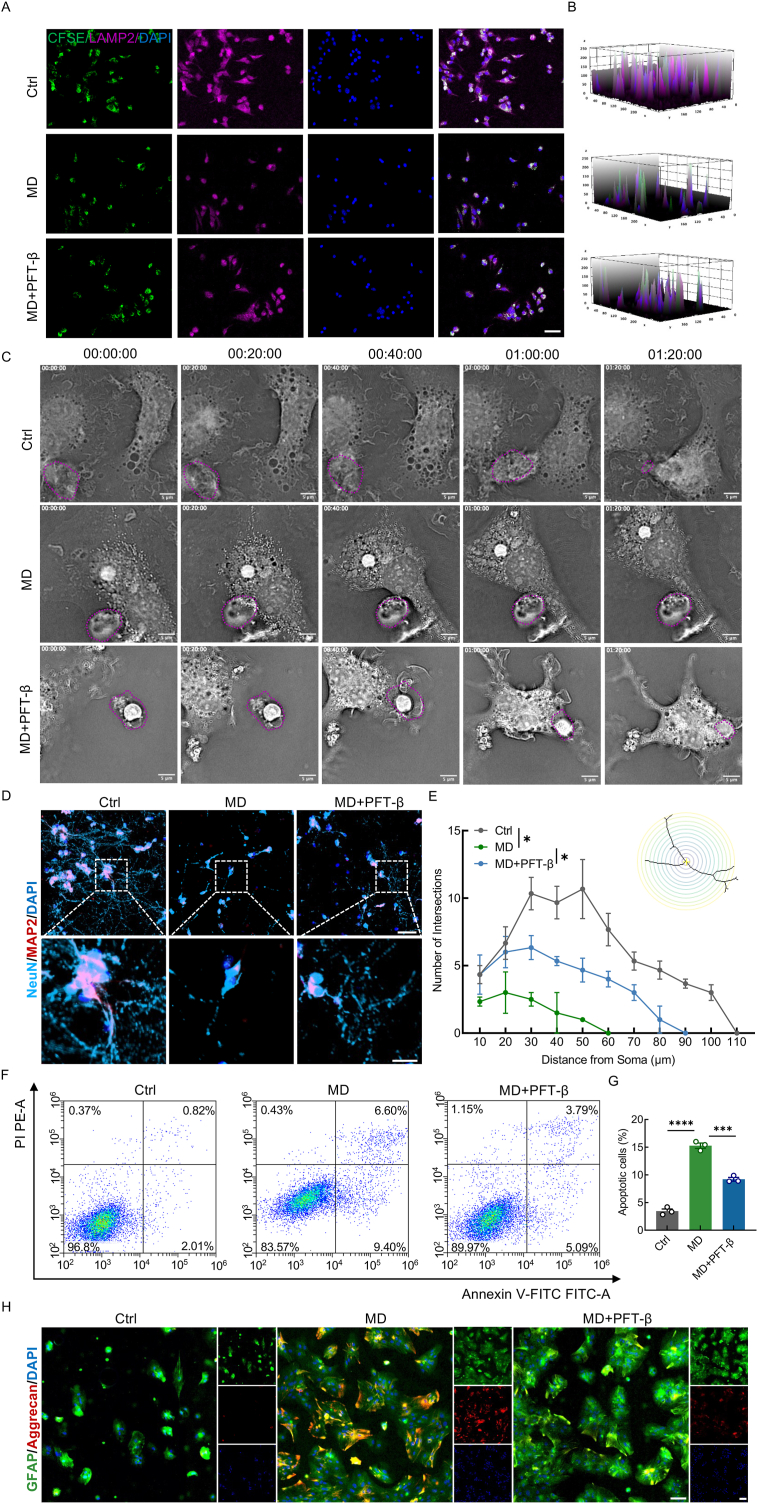
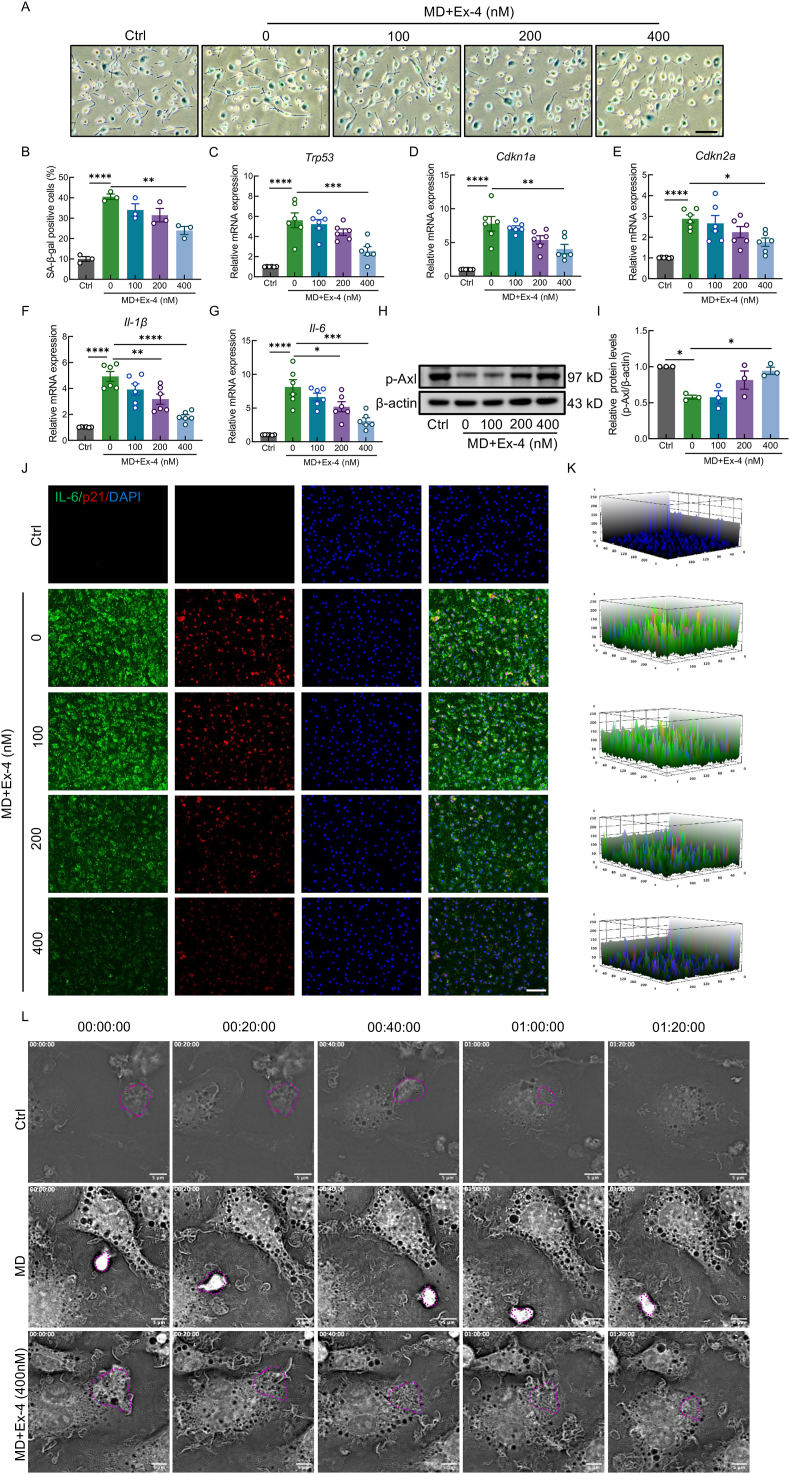
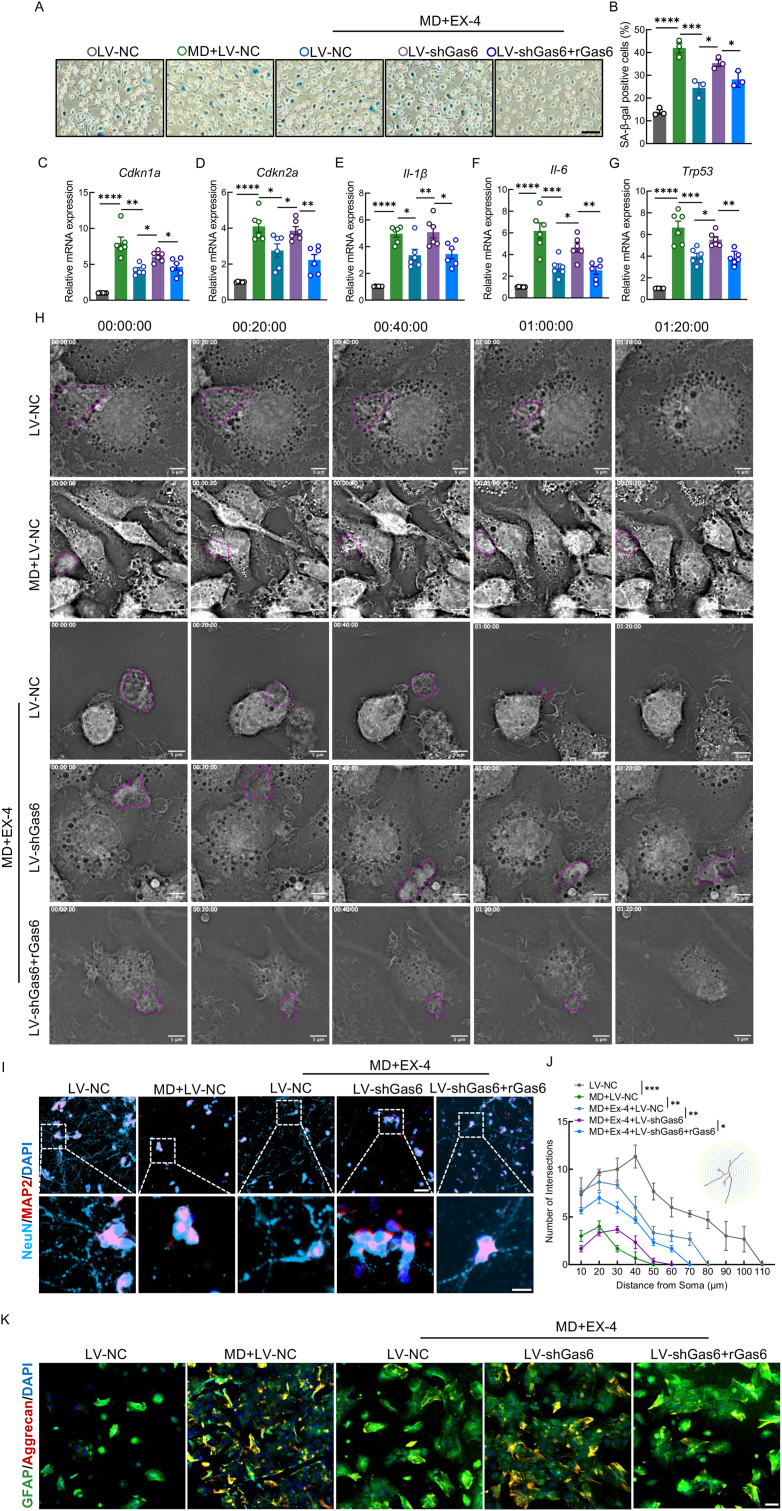
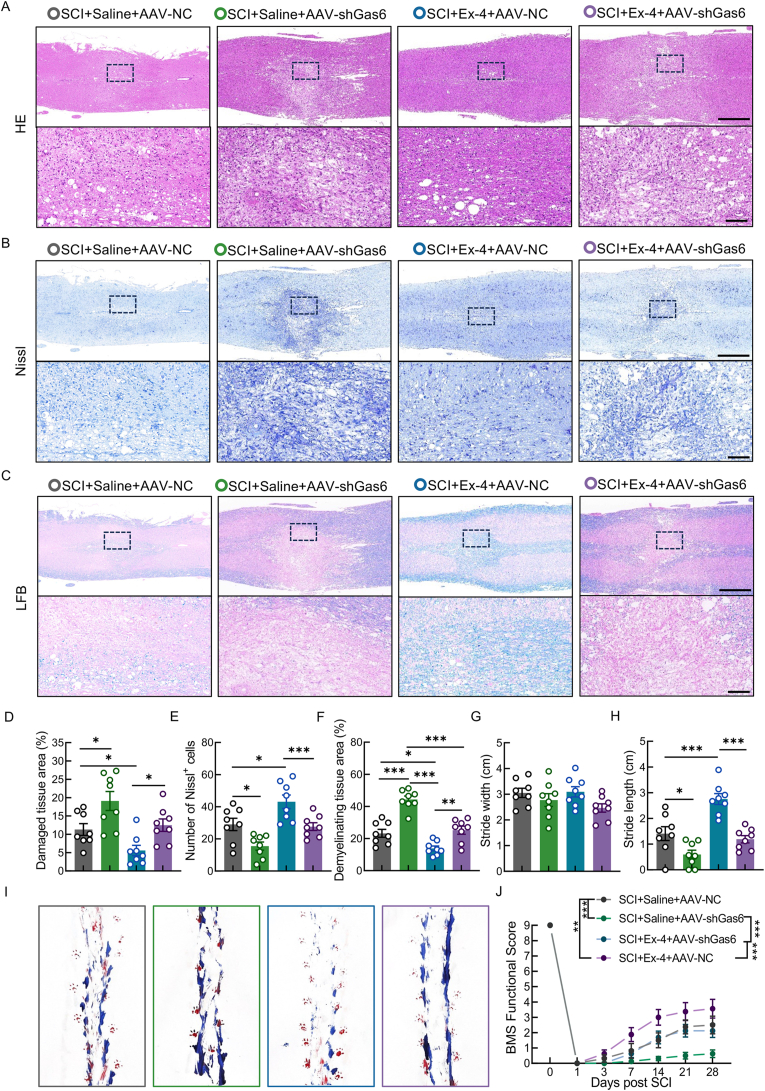
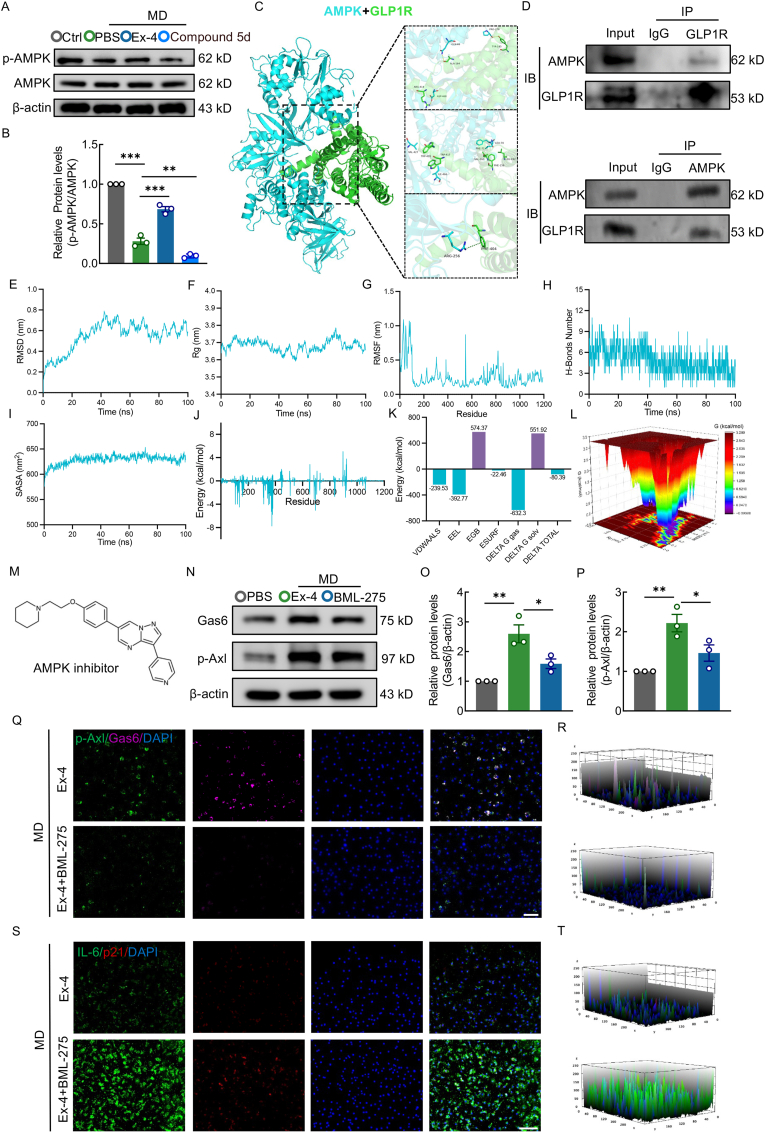
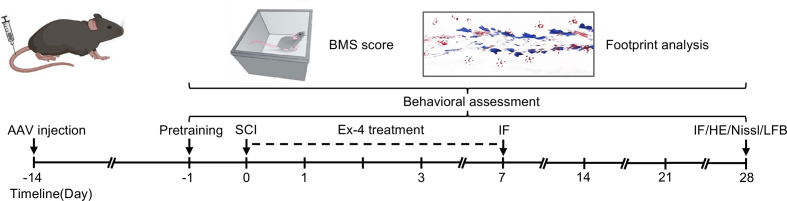
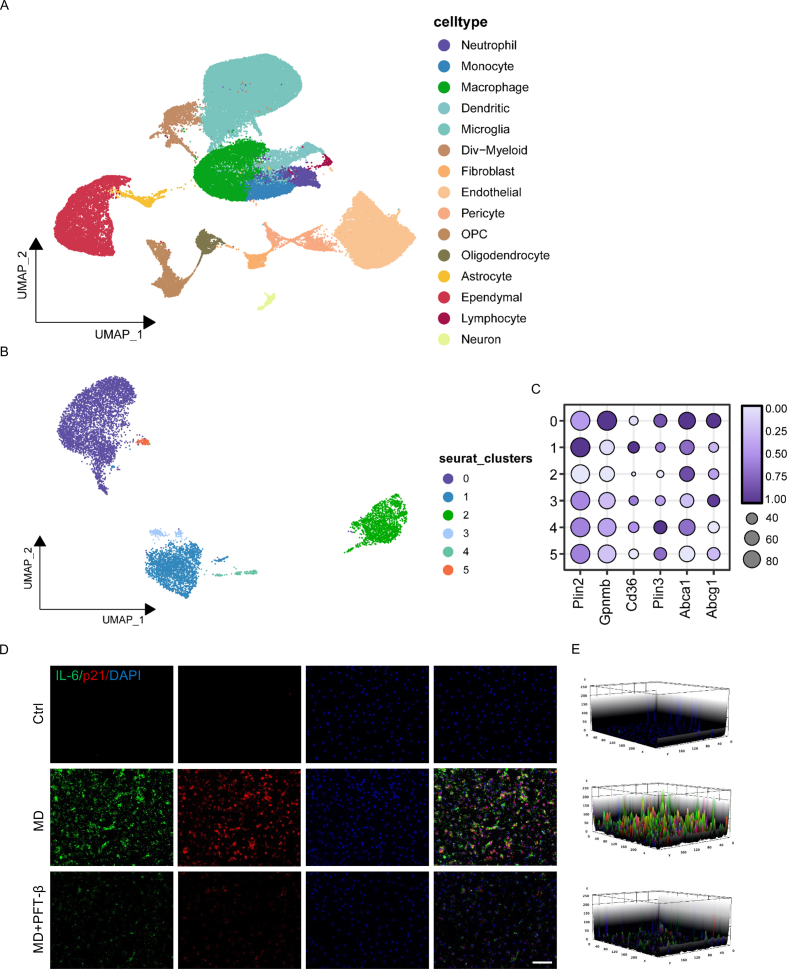
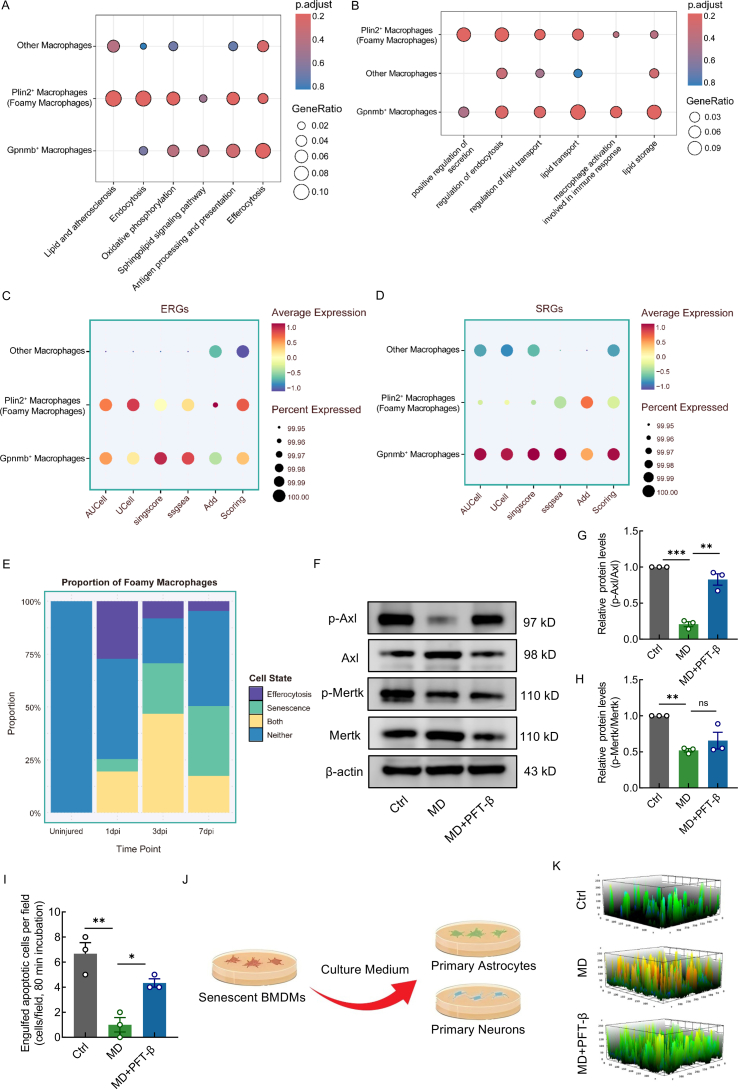
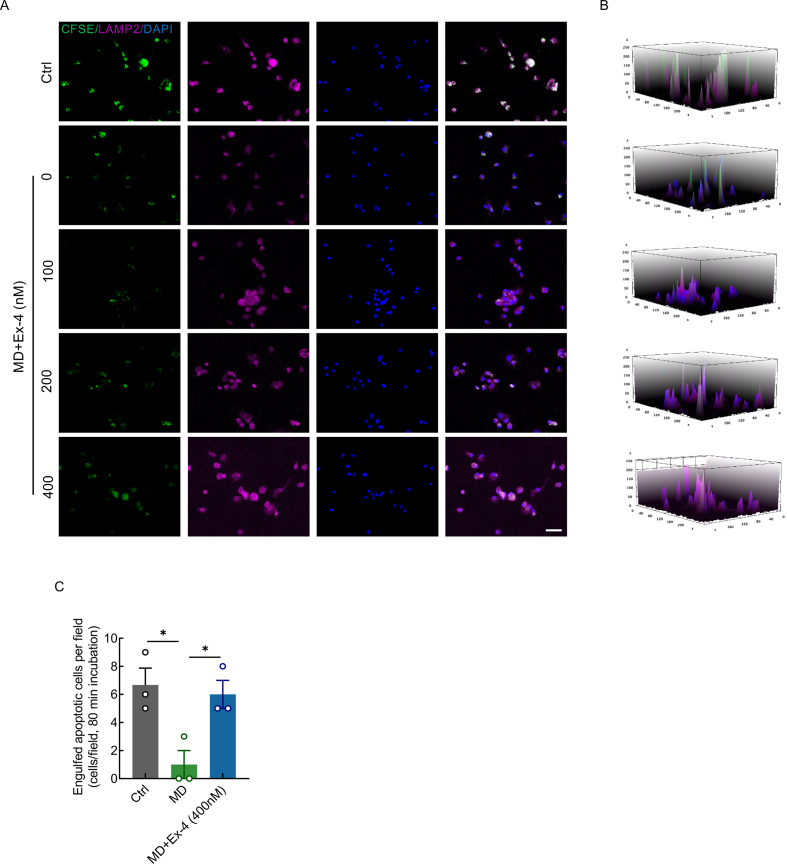
Spinal cord injury (SCI) is a devastating condition characterized by the accumulation of myelin debris (MD), persistent neuroinflammation, and impaired neural regeneration. Although macrophages are pivotal for MD clearance, the impact of excessive MD phagocytosis on macrophage phenotype and function remains poorly understood. Building upon our prior evidence that exendin-4 (Ex-4), a glucagon-like peptide-1 receptor (GLP-1R) agonist, mitigates microglia-driven neuroinflammation post-SCI, this study elucidates the therapeutic efficacy and underlying mechanisms of Ex-4 in alleviating macrophage senescence, restoring efferocytotic capacity, and facilitating neural repair. Employing a T10 contusive SCI model in male C57BL/6 mice, in vivo administration of Ex-4 was combined with macrophage-specific knockdown of growth arrest-specific 6 (Gas6) via AAV-shRNA. Complementary in vitro assays involved bone marrow-derived macrophages (BMDMs) challenged with MD in the presence or absence of Ex-4 or AMP-activated protein kinase (AMPK) inhibition. Cellular senescence and efferocytosis were comprehensively assessed through live-cell imaging, immunofluorescence, senescence-associated β-galactosidase staining, quantitative PCR, and western blotting. Molecular docking and dynamics simulations elucidated GLP-1R-AMPK interactions, corroborated by in vivo validation. Results demonstrate that MD-engulfing macrophages exhibit foam cell-like morphology and upregulated senescence markers, including increased β-galactosidase activity and senescence-associated secretory phenotype, concomitant with diminished efferocytosis via downregulation of the Axl receptor. Senescent macrophages were shown to exacerbate neuronal apoptosis and astrocytic scar formation in co-culture systems. Ex-4 treatment significantly attenuated macrophage senescence, restored efferocytotic function, and reduced neuronal injury and astrocyte activation, effects contingent upon AMPK/Gas6/Axl pathway activation and abrogated by Gas6 knockdown. In vivo, Ex-4 administration enhanced remyelination, axonal regeneration, and functional recovery, while attenuating glial scar formation following SCI. Collectively, these findings identify macrophage senescence induced by excessive MD phagocytosis as a novel pathological contributor to SCI progression and establish Ex-4 as a promising therapeutic agent that restores macrophage homeostasis and promotes neural repair via GLP-1R/AMPK/Gas6/Axl signaling.

Keywords: Efferocytosis; GLP-1R; Gas6; Macrophage senescence; Neuroinflammation; Spinal cord injury.


Conflict of interest statement

Declaration of competing interest The authors declare that they have no known competing financial interests or personal relationships that could have appeared to influence the work reported in this paper.

Figures

Image 1
Graphical abstract
Fig. 1
Fig. 1
Macrophages phagocytosing MD after SCI undergo cellular senescence A, Representative IF labeling images of F4/80 (green) and MBP (pink) obtained from spinal cords in Sham and SCI mice at 7 dpi; scale bar = 50/25 μm. B, UMAP plot of all myeloid cells from uninjured spinal cord and 1, 3, and 7 dpi. Neutrophils, monocytes, macrophages, microglia, div-myeloid, and dendritic cells were extracted, reclustered, and re-embedded in new UMAP coordinates. Cells are colored by myeloid subtype as indicated in legend on right. C, Expression patterns of canonical marker genes, DEGs, and genes associated with disease are shown. Cells are colored based on their expression levels., with values represented as log-transformed normalized expression counts. D, Macrophages were extracted, reclustered, and re-embedded into new UMAP coordinates. Foamy macrophages were identified by Plin2, while Gpnmb+ macrophages were identified by Gpnmb. E, Proportion of each macrophages subtype among all macrophages at each time point. F, ORO staining showing lipid accumulation in spinal cords of Sham and SCI mice at 7 dpi; scale bar = 50 μm. G, Label-free panoramic live-cell imaging of BMDMs treated with MD (1 mg/mL) for 12 h; scale bar = 5 μm. H, GO biological process terms associated with the top DEGs between Control and MD group. GO biological process terms displayed along y axis, and generatio displayed along x axis. I, KEGG enrichment analysis of the DEGs for Control and MD group. Significant enrichment pathways between groups displayed along y axis, and generatio displayed along x axis. J, Representative IF labeling images of F4/80 (blue) and p21 (pink) in spinal cords from Sham and SCI mice at 7 dpi; scale bar = 200/20 μm. K, Co-localization analysis of F4/80 and p21 in macrophages of injured cords. L, SA-β-gal staining in BMDMs treated with MD (1 mg/mL) for 12 h following pre-treatment with PFT-β (10 μM, 24 h); scale bar = 100 μm. M, Quantification of β-gal-positive macrophages. N–R, Relative mRNA levels of SASP factors and senescence markers in BMDMs treated as above. ∗, p < 0.05, ∗∗, p < 0.01, and ∗∗∗, p < 0.001.
Fig. 2
Fig. 2
MD-engulfing macrophages exhibit senescence-mediated efferocytosis dysfunction and aggravate astrocytic scarring and neuronal damage A, Representative IF images of CFSE-labeled apoptotic neurons (green) and LAMP2 (pink) in BMDMs; scale bar = 50 μm. B, Quantification of CFSE and LAMP2 fluorescence intensity. C, Live-cell label-free imaging of BMDMs treated with MD and PFT-β; scale bar = 5 μm. D, IF images showing NeuN (blue) and MAP2 (red) in primary neurons co-cultured with BMDMs; scale bar = 50/25 μm. E, Quantitative Sholl analysis of neurite intersections. F, FCM plots of apoptotic neurons labeled with PI and annexin V-FITC. G, Quantification of apoptotic neuron percentages. H, IF images of GFAP (green) and Aggrecan (red) in primary astrocytes co-cultured with BMDMs.; scale bar = 100 μm ∗, p < 0.05, ∗∗, p < 0.01, and ∗∗∗, p < 0.001.
Fig. 3
Fig. 3
GLP-1R activation can inhibit macrophage senescence and efferocytosis impairment after MD engulfment A, SA-β-gal staining in BMDMs treated with MD and Ex-4; scale bar = 100 μm. B, Quantification of SA-β-gal-positive macrophages. C–G, Relative mRNA expression of SASP factors and senescence markers following Ex-4 treatment; H, WB analysis of p-Axl in BMDMs; I, Densitometric quantification of p-Axl. J, IF images showing IL-6 (green) and p21 (red) in BMDMs; scale bar = 100 μm. K, Quantification of IL-6 and p21 fluorescence. L, Label-free live-cell imaging of BMDMs; scale bar = 5 μm ∗, p < 0.05, ∗∗, p < 0.01, and ∗∗∗, p < 0.001.
Fig. 4
Fig. 4
Gas6 is a critical downstream target of Ex-4 in alleviating macrophage senescence and efferocytosis impairment A, SA-β-gal staining in BMDMs transfected with LV-shGas6; scale bar = 100 μm. B, Quantification of SA-β-gal-positive cells. C–G, Relative mRNA expression of SASP factors and senescence markers in LV-shGas6-transfected BMDMs. H, Live-cell imaging of BMDMs post-LV-shGas6 transfection; scale bar = 5 μm. I, IF images of NeuN (blue) and MAP2 (red) in neurons co-cultured with Gas6-deficient BMDMs; scale bar = 50/25 μm. J, Sholl analysis of neuronal branching. K, IF images of GFAP (green) and Aggrecan (red) in astrocytes co-cultured with Gas6-deficient BMDMs; scale bar = 100 μm ∗, p < 0.05, ∗∗, p < 0.01, and ∗∗∗, p < 0.001.
Fig. 5
Fig. 5
Ex-4 attenuates macrophage senescence and efferocytosis dysfunction through activating Gas6 in SCI mice A, IF images of F4/80 (green), Gas6 (pink), F4/80 (blue), p-Axl (pink) at 7 dpi in spinal cords following AAV-shGas6 and Ex-4 treatment; scale bar = 200/100/50 μm. B, IF images of F4/80 (green), IL-6 (pink), F4/80 (blue), p21 (red); scale bar = 200/100/50 μm. C, IF images of F4/80 (green) and LAMP2 (pink); scale bar = 200/100/50 μm. D–H, Quantification of Gas6-, p-Axl-, IL-6-, p21-, and LAMP2-positive macrophage areas. ∗, p < 0.05, ∗∗, p < 0.01, and ∗∗∗, p < 0.001.
Fig. 6
Fig. 6
Ex-4 suppresses glial scarring and promotes remyelination and axonal regeneration in SCI mice via the Gas6/Axl signaling pathway A, IF images of IBA-1 (pink) and GFAP (blue) at 7 and 28 dpi; scale bar = 100/50 μm. B, IF images of MBP (pink) and NF-200 (green); scale bar = 100/50 μm. C and D, Quantification of glial scar area at 7 dpi. E and F, Glial scar area at 28 dpi. G and H, Quantification of myelinated and axonal area at 7 dpi. I and J, Myelinated and axonal area at 28 dpi. ∗, p < 0.05, ∗∗, p < 0.01, and ∗∗∗, p < 0.001.
Fig. 7
Fig. 7
Ex-4 promotes neuroprotection and functional recovery in SCI mice through the Gas6/Axl axis A, HE staining of spinal cords at 28 dpi; scale bar = 500/100 μm. B, Nissl staining at 28 dpi; scale bar = 500/100 μm. C, LFB staining at 28 dpi; scale bar = 500/100 μm. D-F, Quantification of lesion size, neuronal survival, and demyelination. G and H, Footprint analysis quantification at 28 dpi. I, Representative footprint images at 28 dpi. J, BMS scores across 28 dpi. ∗, p < 0.05, ∗∗, p < 0.01, and ∗∗∗, p < 0.001.
Fig. 8
Fig. 8
AMPK phosphorylation is required for Ex-4-induced activation of the Gas6/Axl pathway A, WB for p-AMPK and AMPK in BMDMs treated with MD, Ex-4 and Compound 5D. B, Densitometry analysis of p-AMPK. C, Molecular docking model of GLP-1R and AMPK. D, Co- IP for GLP-1R and AMPK. E-G, RMSD, Rg, and RMSF analyses of the GLP-1R–AMPK complex. H and I, Hydrogen bond counts and SASA of the complex. J and K, MM/GBSA energy contribution of key residues. L, FEL analysis of the complex. M, Chemical structure of BML-275. N, WB of Gas6 and p-Axl after BML-275 treatment. O and P, Densitometric quantification of Gas6 and p-Axl. Q, IF images of p-Axl (green) and Gas6 (pink) in BMDMs; scale bar = 100 μm. R, Quantification of fluorescence intensity. S, IF of IL-6 (green) and p21 (red) in BMDMs; scale bar = 100 μm. T, Quantification of IL-6 and p21. ∗, p < 0.05, ∗∗, p < 0.01, and ∗∗∗, p < 0.001.
Fig. S1
Fig. S1
Schematic diagram of animal experimental design and implementation Illustration of the overall timeline and procedures used in the in vivo experiments, including SCI induction, pharmacological treatments, and sample collection.
Fig. S2
Fig. S2
Foamy macrophages formed after macrophages engulf MD exhibit a senescent phenotype A, UMAP plot showing all cells from the uninjured spinal cord and injured spinal cord at 1, 3, and 7 dpi. Cells are colored and annotated by cell type based on a combination of DEGs, canonical markers, and previously published spinal cord scRNA-seq datasets. B, UMAP plot of macrophages from uninjured spinal cord and 1, 3, and 7 dpi. Macrophages were extracted, reclustered, and re-embedded in new UMAP coordinates. C, Dot plot displaying the expression pattern of the DEGs that best characterize each cell type. The intensity of dot color reflects the z-score of expression levels, and the size of the dot indicates the percentage of cells in which at least one UMI was detected for each gene. D, IF images showing IL-6 (green) and p21 (red) in BMDMs; scale bar = 100 μm. E, Quantitative of IL-6 and p21 fluorescence intensity.
Fig. S3
Fig. S3
Macrophage senescence impairs efferocytosis and worsens glial and neuronal pathology A-B, KEGG and GO enrichment analysis of DEGs for each macrophage subtype. KEGG and GO biological process terms displayed along x axis, and the macrophage subtypes displayed along y axis. C-D, Bubble plots depict the activity score of ERGs and SRGs across macrophages subtypes, as determined by AUCell, UCell, singscore, ssGSEA, AddModulescore, and Scoring (the sum of scores from other algorithms). Color of dots represents z-scored expression level, and size of dots represents percentage of cells with at least one UMI detected per gene. E, The bar plot depicts the proportional composition of foamy macrophages in the efferocytosis, senescence or neither groups at each time point. The y-axis represents the proportion of each cell type, ranging from 0 to 1, while the x-axis distinguishes between the different time points. F, WB results for p-Axl and p-Mertk expression in BMDMs treated with MD (1 mg/mL) for 12 h after pre-treatment with PFT-β (10 μM) for 24 h; G and H, Densitometry analysis of p-Axl and p-Mertk expression. I, Quantitative analysis of the number of apoptotic neurons engulfed by BMDMs within 80 min in different groups. J, Schematic representation of the co-culture model involving BMDMs, primary neurons, and astrocytes. K, Quantitative analysis of fluorescence signal distribution for GFAP and Aggrecan in the co-culture system. ∗, p < 0.05, ∗∗, p < 0.01, and ∗∗∗, p < 0.001.
Fig. S4
Fig. S4
Ex-4 enhances efferocytosis in macrophages A, Representative IF images of CFSE-labeled apoptotic neurons (green) and LAMP2 (pink) in BMDMs after Ex-4 treatment; scale bar = 50 μm. B, Quantitative analysis of CFSE and LAMP2 fluorescence intensity. C, Quantification of apoptotic neurons engulfed by BMDMs within 80 min under different treatment conditions. ∗, p < 0.05, ∗∗, p < 0.01, and ∗∗∗, p < 0.001.
Fig. S5
Fig. S5
Ex-4 significantly activates Gas6 signaling in macrophages A, Relative mRNA expression of Gas6 in BMDMs after Ex-4 treatment. B, WB results for Gas6 expression in BMDMs after Ex-4 treatment. C, Densitometry analysis of Gas6 expression. D, Representative IF labeling images of p-Axl (green) and Gas6 (pink) in BMDMs after Ex-4 treatment; scale bar = 50 μm. E, Quantitative fluorescence intensity analysis of p-Axl and Gas6. F, WB results for p-Axl expression in BMDMs after transfection with LV-shGas6. G, Densitometric analysis of p-Axl protein levels. ∗, p < 0.05, ∗∗, p < 0.01, and ∗∗∗, p < 0.001.
Fig. S6
Fig. S6
Gas6 knockdown impairs EX-4's effects on macrophage senescence and efferocytosis dysfunction A, Representative IF images of IL-6 (green) and p21 (red) in BMDMs after transfection with LV-shGas6; scale bar = 100 μm. B, Quantitative analysis of IL-6 and p21 fluorescence intensity. C, Representative IF labeling images of CFSE-labeled apoptotic neurons (green) and LAMP2 (pink) in BMDMs after transfection with LV-shGas6; scale bar = 50 μm. D, Quantitative fluorescence intensity of CFSE and LAMP2. E, Quantification of apoptotic neuron engulfment by BMDMs within 80 min under different conditions. F, FCM plots of neuronal apoptosis. G, Quantification of apoptotic neurons. H, Quantitative analysis of GFAP and Aggrecan fluorescence in the co-culture system. ∗, p < 0.05, ∗∗, p < 0.01, and ∗∗∗, p < 0.001.

References

    1. Ahuja C.S., et al. Traumatic spinal cord injury. Nat. Rev. Dis. Primers. 2017;3 - PubMed
    1. Hu X., et al. Spinal cord injury: molecular mechanisms and therapeutic interventions. Signal Transduct. Targeted Ther. 2023;8:245. - PMC - PubMed
    1. G.B.D.S.C.I. Collaborators Global, regional, and national burden of spinal cord injury, 1990-2019: a systematic analysis for the Global Burden of Disease Study 2019. Lancet Neurol. 2023;22:1026–1047. - PMC - PubMed
    1. Lorach H., et al. Walking naturally after spinal cord injury using a brain-spine interface. Nature. 2023;618:126–133. - PMC - PubMed
    1. Tian T., Zhang S., Yang M. Recent progress and challenges in the treatment of spinal cord injury. Protein Cell. 2023;14:635–652. - PMC - PubMed

MeSH terms

Substances