

Functional Connectivity of Hippocampal Circuits and Visual Memory Function in Children and Adolescents With Perinatal Stroke
- PMID: 40916901
- PMCID: PMC12415527
- DOI: 10.1002/hbm.70342
Functional Connectivity of Hippocampal Circuits and Visual Memory Function in Children and Adolescents With Perinatal Stroke
Abstract
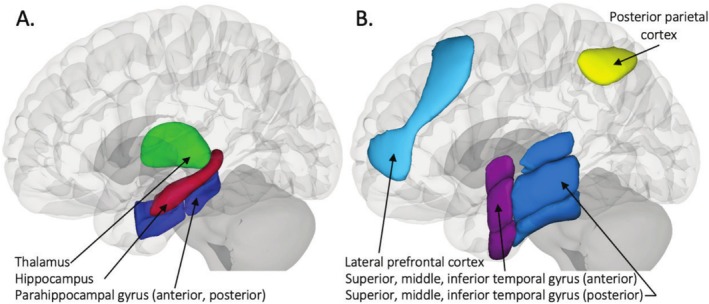
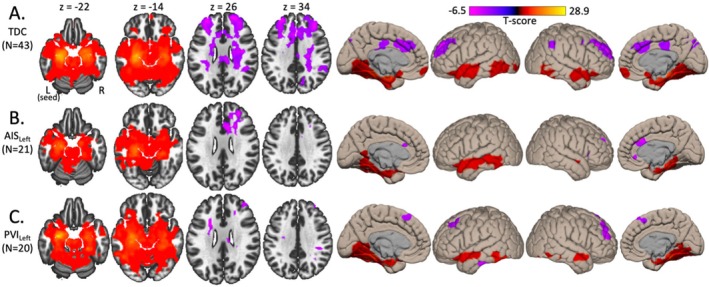
Perinatal stroke is a vascular injury occurring early in life, often resulting in motor deficits (hemiplegic cerebral palsy/HCP). Comorbidities may also include poor neuropsychological outcomes, such as deficits in memory. Previous studies have used resting state functional MRI (fMRI) to demonstrate that functional connectivity (FC) within hippocampal circuits is associated with memory function in typically developing controls (TDC) and in adults after stroke, but this is unexplored in perinatal stroke. Investigating links with visual memory function has the potential to inform prognosis and personalized cognitive rehabilitation strategies. This study aimed to quantify FC within hippocampal circuits of children and adolescents with perinatal stroke and associations with visual memory. We hypothesized that FC would differ between participant groups (AIS, PVI, TDC) and hemispheres (left vs. right stroke), and would correlate with visual memory function. Participants aged 6-19 years with HCP and MRI-confirmed unilateral perinatal stroke (n = 30) arterial ischemic stroke (AIS), n = 38 periventricular venous infarction (PVI) were recruited through the Alberta Perinatal Stroke Project and compared to n = 43 TDC. Resting fMRI volumes (150 volumes, TR/TE = 2000/30 ms, voxels 3.6 mm isotropic, 36 axial slices) were processed to compute FC values between memory-related seeds (including bilateral hippocampi) using a standard pipeline in the CONN toolbox. Seed-to-voxel and seed-to-seed analyses computed FC with each hippocampus. Hemispheric and group differences in FC were examined. A subset of stroke participants (n = 46) completed visual memory testing via CNS Vital Signs (CNSVS), a computerized neurocognitive test battery. Partial correlations assessed associations between FC and visual memory function, factoring out age. We found hemispheric differences in FC within each group. Participants with left perinatal stroke showed greater FC between the hippocampus and lateral prefrontal cortex in the lesioned compared to non-lesioned hemisphere. TDCs had higher hippocampal FC when compared to the lesioned hemisphere of stroke groups. For participants with right hemisphere stroke, associations were observed between hippocampal FC and visual memory function. We describe differences in bilateral hippocampal functional connectivity in children and adolescents with perinatal stroke that are associated with visual memory function. Our findings suggest that developmental plasticity may occur in the non-lesioned hippocampus after perinatal stroke. These findings may inform our understanding of how visual memory function is affected after early unilateral brain injury and facilitate the development of novel therapies for individuals affected by perinatal stroke.
Keywords: functional connectivity; hippocampus; perinatal stroke; visual memory.
© 2025 The Author(s). Human Brain Mapping published by Wiley Periodicals LLC.
Conflict of interest statement
The authors declare no conflicts of interest.
Figures


Similar articles
-
Short-Term Memory Impairment.2024 Jun 8. In: StatPearls [Internet]. Treasure Island (FL): StatPearls Publishing; 2025 Jan–. 2024 Jun 8. In: StatPearls [Internet]. Treasure Island (FL): StatPearls Publishing; 2025 Jan–. PMID: 31424720 Free Books & Documents.
-
Prescription of Controlled Substances: Benefits and Risks.2025 Jul 6. In: StatPearls [Internet]. Treasure Island (FL): StatPearls Publishing; 2025 Jan–. 2025 Jul 6. In: StatPearls [Internet]. Treasure Island (FL): StatPearls Publishing; 2025 Jan–. PMID: 30726003 Free Books & Documents.
-
Aberrant prefrontal-hippocampal connectivity of cross-modal associative memory impairment in schizophrenia.Schizophr Res. 2025 Aug;282:64-73. doi: 10.1016/j.schres.2025.06.002. Epub 2025 Jun 12. Schizophr Res. 2025. PMID: 40505281
-
Technological aids for the rehabilitation of memory and executive functioning in children and adolescents with acquired brain injury.Cochrane Database Syst Rev. 2016 Jul 1;7(7):CD011020. doi: 10.1002/14651858.CD011020.pub2. Cochrane Database Syst Rev. 2016. PMID: 27364851 Free PMC article.
-
Falls prevention interventions for community-dwelling older adults: systematic review and meta-analysis of benefits, harms, and patient values and preferences.Syst Rev. 2024 Nov 26;13(1):289. doi: 10.1186/s13643-024-02681-3. Syst Rev. 2024. PMID: 39593159 Free PMC article.
References
-
- Arner, M. , Beckung E., Eliasson A., Krumlinde‐sundholm L., Rosenbaum P., and Rosblad B.. 2005. “Manual Ability Classification System for Children With Cerebral Palsy.” http://www.macs.nu/. - PubMed
-
- Benjamini, Y. , and Hochberg Y.. 1995. “Controlling the False Discovery Rate: A Practical and Powerful Approach to Multiple Testing.” Journal of the Royal Statistical Society. Series B, Statistical Methodology 57: 289–300.
MeSH terms
Grants and funding
LinkOut - more resources
Full Text Sources
Medical
Miscellaneous
