. 2025 Jul;12(3):035010.
doi: 10.1117/1.NPh.12.3.035010. Epub 2025 Sep 2.

High-density multidistance fNIRS enhances detection of brain activity during a word-color Stroop task

Affiliations

High-density multidistance fNIRS enhances detection of brain activity during a word-color Stroop task

Jessica E Anderson et al. Neurophotonics. 2025 Jul.

Abstract

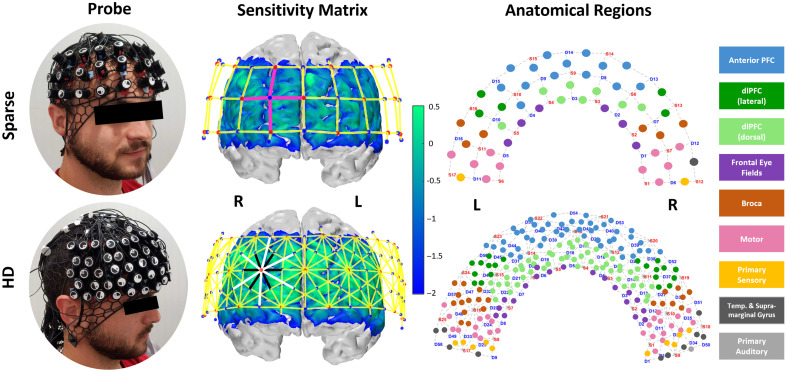
Significance: Functional near-infrared spectroscopy (fNIRS) enables neuroimaging in scenarios where other modalities are less suitable, such as during motion tasks or in low-resource environments. Sparse fNIRS arrays with 30 mm channel spacing are widely used but have limited spatial resolution. High-density (HD) arrays with overlapping, multidistance channels improve sensitivity and localization but increase costs and setup times. A statistical comparison of HD and sparse arrays is needed for evaluating the benefits and trade-offs of HD arrays.

Aim: This study provides a statistical comparison of HD and sparse fNIRS performance to inform array selection in future research.

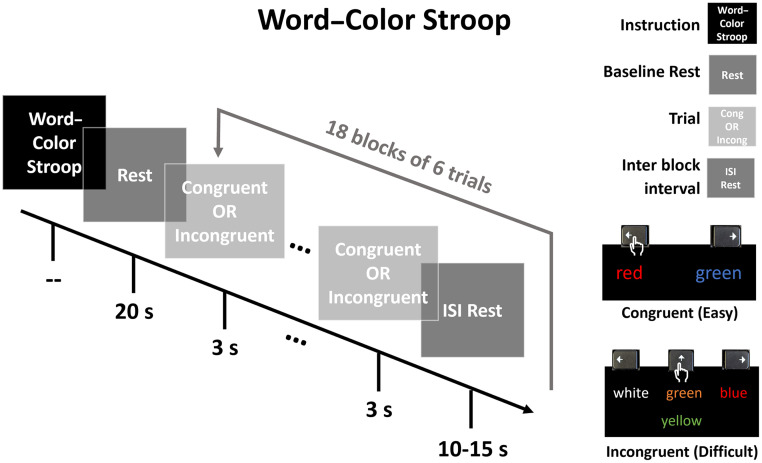
Approach: We measured prefrontal cortex (PFC) activation during congruent and incongruent word-color Stroop (WCS) tasks using both sparse and HD arrays for 17 healthy adult participants, comparing dorsolateral PFC channel and image results at the group level.

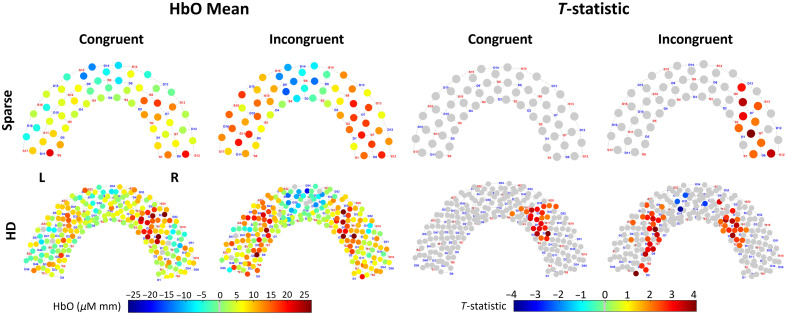
Results: Although both arrays detected activation in channel space during incongruent WCS, channel and image space results demonstrated superior localization and sensitivity with the HD array for all WCS.

Conclusion: Sparse channel data may suitably detect activation from cognitively demanding tasks, such as incongruent WCS. However, the HD array outperformed sparse in detecting and localizing brain activity in image space, particularly during lower cognitive load tasks, making it more suitable for neuroimaging applications.

Keywords: diffuse optical tomography; functional near-infrared spectroscopy; high-density functional near-infrared spectroscopy; pre-frontal cortex; word–color Stroop.


Figures

Fig. 1
Fig. 1
For each of the sparse and high-density (HD) probe designs, columns display physical appearance, sensitivity matrices via Monte-Carlo photon path modeling with probe overlay (red dots: sources, blue dots: detectors, pink lines: emphasize “grid” layout of sparse array’s 30 mm channels, black/white lines: emphasize “hexagonal” layout of HD array’s 19  mm/33  mm channels), and Brodmann areas underlying each channel. Sensitivity profile is on a log 10 scale; vertices with values >0.01 are not masked and not considered part of the relevant sensitivity profile.
Fig. 2
Fig. 2
Word–color Stroop paradigm adapted from Jahani et al. After instruction and initial rest, 18 blocks of 6×3  s trials each were presented with a jittered inter-block interval (10 to 15 s). A given block consisted of either all congruent (easy) trials or all incongruent (difficult) trials. The lower-right legend demonstrates accurate user keyboard press for each condition. The order of blocks is randomized for a total of 9 blocks of each condition. The total run time is 11  min.
Fig. 3
Fig. 3
Channels and vertices selected in the region of interest for the sparse and HD array. On the left panel, black dots mark the center of each channel included in the ROIs. On the right panel, black lines indicate the channels included in the ROIs and the white (unshaded) region of the brain indicates the vertices included. Vertices for both arrays are chosen based on those sensitive to the HD ROI channels.
Fig. 4
Fig. 4
Channel signal quality metrics are provided in terms of mean and standard deviation across subjects. * for p0.05, ** for p0.01, *** for p0.001 by two-tailed paired t-test.
Fig. 5
Fig. 5
Channel space brain response recorded by sparse and HD arrays during WCS, from Superior view. “HbO Mean”: Group-average hemodynamic response (HbO) for each channel, averaged across 7 to 18 s of the blocks for each condition. “T-statistic”: t-statistic of each channel across subjects is plotted. Gray channels have a p-value greater than critical p-value calculated from a cluster permutation, varies per plot.
Fig. 6
Fig. 6
Brain and scalp image space brain response recorded by sparse and HD arrays during WCS, from Anterior view. “HbO Mean”: Group-average hemodynamic response (HbO) for each condition. “T-statistic”: t-statistic of each vertex across subjects is plotted. Color-scale is gray for absolute values less than t-critical = 2.12 as calculated for 17 subjects.
Fig. 7
Fig. 7
From within the ROIs, group-averaged HbO from channels or vertex clusters with maximum t-statistics are presented in both channel and brain and scalp image space for each array and WCS conditions. Asterisks indicate * for p0.05, *** for p0.001 for two-tailed paired Student’s t-test between arrays (black) and conditions (blue). The subjects’ selected channel or averaged 25 vertices’ concentration time courses are averaged for the timeseries plots. Numerical average, standard error, and two-tailed paired Student’s t-test values are available in Table S1 in the Supplementary Material.

Update of

References

    1. von Lühmann A., et al. , “Toward neuroscience of the everyday world (NEW) using functional near-infrared spectroscopy,” Curr. Opin. Biomed. Eng. 18, 100272 (2021). 10.1016/j.cobme.2021.100272 - DOI - PMC - PubMed
    1. Ferrari M., Quaresima V., “A brief review on the history of human functional near-infrared spectroscopy (fNIRS) development and fields of application,” Neuroimage 63(2), 921–935 (2012). 10.1016/j.neuroimage.2012.03.049 - DOI - PubMed
    1. Li R., et al. , “Current opinions on the present and future use of functional near-infrared spectroscopy in psychiatry,” Neurophotonics 10(1), 013505 (2023). 10.1117/1.NPh.10.1.013505 - DOI - PMC - PubMed
    1. Ehlis A. C., et al. , “Application of functional near-infrared spectroscopy in psychiatry,” Neuroimage 85, 478–488 (2014). 10.1016/j.neuroimage.2013.03.067 - DOI - PubMed
    1. Chang F., et al. , “Research progress of functional near-infrared spectroscopy in patients with psychiatric disorders,” Forensic Sci. Res. 6(2), 141–147 (2020). 10.1080/20961790.2020.1720901 - DOI - PMC - PubMed