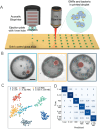
Frontier Technologies in Single-Cell Analysis: Synergistic Fusion of Droplet Printing and High-Performance Detection System
- PMID: 40917101
- PMCID: PMC12413900
- DOI: 10.1002/ansa.70041
Frontier Technologies in Single-Cell Analysis: Synergistic Fusion of Droplet Printing and High-Performance Detection System
Abstract
Single-cell analysis provides critical insights into cellular heterogeneity, dynamic behaviours and microenvironmental interactions, driving advancements in precision medicine and disease mechanism research. However, traditional technologies face limitations due to low throughput, insufficient sensitivity and bottlenecks in multi-omics integration. Microdroplet printing technology, with its advantages in high-throughput single-cell encapsulation, picolitre-level reaction precision and oil-free phase contamination avoidance, has propelled single-cell analysis into a new era of high-throughput and high-dimensional resolution through deep integration with multimodal detection platforms. This review systematically elaborates on the theoretical framework, diverse technical systems and multi-dimensional application scenarios of microdroplet printing technology. It further dissects the deep coupling mechanisms between this technology and multimodal detection platforms such as including mass spectrometry, Raman spectroscopy, fluorescence and ultraviolet detectors, as well as its unique advantages in single-cell analysis. Such cross-technology integration has significantly accelerated innovation in fields such as single-cell drug screening and multi-omics analysis, marking a significant leap in the evolution of single-cell analytical methodologies.
Keywords: droplet; high‐performance detection; printing; single cell.
© 2025 The Author(s). Analytical Science Advances published by Wiley‐VCH GmbH.
Conflict of interest statement
The authors declare no conflicts of interest.
Figures


References
-
- Wang H.‐Y., Ruan Y.‐F., Zhu L.‐B., et al., “An Integrated Electrochemical Nanodevice for Intracellular RNA Collection and Detection in Single Living Cell,” Angewandte Chemie 133, no. 24 (2021): 13352–13358. - PubMed
-
- Zhang Q., Zhou C., Yu W., Sun Y., Guo G., and Wang X., “Isotropic Imaging‐Based Contactless Manipulation for Single‐Cell Spatial Heterogeneity Analysis,” TrAC Trends in Analytical Chemistry 157 (2022): 116789.
-
- Shao Y., Zhou Y., Wu Y., et al., “Controllable Fabrication of Pico/Femtoliter Pipette Sampling Probes and Visual Sample Volume Determination,” Talanta 218 (2020): 121096. - PubMed
-
- Labib M. and Kelley S. O., “Single‐Cell Analysis Targeting the Proteome,” Nature Reviews Chemistry 4, no. 3 (2020): 143–158. - PubMed
Publication types
LinkOut - more resources
Full Text Sources
