. 2025 Sep 4;18(9):e70154.
doi: 10.1111/eva.70154. eCollection 2025 Sep.

Population Genomics Reveals Panmixia in Pacific Sardine (Sardinops sagax) of the North Pacific

Affiliations

Population Genomics Reveals Panmixia in Pacific Sardine (Sardinops sagax) of the North Pacific

Gary C Longo et al. Evol Appl. .

Abstract

The spatial structure and dynamics of populations are important considerations when defining management units in organisms that are harvested as natural resources. In the Eastern Pacific, Pacific Sardine range from Chile to Alaska, the northernmost state of the United States (U.S.), and once supported an expansive and productive fishery. Along its North American range, it is hypothesized to comprise three subpopulations: a northern and southern subpopulation, which primarily occur off the coast of the U.S. and Baja California, Mexico (M.X.), respectively, and a third in the Gulf of California, M.X. We used low coverage whole genome sequencing to generate genotype likelihoods for millions of SNPs in 317 individuals collected from the Gulf of California, M.X., to Oregon, U.S., to assess population structure in Pacific Sardine. Differentiation across the genome was driven by variation at several putative chromosomal inversions ranging in size from ~21 MB to 0.89 MB, although none of the putative inversions showed any evidence of geographic differentiation. Our results support panmixia across an impressive ~4000 km range.

Keywords: Alosidae; California current; Clupeiformes; fisheries genomics; population structure.


Conflict of interest statement

The authors declare no conflicts of interest.

Figures
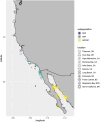
FIGURE 1
FIGURE 1
Sampling locations of 317 Pacific Sardine samples passing quality filters (BC, Baja California; BCS, Baja California Sur; CA, California; MX, Mexico; OR, Oregon). Colors correspond to subpopulation assignments (GOCSP, Gulf of California subpopulation; NSP, northern subpopulation; SSP, southern subpopulation).
FIGURE 2
FIGURE 2
Principal component analysis on 9,819,187 polymorphic sites from 317 Pacific Sardine samples collected from Oregon, U.S., to the Gulf of California, M.X. Colors correspond to subpopulation assignments (GOCSP, Gulf of California subpopulation; NSP, northern subpopulation; SSP, southern subpopulation).
FIGURE 3
FIGURE 3
Chromosome‐specific principal component analyses for 317 Pacific Sardine samples collected from Oregon, U.S., to the Gulf of California, M.X. Colors correspond to subpopulation assignments (GOCSP, Gulf of California subpopulation; NSP, northern subpopulation; SSP, southern subpopulation).
FIGURE 4
FIGURE 4
Principal component analysis excluding chromosomes with putative inversions (1, 2, 9, 11, 15, 18, & 20) on 6,905,971 polymorphic sites from 317 Pacific Sardine samples collected from Oregon, U.S., to the Gulf of California, M.X. Colors correspond to subpopulation assignments (GOCSP, Gulf of California subpopulation; NSP, northern subpopulation; SSP, southern subpopulation).
FIGURE 5
FIGURE 5
NGSadmix results for K = 2 on 9,819,187 polymorphic sites from 317 Pacific Sardine samples collected from Oregon, U.S., to the Gulf of California, M.X. Individuals are arranged based on (a) sampling sites latitudinally (1 = Tillamook, OR, 2 = Coos Bay, OR, 3 = Cape Mendocino, CA, 4 = Monterey Bay, CA, 5 = Avila, CA, 6 = Gaviota, CA, 7 = Long Beach, CA, 8 = Ensenada, BC, 9 = Punta Colonet, BC, 10 = Magdalena Bay, BCS, 11 = Gulf of California, M.X.), (b) putative subpopulation (GOCSP, Gulf of California subpopulation; NSP, northern subpopulation; SSP, southern subpopulation), and (c) groups separated by PC1 scores from the genome‐wide principal component analysis (PC1 A < 0, PC1 B > 0 & < 0.07, PC1 C > 0.07).
FIGURE 6
FIGURE 6
Manhattan plot aligning lcWGS polymorphic sites to the Pacific Sardine genome with locus‐specific F ST based on pairwise comparisons between putative subpopulations (GOCSP, Gulf of California subpopulation; NSP, northern subpopulation; SSP, southern subpopulation).

References

    1. Adams, E. S. , and Craig M. T.. 2024. “Phylogeography of the Pacific Sardine, Sardinops sagax, Across Its Northeastern Pacific Range.” Bulletin of the Southern California Academy of Sciences 123: 10–24. 10.3160/0038-3872-123.1.10. - DOI
    1. Ahlstrom, E. H. 1954. Distribution and Abundance of Egg and Larval Populations of the Pacific Sardine (Fishery Bulletin 93 No. Volume 56). From Fishery Bulletin of the Fish and Wildlife Service.
    1. Andersson, L. , Bekkevold D., Berg F., et al. 2024. “How Fish Population Genomics Can Promote Sustainable Fisheries: A Road Map.” Annual Review of Animal Biosciences 12: 1–20. 10.1146/annurev-animal-021122-102933. - DOI - PubMed
    1. Andrews, S. 2010. FastQC: A Quality Control Tool for High Throughput Sequence Data.
    1. Barnett, D. W. , Garrison E. K., Quinlan A. R., Strömberg M. P., and Marth G. T.. 2011. “BamTools: A C++ API and Toolkit for Analyzing and Managing BAM Files.” Bioinformatics 27: 1691–1692. 10.1093/bioinformatics/btr174. - DOI - PMC - PubMed