

Diffusion tractography of kidney by high angular resolution diffusion imaging
- PMID: 40917476
- PMCID: PMC12406531
- DOI: 10.1016/j.mrl.2024.200117
Diffusion tractography of kidney by high angular resolution diffusion imaging
Abstract
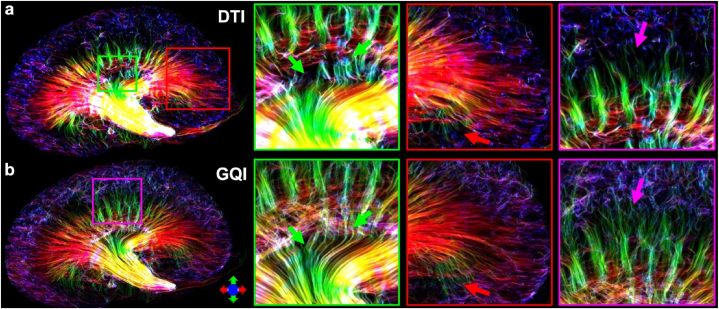
Diffusion magnetic resonance imaging (MRI) has been utilized to probe the renal microstructures but investigating the three-dimensional (3D) tubular network still presents significant challenges due to the complicated architecture of kidney. This study aims to assess whether high angular resolution diffusion imaging (HARDI) could improve the reconstruction of 3D tubular architectures. Kidneys from both mice and rats were imaged using 3D diffusion-weighted pulse sequences at 9.4 T. Five healthy mouse kidneys were scanned at an isotropic spatial resolution of 40 μm, with a b value of 1500 s/mm2 across 46 diffusion encoding directions. The study employed diffusion tensor imaging (DTI) and generalized Q-sampling imaging (GQI) to examine the tubular orientation distributions and tractography, validated by conventional histology. Fractional anisotropy (FA) and mean diffusivity (MD) were quantified and compared among the inner medullar (IM), outer medullar (OM), and cortex (CO) at different angular resolutions. FA values, estimated with 6 diffusion-weighted images (DWIs), were significantly overestimated by 49.9% (p < 0.001) in IM, 179.4% (p < 0.001) in OM, and 225.5% (p < 0.001) in CO, compared to using 46 DWIs. In contrast, MD exhibited less variations to angular resolution variations (3.4% in IM, 4.2% in OM, and 4.6% in CO). Both DTI and GQI at high angular resolution successfully traced renal tubular structures throughout the kidney, with GQI demonstrating superior performance in generating more continuous tracts. Furthermore, disrupted renal tubule structures were observed in a chronic kidney disease (CKD) rat model. HARDI, especially when combined with the GQI approach, holds promise in tracking complicated 3D tubule architectures and may serve as a potent tool for kidney disease research.
Keywords: CKD; DTI; GQI; HARDI; Kidney; MRI; Tractography.
© 2024 The Authors.
Conflict of interest statement
The authors declare that they have no known competing financial interests or personal relationships that could have appeared to influence the work reported in this paper.
Figures


References
-
- Basser P.J., Jones D.K. Diffusion-tensor MRI: theory, experimental design and data analysis - a technical review. NMR Biomed. 2002;15(7–8):456–467. - PubMed
-
- Hueper K., Hartung D., Gutberlet M., et al. Magnetic resonance diffusion tensor imaging for evaluation of histopathological changes in a rat model of diabetic nephropathy. Invest. Radiol. 2012;47(7):430–437. - PubMed
-
- Notohamiprodjo M., Glaser C., Herrmann K.A., et al. Diffusion tensor imaging of the kidney with parallel imaging: initial clinical experience. Invest. Radiol. 2008;43(10):677–685. - PubMed
-
- Wang W.J., Pui M.H., Guo Y., Wang L.Q., Wang H.J., Liu M.J. 3T magnetic resonance diffusion tensor imaging in chronic kidney disease. Abdom. Imag. 2014;39(4):770–775. - PubMed
-
- Feng Q., Ma Z.J., Wu J.L., Fang W. DTI for the assessment of disease stage in patients with glomerulonephritis - correlation with renal histology. Eur. Radiol. 2015;25(1):92–98. - PubMed
LinkOut - more resources
Full Text Sources