. 2025 Aug 24;3(3):e100204.
doi: 10.1136/egastro-2025-100204. eCollection 2025.

Gut dysbiosis is linked to severe steatosis and enhances its diagnostic performance in MASLD

Affiliations

Gut dysbiosis is linked to severe steatosis and enhances its diagnostic performance in MASLD

Marta Borges-Canha et al. eGastroenterology. .

Abstract

Background: Metabolic dysfunction-associated steatotic liver disease (MASLD) is the leading cause of chronic liver disease globally, with rising prevalence linked to metabolic syndrome (MetS). Excessive liver fat accumulation (steatosis) worsens disease progression and MASLD prognosis. Moreover, gut microbiota dysbiosis might promote steatosis, accelerating the disease progression to severe stages. Identifying gut microbiota signatures specific to steatosis severity might improve its diagnosis and inform personalised interventions in MASLD. This study aimed to characterise associations between gut microbiota composition and hepatic steatosis severity in a cohort of patients with MASLD/MetS. Ultimately, we aimed to assess the potential for microbiota features to enhance the diagnosis of severe steatosis.

Methods: A cross-sectional cohort of 61 patients with MetS with extensive clinical history was recruited at different stages of MASLD. Transient elastography was used to evaluate liver fibrosis and steatosis severity. Participants' faecal microbiota were profiled using 16S rRNA gene sequencing. Statistical analyses first identified correlations between microbiota profiles and patients' phenotypes, while disentangling important confounders such as medication. Identified features were then used to build predictive models for diagnosing severe steatosis.

Results: High steatosis severity was distinctly associated with a higher prevalence of the inflammation-associated Bacteroides 2 (Bact2)-enterotype, accompanied by a lower proportion of beneficial commensals (eg, Akkermansia) and a higher proportion of opportunistic bacteria (eg, Streptococcus). Patients harbouring a Bact2-enterotype reached severe steatosis at lower Fatty Liver Index (FLI) thresholds. Using Bact2-carrier status together with FLI in a predictive model significantly improved the classification of severe steatosis (accuracy 90%, receiver operating characteristics 96%) when compared with FLI alone.

Conclusion: Gut microbiota composition and dysbiosis (defined as Bact2-enterotype) are distinctly associated with steatosis severity in MASLD/MetS. Patient stratification by microbiota composition enhances the diagnostic classification of severe steatosis in MASLD, suggesting a potential for personalised interventions in patients with microbiota dysbiosis.

Keywords: Dysbiosis; Fatty Liver; Gastrointestinal Microbiome; Metabolic Syndrome; Metabolic diseases; Microbiota; Non-alcoholic Fatty Liver Disease.


Conflict of interest statement

SV-S and GF have received speaker fees from Ferring and Yakult, respectively. SV-S and GF are listed as inventors on patent WO2019115755A1 ‘A new inflammation-associated, low cell count enterotype’, in the name of VIB VZW, Katholieke Universiteit Leuven, KU Leuven R&D and Vrije Universiteit Brussel. SV-S and GF are credited as inventors on WO2022073973A1 ‘Means and methods to diagnose gut flora dysbiosis and inflammation’, in the name of VIB VZW, Katholieke Universiteit Leuven, KU Leuven R&D and University of Bristol. All other authors declare no competing interests.

Figures
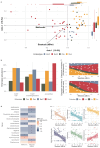
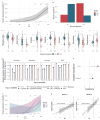
Figure 1
Figure 1. The gut microbiota composition in the microbiota e Doença Hepática Não Alcoólica (microDHNA) n=61 cohort is distinctly associated with steatosis severity (continuous measure, dB/m) and metformin use. (a) Visualisation of inter-individual differences in microbiota profiles (genus level composition) using principal component analysis (PCoA). Enterotypes (Bact2, Bact1, Rum, Prev) are represented by color. Vectors represent the post-hoc fit of the microbiota variation associated with the significant, independent determinants of genus-level variation in the microbiota community, steatosis severity and metformin intake (online supplemental table S2). Boxplots surrounding the PCoA represent the enterotype distribution data points along each PCo axis. The body of the box plot represents the first and third quartiles of the distribution, the line represents the median and the whiskers extend from the quartiles to the last data point within 1.5×interquartile range, with outliers beyond. (b) Enterotype distribution in the microDHNA cohort and compared with lean and overweight or obese participants in the Western population, Flemish Gut Flora Project (FGFP) data set. The microDHNA cohort showed greater prevalence of the dysbiotic Bact2 enterotype than lean and overweight/obese participants of the general Western population (n=2345, Chi-squared tests, online supplemental table S4). (c) Prevalence switch of enterotypes with steatosis severity in all participants and restricted to metformin users, showing the increase in Bact2 prevalence in patients with more severe steatosis (logistic regression (Logit), odds ratio=1.01, adjP=0.077, n=49, online supplemental table S5). Coloured areas represent the stacked enterotype prevalence along the steatosis gradient, with lines provided by multinomial Logit of enterotypes by steatosis severity, and data points (light grey) jittered at the corresponding steatosis severity level. (d) Genera proportions associated with steatosis severity and metformin intake (online supplemental table S5). Heatmap representation of the effect size of the associations (colour) (Spearman’s rank correlation ρ for steatosis severity and Wilcoxon rank-sum test rank biserial for metformin). Adjustment for multiple testing was performed using the Benjamini-Hochberg method (adjP). The asterisks represent the significance level (adjP<0.1*). (e) Scatter plot representation highlighting genera proportions significantly correlated with steatosis severity (Spearman rank correlation test; adjP<0.1, online supplemental table S5). Bact1, Bacteroides1; Bact2, Bacteroides2 Prev, Prevotella; Rum, Ruminococcaceae.
Figure 2
Figure 2. Performance of Fatty Liver Index (FLI) and microbiota profiling in classifying severe steatosis (≥302 dB/m) among patients with measured steatosis severity (n=49). (a, b, c) Higher FLI, positive Bact2 carrier status, lower diversity (Shannon index), a lower proportion of beneficial commensals and a higher proportion of opportunistic bacteria were associated with severe steatosis (online supplemental table S7). (a) Severe steatosis probability given FLI (logistic regression (Logit), FLI odds ratio (OR)=1.08, adjP=0.042, n=47). (b) Prevalence of Bact2 in participants with and without severe steatosis (Logit, Bact2 OR=6.6, adjP=0.026, n=49). (c) Box-violin plots highlighting microbial diversity and genera proportions significantly associated with severe steatosis (Logit, p<0.05 and adjP<0.1, respectively, n=49). Adjustment for multiple testing was performed using the Benjamini–Hochberg method (adjP). The asterisks represent the significance level (p<0.05* for Shannon index/adjP<0.1* for genera) (d) Bayesian Logit model performance for classifying severe steatosis in a holdout test set (online supplemental table S8). Model training was performed with cross-validation on a random selection of 39 of 49 patients (training set). Bayesian Logit models trained with the following variable sets: (1) FLI, (2) severe steatosis-associated genera, (3) microbiota diversity (Shannon index), (4) dysbiosis (Bact2 carrier status) and (5-8) combinations of the variable sets. The final evaluation of the models’ performance (sensitivity, specificity, accuracy and receiver operating characteristic curve (ROC)) is shown in the panel and was executed on samples excluded from training (holdout test set, n=10). The holdout test set was balanced for severe steatosis status, including five patients with and five without severe steatosis (see methods and online supplemental figure 3). The FLI alone model performance is labelled in purple. The best-performing model (FLI+Dysbiosis), with the highest accuracy and ROC) in the holdout test set, is labelled in orange. (e) Variable importance in the best-performing model for severe steatosis (online supplemental table S8). The model included FLI (coefficient=1.75) and the Bact2 carrier status (coefficient=0.67). The variable importance of scaled variables is sorted from most important (top) to least important (bottom) and indicated by number (1 being the most important). (f) Severe steatosis probability given FLI plus Bact2 carrier status (multivariate Logit, n=47). (g) FLI threshold for severe steatosis in Bact2 carriers (+) (n=26) and non-carriers (+) (n=21) (online supplemental table S9). Bact2 carriers reached severe steatosis at a lower FLI threshold than non-carriers (74 vs 101, respectively) (linear regression, Bact2 carriers, coefficient=1.84, p<0.001; Bact2 non-carriers, coefficient=0.96, p<0.001). Bact2, Bacteroides2

References

    1. Rinella ME, Lazarus JV, Ratziu V, et al. A multisociety Delphi consensus statement on new fatty liver disease nomenclature. Hepatology. 2023;78:1966–86. doi: 10.1097/HEP.0000000000000520. - DOI - PMC - PubMed
    1. Younossi ZM, Golabi P, Paik JM, et al. The global epidemiology of nonalcoholic fatty liver disease (NAFLD) and nonalcoholic steatohepatitis (NASH): a systematic review. Hepatology. 2023;77:1335–47. doi: 10.1097/HEP.0000000000000004. - DOI - PMC - PubMed
    1. Younossi ZM, Koenig AB, Abdelatif D, et al. Global epidemiology of nonalcoholic fatty liver disease-Meta-analytic assessment of prevalence, incidence, and outcomes. Hepatology. 2016;64:73–84. doi: 10.1002/hep.28431. - DOI - PubMed
    1. Buzzetti E, Pinzani M, Tsochatzis EA. The multiple-hit pathogenesis of non-alcoholic fatty liver disease (NAFLD) Metab Clin Exp. 2016;65:1038–48. doi: 10.1016/j.metabol.2015.12.012. - DOI - PubMed
    1. Marušić M, Paić M, Knobloch M, et al. NAFLD, Insulin Resistance, and Diabetes Mellitus Type 2. Can J Gastroenterol Hepatol. 2021;2021:6613827. doi: 10.1155/2021/6613827. - DOI - PMC - PubMed

LinkOut - more resources