. 2025 Sep 3;7(3):lqaf122.
doi: 10.1093/nargab/lqaf122. eCollection 2025 Sep.

A high-resolution meiotic crossover map from single-nucleus ATAC-seq reveals insights into the recombination landscape in mammals

Affiliations

A high-resolution meiotic crossover map from single-nucleus ATAC-seq reveals insights into the recombination landscape in mammals

Stevan Novakovic et al. NAR Genom Bioinform. .

Abstract

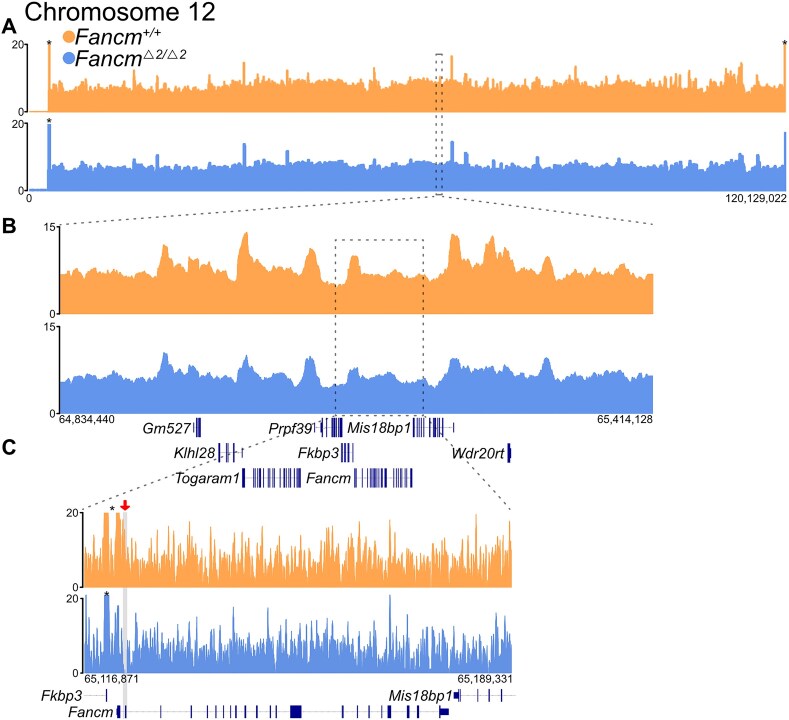
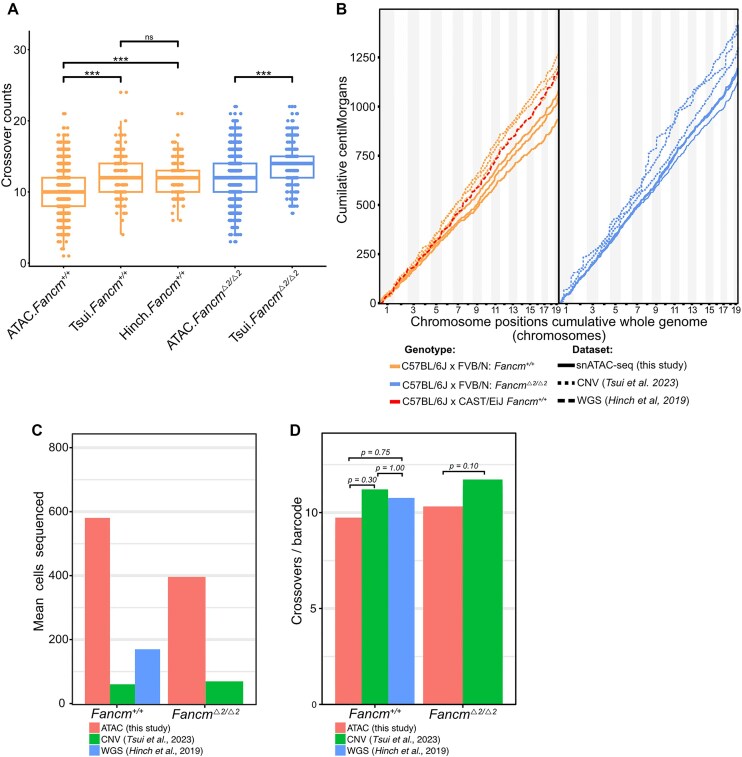
Meiotic crossovers promote correct chromosome segregation and the shuffling of genetic diversity. However, the measurement of crossovers remains challenging, impeding our ability to decipher the molecular mechanisms that are necessary for their formation and regulation. Here we demonstrate a novel repurposing of the single-nucleus Assay for Transposase Accessible Chromatin with sequencing (snATAC-seq) as a simple and high-throughput method to identify and characterize meiotic crossovers from haploid testis nuclei. We first validate the feasibility of obtaining genome-wide coverage from snATAC-seq by using ATAC-seq on bulk haploid mouse testis nuclei, ensuring adequate variant detection for haplotyping. Subsequently, we adapt droplet-based snATAC-seq for crossover detection, revealing >25 000 crossovers in F1 hybrid mice. Comparison between the wild type and a hyper-recombinogenic Fancm-deficient mutant mouse model confirmed an increase in crossover rates in this genotype, however with a distribution which was unchanged. We also find that regions with the highest rate of crossover formation are enriched for PRDM9. Our findings demonstrate the utility of snATAC-seq as a robust and scalable tool for high-throughput crossover detection, offering insights into meiotic crossover dynamics and elucidating the underlying molecular mechanisms. It is possible that the research presented here with snATAC-seq of haploid post-meiotic nuclei could be extended into fertility-related diagnostics.


Conflict of interest statement

The authors declare that they have no competing interests.

Figures

Figure 1.
Figure 1.
Bulk sequencing of tagmented haploid nuclei generates fragments that map broadly with genome-wide coverage. Libraries were generated by Tn5 fragmentation (home-made Tn5, shown above) of haploid nuclei from wild-type and mutant F1 hybrid mouse testis, with reads aligned to the mouse reference genome (mm39). Tracks show reads from wild-type (orange) and mutant (blue) samples, aligned to (A) the length of chromosome 12 (64 kb bins). (B) A zoomed-in ∼580 kb region (chr12: 64 834 440–65 414 128; 10 kb bins). (C) A zoomed-in ∼72 kb region (chr12: 65 116 871–65 189 331; 100 bp bins). The grey box highlights the locus of exon 2 of Fancm; indicated by a red arrow for clarity, showing the absence of aligned reads in the mutant dataset at this locus. *Maximum displayed coverage threshold set to 20.
Figure 2.
Figure 2.
Quality control and validation of the haploid sperm snATAC-seq libraries. (A) Comparison of genome coverage across an ∼60 kb window of chromosome 12 (chr12: 65 120 000– 65 180 000) from each mouse single-gamete library. The locus contains Fancm, with no reads mapping to exon 2 of the F1.FancmΔ2/Δ2, which carry biallelic deletions (grey) of exon 2. (B) Scatter plot of snATAC-seq data displaying QC metrics (unique fragments per cell and TSS enrichment). Low TSS enrichment highlights the condensed nature of haploid post-meiotic chromatin. (C) Violin plot showing the percentage of reads that cluster into peaks for each wild-type and mutant replicate. Three replicates (wild-type/mutant pairs) were sequenced across two sequencing runs (batch 1 and 2). (D) UMAP visualizations of snATAC-seq of haploid nuclei, from sequencing batches 1 and 2, showing cells grouped in nine clusters. (E) UMAP of snATAC data for wild-type and mutant samples, post-filtering.
Figure 3.
Figure 3.
Marker segregation for the 19 autosomal chromosomes in Fancm wild-type and mutant snATAC-seq data. Genome-wide patterns of marker segregation from gametes produced by an F1(C57BL/6J × FVB/N) mouse with two haplotypes were calculated in chromosome bins (of size 10 Mb) and found to match Mendelian segregation expectations, except for subtelomeric regions (excluded from analysis due to mapping biases in repetitive regions). Hypothesis testing using a binomial test was performed to evaluate if marker segregation ratios differ from 0.5; no significant differences were observed in any chromosomes. The y-axis units of the haplotype state ratio represent FVB/N or C57BL/6J ratios for given genomic bins, ‘1’ represents the alternative allele, which is FVB/N, and ‘0’ represents the reference allele C57BL/6J. Most genomic regions have a haplotype state ratio close to 0.5, which is consistent with chromosome segregation showing expected Mendelian ratios.
Figure 4.
Figure 4.
Analysis of coverage as a function of genetic distance [centiMorgans (cM)] reveals a robust assay for crossover detection. Coverage is defined as reads per million (RPM) mapped reads per sample. We find no significant correlation between genetic distance and coverage for both wild-type and mutant F1 mouse samples using snATAC-seq, in 10 kb bins.
Figure 5.
Figure 5.
snATAC-seq profiling of meiotic crossovers. Crossovers were assayed using snATAC-seq of isolated haploid mouse nuclei. (A) Distribution of crossover frequency assayed per haploid nucleus (n = 3 animals per genotype). The boxplot represents the median, upper, and lower quartile; whiskers represent the lowest and highest values within the 1.5 interquartile range. (B) Recombination rates measured for F1.Fancm+/+ and F1.FancmΔ2/Δ2 samples. Observed crossover fractions were converted into genetic distances (cM) via the Kosambi mapping function and presented as cumulative cM across the genome. (C) Average recombination frequency (cM) per chromosome in mutant and wild-type samples. Individual replicate values are provided in Supplementary Table S2. (D) Recombination rates (in cM) measured per 10 kb window along each chromosome position (M, megabases) for Fancm+/+ (top) and FancmΔ2/Δ2 (bottom, flipped) autosomes reveal the increased crossover rate in mutant mice.
Figure 6.
Figure 6.
Comparative analysis of crossover calling from different single-cell sequencing methodologies. Crossovers called from the snATAC-seq data were compared with single-cell sequencing datasets from Tsui et al. [26] and Hinch et al. [19]. The snATAC and Tsui et al. datasets both contained F1.FancmΔ2/Δ2 and F1.Fancm+/+ (n = 3) of C57BL/6J × FVB/N origin. The Hinch et al. dataset contains an F1.Fancm+/+ mouse of C57BL/6J and CAST/EiJ strains (n = 1). (A) The total crossovers called from each dataset, per single cell. The boxplot represents the median, upper, and lower quartile; whiskers represent the lowest and highest values within the 1.5 interquartile range. (B) The cumulative genetic distances (cM) calculated via the Kosambi mapping function, representing recombination rates for crossovers from all datasets. (C) The mean number of cells sequenced per sample is shown for each respective study. (D) The number of crossovers detected per barcode is shown for the respective genotypes and studies.
Figure 7.
Figure 7.
Analysis of crossover interference in haploids using snATAC-seq data. The distance of observed crossovers was compared with the null hypothesis generated from permutation via label swapping to simulate the absence of crossover interference. (A) The median distance for observed double crossover chromosomes from wild-type samples was ∼88.8 Mb, compared with 44.0 Mb in the null hypothesis. Pairwise comparisons using Wilcoxon rank sum test with continuity correction, P= 2 × 10⁻¹⁶. (B) The median distance for observed double crossover chromosomes from mutant samples was ∼82.6 Mb, compared with 46.1 Mb in the null hypothesis. Pairwise comparisons using Wilcoxon rank sum test with continuity correction, P< 2 × 10⁻¹⁶. (C). Median intercrossover distances were reduced by 6.2 Mb in mutant crossovers, with an interquartile range of 5.9 Mb. These findings suggest that the additional crossovers in Fancm-deficient mice are likely to be derived from the non-interfering (type II) crossover pathway. Pairwise comparisons using Wilcoxon rank sum test with continuity correction, P< 2 × 10⁻⁷. Non-parametric statistical testing was used due to non-normal data distribution.
Figure 8.
Figure 8.
Crossover sites in F1 haploid nuclei have a strong association with PRDM9-binding sites. (A) Permutation test comparing the observed mean distance between crossovers (COs) and PRDM9-binding sites (red line) with a null distribution generated by randomizing the PRDM9 ChIP-seq signal (signal fold change, compared with background) locations. Analysis includes all COs identified in snATAC-seq samples, P< 1 × 10⁻⁴. (B) One-sided Wilcoxon signed rank test for the PRDM9 ChIP-seq signal (signal fold change) compared with the top 10% of COs identified in snATAC-seq; P= 0.02. (C) Visualization of the PRDM9 ChIP-seq signal (fold change, compared with background) and crossover rate (cM/Mb, scaled by ×10 for plotting) along chromosome 12 (Mbp) for the top 10% of COs. The top track displays the PRDM9 ChIP-seq signal (signal fold change, compared with background); the bottom mirrored track shows the CO signal from snATAC-seq data. (D) One-sided Wilcoxon signed rank test for the PRDM9 ChIP-seq signals compared with the additional COs 'Higher CO loci' identified in F1.FancmΔ2/Δ2 samples, compared with all other COs 'All regions'; P= 0.14. (E) Permutation test to compare the observed mean (red line) with null distribution of PRDM9 ChIP-seq with additional F1.FancmΔ2/Δ2 COs; P< 1 × 10⁻⁴.

References

    1. Hunter N Meiotic recombination: the essence of heredity. Cold Spring Harb Perspect Biol. 2015; 7:a016618. - PMC - PubMed
    1. Lam I, Keeney S Mechanism and regulation of meiotic recombination initiation. Cold Spring Harb Perspect Biol. 2015; 7:a016634. 10.1101/cshperspect.a016634. - DOI - PMC - PubMed
    1. Gray S, Cohen PE Control of meiotic crossovers: from double-strand break formation to designation. Annu Rev Genet. 2016; 50:175–210. 10.1146/annurev-genet-120215-035111. - DOI - PMC - PubMed
    1. Szostak JW, Orr-Weaver TL, Rothstein RJ et al. The double-strand-break repair model for recombination. Cell. 1983; 33:25–35. 10.1016/0092-8674(83)90331-8. - DOI - PubMed
    1. Warren AC, Chakravarti A, Wong C et al. Evidence for reduced recombination on the nondisjoined chromosomes 21 in Down syndrome. Science. 1987; 237:652–4. - PubMed

Substances

LinkOut - more resources