Identification and Validation of Inverse Agonists for Nuclear Receptor Subfamily 4 Group A Member 2
- PMID: 40918324
- PMCID: PMC12409540
- DOI: 10.1021/acsomega.5c06698
Identification and Validation of Inverse Agonists for Nuclear Receptor Subfamily 4 Group A Member 2
Abstract
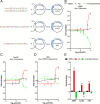
Former studies indicate that nuclear receptor subfamily 4 group A member 2 (Nurr1, NR4A2), a transcription factor, is regarded as a potential therapeutic target for central nervous system diseases, and many studies have focused on the development and optimization of agonists of Nurr1. Recent studies have shown that Nurr1 is upregulated in many other diseases. However, there is still a lack of effective inverse Nurr1 agonists as a therapeutic strategy or as pharmacological tools to counteract the receptor's inherent activity. In this study, we screened Nurr1 ligands through a high-throughput screening system and identified a novel Nurr1 inverse agonist (K-strophanthoside). We further validated the binding site of K-strophanthoside on Nurr1 and investigated its effect on regulating Nurr1 function. K-strophanthoside directly binds to the ligand-binding domain of Nurr1 (Glu445, Glu514, Arg515, and His516) and mimics the function of Nurr1 knockdown by suppressing the intrinsic Nurr1 transcriptional activity. Our study contributes a valuable chemical tool for Nurr1 modulators and provides a potential treatment target for Nurr1-related disorders.
© 2025 The Authors. Published by American Chemical Society.
Figures


Similar articles
-
Prescription of Controlled Substances: Benefits and Risks.2025 Jul 6. In: StatPearls [Internet]. Treasure Island (FL): StatPearls Publishing; 2025 Jan–. 2025 Jul 6. In: StatPearls [Internet]. Treasure Island (FL): StatPearls Publishing; 2025 Jan–. PMID: 30726003 Free Books & Documents.
-
Structural Optimization of Oxaprozin for Selective Inverse Nurr1 Agonism.J Med Chem. 2024 Aug 8;67(15):13324-13348. doi: 10.1021/acs.jmedchem.4c01218. Epub 2024 Jul 30. J Med Chem. 2024. PMID: 39081058
-
Gonadotropin-releasing hormone (GnRH) analogues for premenstrual syndrome (PMS).Cochrane Database Syst Rev. 2025 Jun 10;6(6):CD011330. doi: 10.1002/14651858.CD011330.pub2. Cochrane Database Syst Rev. 2025. PMID: 40492482 Review.
-
The quantity, quality and findings of network meta-analyses evaluating the effectiveness of GLP-1 RAs for weight loss: a scoping review.Health Technol Assess. 2025 Jun 25:1-73. doi: 10.3310/SKHT8119. Online ahead of print. Health Technol Assess. 2025. PMID: 40580049 Free PMC article.
-
Melatonin and Its Metabolites Can Serve as Agonists on the Aryl Hydrocarbon Receptor and Peroxisome Proliferator-Activated Receptor Gamma.Int J Mol Sci. 2023 Oct 23;24(20):15496. doi: 10.3390/ijms242015496. Int J Mol Sci. 2023. PMID: 37895177 Free PMC article.
References
-
- Li T., Tan X., Tian L., Jia C., Cheng C., Chen X., Wei M., Wang Y., Hu Y., Jia Q.. et al. The role of Nurr1-miR-30e-5p-NLRP3 axis in inflammation-mediated neurodegeneration: insights from mouse models and patients’ studies in Parkinson’s disease. J. Neuroinflammation. 2023;20(1):274. doi: 10.1186/s12974-023-02956-x. - DOI - PMC - PubMed
-
- Valsecchi V., Boido M., Montarolo F., Guglielmotto M., Perga S., Martire S., Cutrupi S., Iannello A., Gionchiglia N., Signorino E.. et al. The transcription factor Nurr1 is upregulated in amyotrophic lateral sclerosis patients and SOD1-G93A mice. Dis Model Mech. 2020;13(5):dmm043513. doi: 10.1242/dmm.043513. - DOI - PMC - PubMed
-
- Woo M. S., Bal L. C., Winschel I., Manca E., Walkenhorst M., Sevgili B., Sonner J. K., Di Liberto G., Mayer C., Binkle-Ladisch L.. et al. The NR4A2/VGF pathway fuels inflammation-induced neurodegeneration via promoting neuronal glycolysis. J. Clin. Invest. 2024;134(16):e177692. doi: 10.1172/JCI177692. - DOI - PMC - PubMed
-
- Satoh J., Nakanishi M., Koike F., Miyake S., Yamamoto T., Kawai M., Kikuchi S., Nomura K., Yokoyama K., Ota K.. et al. Microarray analysis identifies an aberrant expression of apoptosis and DNA damage-regulatory genes in multiple sclerosis. Neurobiol Dis. 2005;18(3):537–550. doi: 10.1016/j.nbd.2004.10.007. - DOI - PubMed
LinkOut - more resources
Full Text Sources
