. 2025 Nov 3;13(11):1816-1828.
doi: 10.1158/2326-6066.CIR-25-0575.

Nonredundant Immune Checkpoints Direct Therapeutic Resistance to Chemoimmunotherapy in Pancreatic Ductal Adenocarcinoma

Affiliations

Nonredundant Immune Checkpoints Direct Therapeutic Resistance to Chemoimmunotherapy in Pancreatic Ductal Adenocarcinoma

Meredith L Stone et al. Cancer Immunol Res. .

Abstract

Pancreatic ductal adenocarcinoma (PDA) is characterized by a myeloid-enriched microenvironment and has shown remarkable resistance to immune checkpoint blockade (e.g., anti-PD-1 and anti-CTLA-4). In this study, we sought to define the role of myeloid immunosuppression in immune resistance in PDA. We report that although depletion of CSF1R+ myeloid cells in combination with anti-PD-1 and chemotherapy triggers T-cell infiltration into PDA, it also causes compensatory remodeling of the myeloid compartment with limited tumor control. Combination therapy against multiple myeloid targets, including CSF1R, CCR2/5, and CXCR2, was insufficient to overcome treatment resistance. High-dimensional single-cell analyses performed on T-cell infiltrates in human and mouse PDA revealed upregulation of multiple immune checkpoint molecules, including PD-1, LAG-3, and CTLA-4. Combinatorial blockade of PD-1, LAG-3, and CTLA-4 along with chemotherapy and anti-CSF1R was necessary to trigger activation of peripheral CD4+ and CD8+ T cells and led to deep, durable, and complete tumor responses, with each immune checkpoint blockade agent contributing to efficacy. Our findings indicate that a comprehensive approach targeting both negative regulatory signals controlling T-cell function and the myeloid compartment will be fundamental to unveiling the potential of immunotherapy in PDA.


Conflict of interest statement

Conflicts of Interest:

G.L.B. reports prior or active roles as a consultant/advisory board member for Adicet Bio, Aduro Biotech, AstraZeneca, BiolineRx, BioMarin Pharmaceuticals, Boehinger Ingelheim, Bristol-Myers Squibb, Cantargia, Cour Pharmaceuticals, Genmab, HotSpot Therapeutics, Incyte, Janssen, Merck, Molecular Partners, Monopteros, Nano Ghosts, Opsona, Pancreatic Cancer Action Network, Seagen, Shattuck Laboratories, and Verastem; reports receiving commercial research grants from Incyte, Bristol-Myers Squibb, Verastem, Halozyme, Biothera, Hibercell, Newlink, Novartis, Arcus, and Janssen. G.L.B. is an inventor of intellectual property related to CAR T cells managed by the University of Pennsylvania.

Figures

Figure 1:
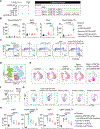
Figure 1:. Depletion of CSF1R+ cells combined with chemotherapy and anti-PD-1 drives T cell infiltration into tumors but elevates immune checkpoint molecules CTLA-4 and LAG3.
A) 10 days after subcutaneous injection of 5×10⁵ 7940B.PDA cells, gemcitabine (gem) and anti-CSF1R were administered weekly beginning on Day 0. Anti-PD-1 was administered on D0, 3, 7, 10, and 14. n=10 mice per group. Percent survival is shown. Mantel-Cox test performed. Data are representative of one biological replicate. B-C) Mouse tumors were collected on Day 11, formalin fixed, paraffin embedded, and stained for CK19 (yellow), Foxp3 (purple), CD8 (brown). B) Cells were quantified in Visiopharm software. Mann Whitney tests were performed on comparisons to control. C) Representative images are shown. Scale bars = 100µm. D-F) CyTOF was performed on mouse tumor samples with T cells identified as in as described in Supplemental Fig. S4A. D) Unsupervised FlowSOM clustering was performed on T cells. E) tSNE plots of cluster frequency across treatments. F) Quantification of clusters 2 and 5. Ordinary one-way ANOVA with Tukey’s multiple comparisons correction was performed. G) Human PDA samples (n=9) were stained for CD8 (FAM, green), LAG3 (Red610, red), CTLA-4 (R6G, gold), PD-1 (DCC, teal), and CK19 (Cy5, purple). Representative images of T cells expressing checkpoint molecules are shown. H) Proportion of patients with at least one T cell expressing respective molecules in five representative 40x images. Mann Whitney tests were performed. I) Expression of immune checkpoint genes measured by RNA sequencing of T cell inflamed or non-inflamed tumor stroma isolated by laser capture microdissection. Mann Whitney tests performed. Statistical significance is indicated as follows: *, p < 0.05; **, p < 0.01; ***, p < 0.001; ****, p < 0.0001. Error bars represent standard deviation (SD).
Figure 2.
Figure 2.. The addition of anti-LAG3 and anti-CTLA4 to combination chemotherapy with anti-CSF1R and anti-PD-1 induces systemic T-cell proliferation and activation.
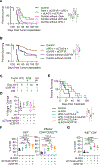
A) Study schema is shown. Mice received subcutaneous (s.c.) injection of 5×10⁵ 7940B cells and ten days later treated with anti-CSF1R, anti-PD1, anti-LAG3, anti-CTLA4, and gemcitabine (gem). B) Peripheral blood was taken at day 7 and stained with flow panel shown in Supplementary Fig. 7A. Quantification of effector, Ki67+, and PD1+ CD8+ or CD4+ T cells is shown. C) Representative flow plots of naïve (CD44neg CD62L+), central memory (CD44+CD62L+), and effector (CD44+CD62Lneg) CD8+ T cells are shown. D) T cells were gated on single, live, CD3+ events and UMAP clustering was performed. E) UMAP plots showing cell frequency. F) Study schema. Mice received s.c. injection of 5e5 7940B cells and ten days later were treated with anti-CSF1R, gem, and ICB (immune checkpoint blockade; anti-PD1, anti-LAG3, anti-CTLA4) G) Representative flow plots of proliferating Ki67+CD8+ T cells. H) Quantification of proliferating and effector CD8+ and CD4+ T cells. Comparisons to control and comparisons of combination treatment to other treatment groups are shown. Ordinary one-way ANOVA with Tukey’s multiple corrections tests were performed. Data are representative of one biological replicate. Statistical significance is indicated as follows: *, p < 0.05; **, p < 0.01; ***, p < 0.001; ****, p < 0.0001. Error bars represent standard deviation (SD).
Figure 3.
Figure 3.. Overcoming resistance mechanisms by combining anti-CSF1R and chemotherapy with concurrent immune checkpoint blockade leads to cures in mice.
A) Study schema. C57BL/6 mice (n=10/group) received subcutaneous injections of 5×10⁵ 7940B cells and 10 days later were treated with Gem, anti-CSF1R+anti-PD1, Gem+anti-CSF1R+anti-PD1, or Gem+anti-CSF1R+anti-PD1+anti-LAG3+anti-CTLA4. B) Percent change in tumor volume from D0 to D14. Kruskal-Wallis test with Dunn’s multiple comparisons test was performed. C) Tumor volume at day 20 is shown. Ordinary one-way ANOVA with Tukey’s multiple comparisons test was performed. D) Individual tumor growth curves. E) Percent survival and median survival are shown. Mantel-Cox test performed. All comparisons are shown. Data are representative of two biological replicates for control and quintuple groups, and one biological replicate for other groups. Statistical significance is indicated as follows: *, p < 0.05; **, p < 0.01; ***, p < 0.001; ****, p < 0.0001. Error bars represent standard deviation (SD).
Figure 4.
Figure 4.. Sequential dismantling approach defines aPD1, aLAG3, and aCTLA4 as essential for maximum treatment efficacy.
A) Mice were treated as in Fig. 3A. Left: Kaplan-Meier survival curves comparing gemcitabine (gem)+aCSF1R+aPD1+aLAG3+aCTLA4 (combo) to the combo without aPD-1, combo without aCTLA4, or combo without gem n= 10 mice/group. Right: Table showing median overall survival (days) and cures for each treatment. Data shown are from n=2 biological replicates. B) Left: Kaplan-Meier survival curves comparing aCSF1R+aPD1+aLAG3+aCTLA4 (combo) to the combo without aLAG3 or without aCSF1R. Right: Table showing median overall survival (days) and cures for each treatment. Data shown are from n=3 biological replicates. Significance was determined by Mantel Cox tests. C) Study schematic. C57BL/6J mice (n=8/group) were orthotopically injected with 5×10⁵ 7940B cells. Ten days later, mice were treated with aCSF1R (0.6mg i.p.) and immune checkpoint blockade (ICB; aPD-1, aCTLA-4, aLAG3; 0.2mg i.p.). D) Percent change in mouse weight D0 to D7. Significance was determined by Ordinary One-Way ANOVA test with Tukey’s multiple comparison test. E) Survival (days post treatment). Mantel Cox test was performed. F-G) Quantification of frequency of proliferating (Ki67+) and effector (CD44+CD62Lneg) CD8+ (H) and CD4+ (I) T cells is shown. Statistical analysis by ordinary one-way ANOVA with Šídák’s multiple comparisons. Multiple comparisons were control vs. all other groups and the triplet vs. all other groups. Statistical significance is indicated as follows: *, p < 0.05; **, p < 0.01; ***, p < 0.001; ****, p < 0.0001. Error bars represent standard deviation (SD).

References

    1. Pishvaian MJ, Blais EM, Brody JR, Lyons E, DeArbeloa P, Hendifar A, et al. Overall survival in patients with pancreatic cancer receiving matched therapies following molecular profiling: a retrospective analysis of the Know Your Tumor registry trial. Lancet Oncol 2020;21(4):508–18 doi 10.1016/S1470-2045(20)30074-7. - DOI - PMC - PubMed
    1. Waldman AD, Fritz JM, Lenardo MJ. A guide to cancer immunotherapy: from T cell basic science to clinical practice. Nat Rev Immunol 2020;20(11):651–68 doi 10.1038/s41577-020-0306-5. - DOI - PMC - PubMed
    1. Beatty GL, Eghbali S, Kim R. Deploying Immunotherapy in Pancreatic Cancer: Defining Mechanisms of Response and Resistance. Am Soc Clin Oncol Educ Book 2017;37:267–78. - PubMed
    1. Balachandran VP, Beatty GL, Dougan SK. Broadening the Impact of Immunotherapy to Pancreatic Cancer: Challenges and Opportunities. Gastroenterology 2019;156(7):2056–72. - PMC - PubMed
    1. Ho WJ, Jaffee EM, Zheng L. The tumour microenvironment in pancreatic cancer - clinical challenges and opportunities. Nat Rev Clin Oncol 2020;17(9):527–40 doi 10.1038/s41571-020-0363-5. - DOI - PMC - PubMed

MeSH terms

Substances