. 2025 Sep 8:blood.2024027432.
doi: 10.1182/blood.2024027432. Online ahead of print.

Platelet Factor 4 (PF4) Regulates Hematopoietic Stem Cell Aging

Affiliations

Platelet Factor 4 (PF4) Regulates Hematopoietic Stem Cell Aging

Sen Zhang et al. Blood. .

Abstract

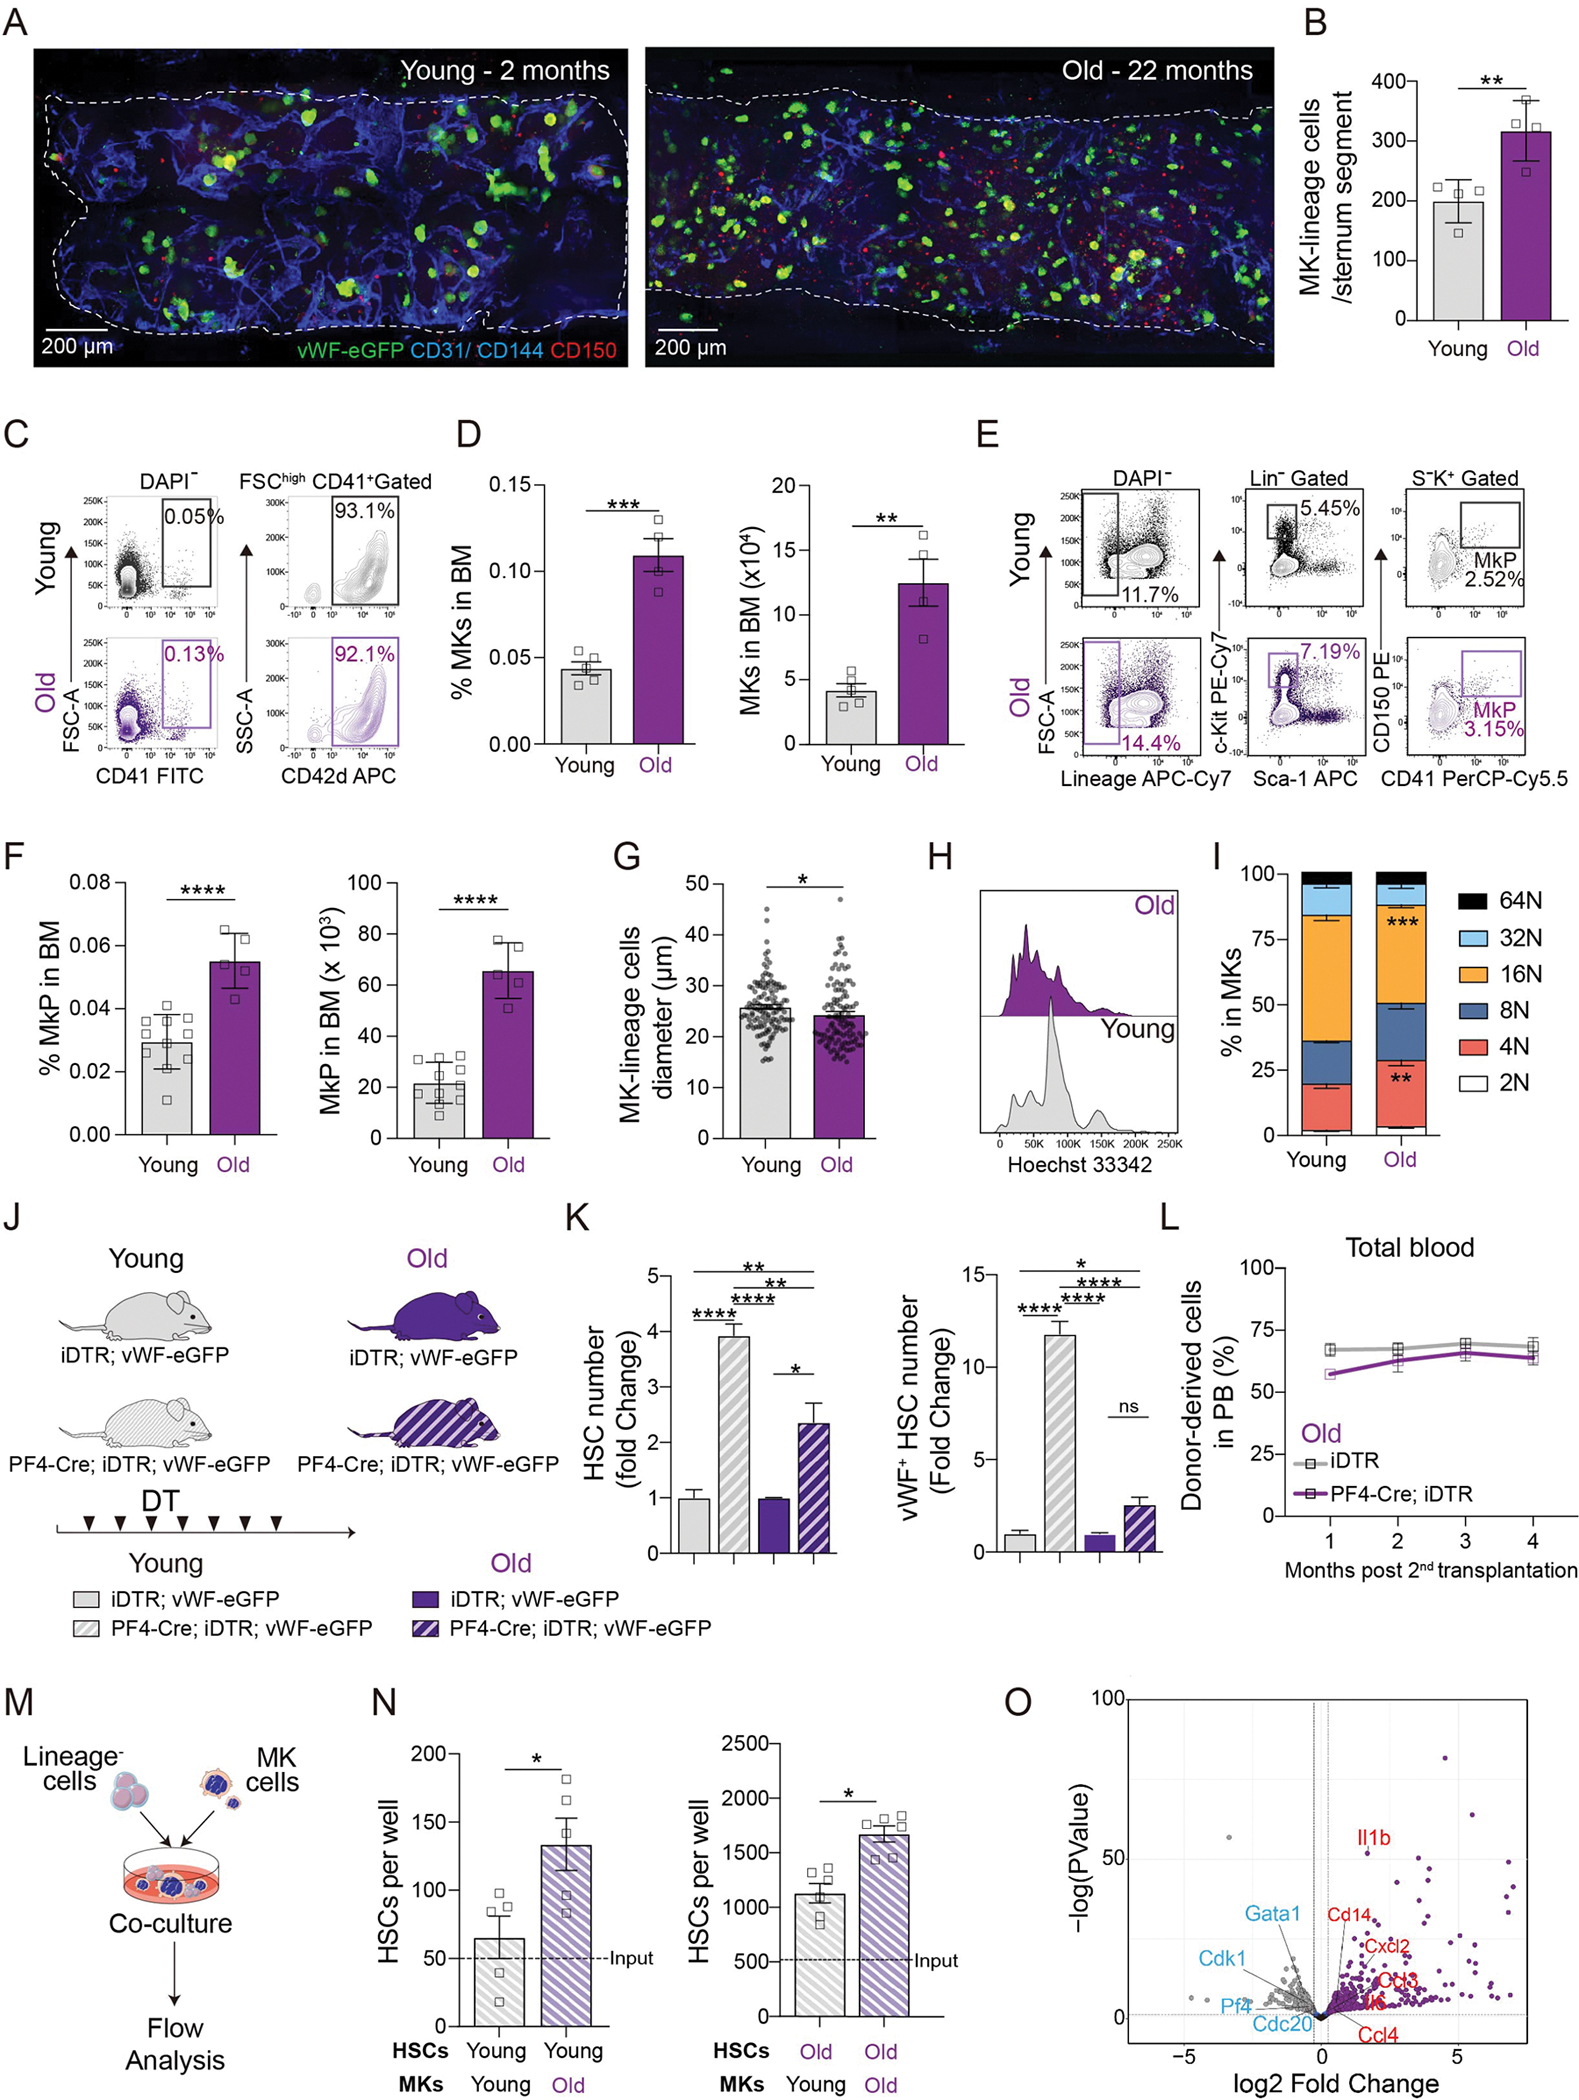
Hematopoietic stem cells (HSCs) responsible for blood cell production and their bone marrow regulatory niches undergo age-related changes, impacting immune responses and predisposing individuals to hematologic malignancies. Here, we show that the age-related alterations of the megakaryocytic niche and associated downregulation of Platelet Factor 4 (PF4) are pivotal mechanisms driving HSC aging. PF4-deficient mice display several phenotypes reminiscent of accelerated HSC aging, including lymphopenia, increased myeloid output, and DNA damage, mimicking physiologically aged HSCs. Remarkably, recombinant PF4 administration restored old HSCs to youthful functional phenotypes characterized by improved cell polarity, reduced DNA damage, enhanced in vivo reconstitution capacity, and balanced lineage output. Mechanistically, we identified LDLR and CXCR3 as the HSC receptors transmitting the PF4 signal, with double knockout mice showing exacerbated HSC aging phenotypes similar to PF4-deficient mice. Furthermore, human HSCs across various age groups also respond to the youthful PF4 signaling, highlighting its potential for rejuvenating aged hematopoietic systems. These findings pave the way for targeted therapies aimed at reversing age-related HSC decline with potential implications in the prevention or improvement of the course of age-related hematopoietic diseases.


Conflict of interest statement

Disclosure of Conflicts of Interest

The authors declare no competing interests.

Figures

Figure 1.
Figure 1.. Aging induces remodeling of the megakaryocytic niche.
A. Whole-mount confocal images of the sternal bone marrow (BM) from young (2 months old) and old (22 months old) vWF-eGFP mice. MK-lineage cells are distinguished by their size (>15 μm), morphology, CD150, and vWF expression. Endothelial cells are labeled with CD31/CD144. B. Quantification of MK-lineage cell number from the sternal BM of young (2–3 months) and old (20–24 months) mice (young n = 4, old n = 4). C. Representative flow cytometry analysis of MKs (FSChigh CD41+ CD42d+) in the BM of young and old mice. D. Percent (left) and absolute number (right) of MKs found in the BM of young and old mice (young n = 5, old n = 4). E. Representative flow cytometry analysis of MK progenitors (MkP, Lin c-Kit+ Sca-1 CD150+ CD41+) in the BM of young and old mice. F. Percent (left) and absolute number (right) of MkPs found in BM of young and old mice (young n = 11, old n = 5). G. Average MK-lineage cell diameter from the sternal BM of young and old mice. H. Representative histogram of young and old MK (FSChigh CD41+ CD42d+) ploidy distribution and I. quantification (young n = 5, old n = 4). J. Experimental design to test the effect of MK depletion on young and old mice. K. Fold change of HSC and vWF+ HSC numbers after MK depletion in young and old mice. L. Total blood chimerism (CD45.2+) of secondary recipient mice transplanted with BM cells from 1st recipients, which received HSCs from old iDTR and old PF4-Cre; iDTR mice after 7-day diphtheria toxin (DT) injection. M. Experimental outline of MKs and HSCs co-culture. CD45.2+ young or old Lineage cells were co-cultured with CD45.1+ young or old MKs for 4 days. N. Flow cytometric analysis of CD45.2+ Lin c-Kit+ Sca-1+ CD150+ CD48 HSC numbers obtained under various conditions. The starting number of HSCs seeded in the co-culture is indicated (Input). O. Volcano plots indicating differentially expressed genes (DEGs, P < 0.05, Fold change > 1.2) between young and old MKs. Data are presented as mean ± SD. *P < 0.05, **P < 0.01, ***P < 0.001, ****P < 0.0001.
Figure 2.
Figure 2.. Young Pf4−/− mice exhibit phenotypes reminiscent of premature HSC aging.
A. Representative FACS plots of myeloid, B, CD4+, and CD8+ T cells in the BM of young (2-month-old), old (22-month-old), and young Pf4−/− (2-month-old) mice. B. Percentage of myeloid, B, and T cells (combined CD4+ and CD8+ T cells) in the BM of young, old, and Pf4−/− mice (young n = 7, old n = 5, young Pf4−/− n = 7). C. CD45.2+ young Lineage cells were co-cultured with CD45.1+ MK cells from young control and young Pf4−/− mice for 4 days. Flow cytometric analysis of CD45.2+ total HSCs and CD41+ HSCs. The starting number of HSCs seeded in the co-culture is indicated (Input). D. Left: Representative confocal z-stack projections of HSCs sorted from young, old, or young Pf4−/− mice stained for γH2AX and Hoechst. Scale bar, 10 μm. Right: Quantification of the percentage of HSCs with γH2AX foci (calculated as the mean percentage of a total of 181, 264, and 607 HSCs isolated from 3 young, 3 old, and 4 young Pf4−/− mice). E. Representative confocal 2.5 D images of HSCs sorted from young, old, or young Pf4−/− mice and stained against cdc42, α-Tubulin, and Hoechst. F. Quantification of the percentage of cdc42 and α-Tubulin polarized HSCs out of total HSCs scored (total of 53, 60, 64 HSCs isolated from 3 young, 3 old, and 4 young Pf4−/− mice). G. Experimental design of 5-FU injection (IP, Intraperitoneal injection). H. Regeneration of peripheral white blood cells (WBC) and monocytes after 5-FU treatment of young, old, or young Pf4−/− mice (young n = 4, old n = 4, young Pf4−/ n = 6). Data are mean ± SEM. *P < 0.05, **P < 0.01, ***P < 0.001, ****P < 0.0001.
Figure 3.
Figure 3.. PF4 administration reverses HSC aging phenotypes.
A. Outline of in vitro experimental strategy. B. Number of total (left graph) and myeloid-biased (CD41+ HSCs, right graph) old HSCs per well after culture with PF4 (young n = 6, old n = 6). C. Ki67 cell cycle analysis of total and myeloid-biased old HSCs cultured with PF4 (young n = 6, old n = 6). D. In vivo PF4 administration and HSC competitive transplantation assay experimental design. E. PF4 levels in the serum of young-saline, old-saline, and old-PF4 mice (Young-Saline n = 3, Old-Saline n = 3, Old-PF4 mice n = 5, each dot is the mean of two replicates). F. Total cell counts in the BM of young-saline, old-saline, and old-PF4 mice (Young-Saline n = 7, Old-Saline n = 5, Old-PF4 mice n = 5). G. Total HSC number in the BM of young-saline, old-saline, and old-PF4 mice (Young-Saline n = 7, Old-Saline n = 5, Old-PF4 mice n = 5). H. Quantification of the percentage of HSCs with γH2AX foci (calculated as the mean percentage of a total of 387 and 185 HSCs isolated from 5 Old-Saline and 5 Old-PF4 mice). I. Quantification of the percentage of cdc42 (left graph) and α-Tubulin (right graph) polarized HSCs out of total HSCs scored (total of 138 and 103 HSCs isolated from 5 Old-Saline and 5 Old-PF4 mice). J. Donor-derived blood cell chimerism in recipient mice competitively transplanted with 250 sorted HSCs from Young-Saline, Old-Saline, and Old-PF4-treated mice, as described in D. K. Composition of donor-derived myeloid, B, and T cells in the peripheral blood (PB) of recipients, 4 months after transplantation. L. Quantification of engraftment and tri-lineage (myeloid, B-cell, and T-cell) differentiation in the mice transplanted with 10 million total BM from 1st recipients. Data are mean ± SEM. *P < 0.05, **P < 0.01, ***P < 0.001, ****P < 0.0001.
Figure 4.
Figure 4.. PF4 regulates HSCs through both CXCR3 and LDLR receptors.
A. Experimental strategy to investigate the PF4 receptor on HSCs. B. Normalized number of CD41+ HSCs to control well after culture with PF4 in the presence or absence of anti-LDLR, anti-CXCR3, anti-EPCR, anti-CXCR2 neutralizing antibodies, CCR1 inhibitor, or relevant controls (isotypes or DMSO). C. Experimental strategy to test the effect of PF4 on HSCs from Ldlr−/− and Cxcr3/− mice. D. Number of HSCs per well, normalized to control, after culture with PF4. E. Representative histogram and frequency of LDL-pHRodo+ young HSCs after PF4 treatment (PF4low: 1 μg/mL, PF4high: 5 μg/mL). A functional blocking anti-LDLR antibody was used as a negative control. F. Representative histogram and frequency of LDL-pHRodo+ old HSCs after PF4 treatment (PF4low: 1 μg/mL, PF4high: 5 μg/mL). G. Experimental strategy to generate DKO (Ldlr−/−; Cxcr3−/−) mice. H. Composition of myeloid, B, and T cells in the BM of young WT and DKO mice (WT n = 4, DKO n = 4). I. Total cell counts in the BM of young WT and DKO mice (WT n = 4, DKO n = 4). J. Absolute number of HSCs in BM of young WT and DKO mice (WT n = 6, DKO n = 7). K. Number of ST-HSC, MPP2, MPP3, and MPP4 in the BM of young WT and DKO mice (WT n = 6, DKO n = 7). L. Frequency of colony-forming unit cell (CFU-C) derived from 104 BM cells from young WT and DKO mice. M. Left: Representative confocal z-stack projections of HSCs sorted from young WT and DKO mice and stained with γH2AX and Hoechst. Scale bar, 5 μm. Right: Quantification of the percentage of HSCs with γH2AX foci (calculated as the mean percentage of a total of 113 and 76 HSCs isolated from 3 young WT and 3 young DKO mice). N. Representative confocal 2.5D images of HSCs sorted from young WT and DKO mice and stained with cdc42, α-Tubulin, and Hoechst. O. Quantification of the percentage of cdc42 and α-Tubulin polarized HSCs out of total HSCs scored (total of 49 and 72 HSCs isolated from 3 young WT and 3 young DKO mice). Data are mean ± SEM. *P < 0.05, **P < 0.01, ***P < 0.001, ****P < 0.0001.
Figure 5.
Figure 5.. hPF4 regulates the proliferation of human HSCs.
A. Schematic of human CD34+ BM cells cultured with recombinant human PF4 (hPF4). B. Number of human cells per well after culturing with hPF4 at the different concentrations (n = 6 wells for each condition). C. Cell cycle analysis of human HSCs treated with hPF4 (n = 6 wells for each condition). D. Representative FACS plots of human HSCs after hPF4 culture. E. Number of phenotypic HSCs (Lin CD34+ CD38 CD90+ CD45RA) per well, normalized to the control, after culture with hPF4 at 2.5 μg/mL (n = 6–12 wells for each donor). F. Percentage of HSCs (ages: 52–55) with γH2AX foci after culture with hPF4 for 18 hours (total of 80 and 52 cells from control and hPF4 treatment group). G. Representative confocal 2.5D images of HSCs from the control and hPF4 treatment group stained with cdc42, α-Tubulin, and Hoechst. H. Quantification of the percentage of cdc42 and α-Tubulin polarized HSCs out of total HSCs scored (total of 86 and 97 cells from control and hPF4 treatment group). I. Experimental outline of the human Long-Term Culture-Initiating Cell (LTC-IC) assays. J. Quantification of long-term reconstituting HSCs by LTC-IC assay on human HSCs ex vivo treated with hPF4. K. Experimental design to test the in vivo reconstitution potential of PF4-treated human HSCs. L. Donor blood cell chimerism (human (h)CD45+) of human PF4-treated HSCs in recipient NSG mice. M. Total bone marrow (BM) cell chimerism (hCD45+), HSPC (hCD45+LinCD34+CD38), and HSC (hCD45+LinCD34+CD38CD90+CD45RA) in NSG mice transplanted as in K. Data are mean ± SEM. *P < 0.05, **P < 0.01, ***P < 0.001, ****P < 0.0001.

Update of

References

    1. Lopez-Otin C, Blasco MA, Partridge L, Serrano M, Kroemer G. Hallmarks of aging: An expanding universe. Cell. 2023;186(2):243–278. - PubMed
    1. Pinho S, Frenette PS. Haematopoietic stem cell activity and interactions with the niche. Nat Rev Mol Cell Biol. 2019;20(5):303–320. - PMC - PubMed
    1. Colom Diaz PA, Mistry JJ, Trowbridge JJ. Hematopoietic stem cell aging and leukemia transformation. Blood. 2023;142(6):533–542. - PMC - PubMed
    1. Jamieson CHM, Weissman IL. Stem-Cell Aging and Pathways to Precancer Evolution. N Engl J Med. 2023;389(14):1310–1319. - PMC - PubMed
    1. Pang WW, Price EA, Sahoo D, et al. Human bone marrow hematopoietic stem cells are increased in frequency and myeloid-biased with age. Proc Natl Acad Sci U S A. 2011;108(50):20012–20017. - PMC - PubMed