. 2025 Sep;27(9):1510-1525.
doi: 10.1038/s41556-025-01735-5. Epub 2025 Sep 8.

RNA-binding proteins mediate the maturation of chromatin topology during differentiation

Affiliations

RNA-binding proteins mediate the maturation of chromatin topology during differentiation

Bondita Dehingia et al. Nat Cell Biol. 2025 Sep.

Abstract

Topologically associating domains (TADs) and chromatin architectural loops impact promoter-enhancer interactions, with CCCTC-binding factor (CTCF) defining TAD borders and loop anchors. TAD boundaries and loops progressively strengthen upon embryonic stem (ES) cell differentiation, underscoring the importance of chromatin topology in ontogeny. However, the mechanisms driving this process remain unclear. Here we show a widespread increase in CTCF-RNA-binding protein (RBP) interactions upon ES to neural stem (NS) cell differentiation. While dispensable in ES cells, RBPs reinforce CTCF-anchored chromatin topology in NS cells. We identify Pantr1, a non-coding RNA, as a key facilitator of CTCF-RBP interactions, promoting chromatin maturation. Using acute CTCF degradation, we find that, through its insulator function, CTCF helps maintain neuronal gene silencing in NS cells by acting as a barrier to untimely gene activation during development. Altogether, we reveal a fundamental mechanism driving developmentally linked chromatin structural consolidation and the contribution of this process to the control of gene expression in differentiation.


Conflict of interest statement

Competing interests: The authors declare no competing interests.

Figures
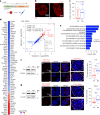
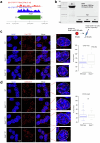
Fig. 1
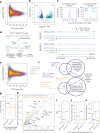
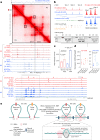
Fig. 1. ES-to-NS cell transition is accompanied by enhanced CTCF clustering and increase in CTCF–RBP interactions.
a, In CTCFHALO ES cells, the HALO domain, along with the linking peptide (SM), is inserted in the C-terminal tail of the CTCF protein. b, The distribution of CTCF in ES and NS CTCFHALO cells. Cells stained with 5 μM TMR were preextracted, fixed and imaged using a Zeiss LSM800 confocal microscope in AiryScan mode. c, Volumetric analysis of CTCF clusters in ES and NS cells. Box plots depict the distribution of the measured volumes of CTCF clusters in CTCFHALO ES and NS cells (P = 1.4 × 10−7, two-sided t-test, Nexperiments = 3; nuclei from one representative experiment are displayed). d, ChIP–SICAP reveals changes in the CTCF–protein interactome upon ES-to-NS cell transition. Proteins with high abundance are considered (emPAI >0.5). Left: heat map of logarithm base 2 of fold change of protein abundances between ES and NS cells (LFC); proteins with P-adj. < 0.1 are shown. Right: ChIP–SICAP LFC in two biological replicates. Red: proteins with decreased; blue: proteins with increased association with CTCF upon ES-to-NS transition. e, Gene Ontology (GO) analysis of proteins featuring an increased association with CTCF in NS compared with the ES cells. The top ten GO terms are displayed (P-adj. = 2.3 × 10−23). f, The association between CTCF and Fus in ES and NS cells. Left: western blot analysis of Fus expression in ES and NS CTCFHALO cells. Middle: a representative example of a PLA readout in ES and NS cells (Zeiss LSM800 confocal microscope in AiryScan mode, λex = 594 nm; λem = 624 nm). Right: box plot showing the distribution of the per-nucleus number of PLA puncta in ES and NS cells (***P < 0.01, two-sided t-test). g, The association between CTCF and DEAD-box RNA helicase Ddx5 in ES and NS cells, analogous to the one presented in f (***P < 0.01, two-sided t-test). In box plots, the box spans first and third quartile, the line inside the box indicates median, and whiskers indicate smallest (bottom) and largest (top) non-outlier in the data). Source numerical data and unprocessed blots are available in the extended data and source data, as well as in data repositories (see accession codes and the webpage associated with this study).
Fig. 2
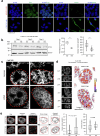
Fig. 2. Ddx5 and Fus shape the distribution of CTCF in the nucleoplasm in a differentiation-stage-specific manner.
a, The experimental design to determine the impact of deletion of Ddx5 and Fus on the distribution of CTCF in the ES and NS cell nucleoplasm. b, Loss of Ddx5 or Fus has a differentiation-stage-specific impact on CTCF clustering. STED microscopy of CTCFHALO ES and NS wild-type (Wt) and Ddx5- or Fus-knockout (KO) lines stained by TMR. c, Live-cell near super-resolution microscopy of TMR-stained NS wild-type and Ddx5-knockout lines, Nexperiments = 2; nuclei from one representative experiment are displayed. d, Genetic engineering of a Ddx5FKBP degron CTCFHALO ES cell line. Top: cassette containing an FKBP domain was inserted into the 5′ end of the Ddx5 coding sequence in the CTCFHALO ES cell line. Bottom: PCR validation of the homozygous KI of the cassette, Nexperiments = 3 in ES and NS cells; genotyping from one representative experiment is displayed. e, The addition of dTAG13 results in the removal of Ddx5 regardless of the differentiation state. Left: experimental design. Right: western blot validation of Ddx5 protein removal upon 24-h treatment with dTAG13 (Nexperiments = 3 for DMSO and dTAG13 ES and NS cells, Nexperiments = 4 for wild-type ES and NS cells; ES ***PWt vs DMSO = 0.001, ***PDMSO vs dTAG13 = 0.005 and ****PWt vs dTAG13 = 0.0001; NS ****PWt vs DMSO = 0.0007, ****PWt vs dTAG13 = 0.0004 and ****PDMSO vs dTAG13 = 0.0007 two-sided t-test; the box spans the first and third quartiles, the line inside the box indicates the median, and whiskers indicate the smallest (bottom) and largest (top) non-outlier in the data). f, Live-cell imaging of CTCF clusters in the nucleus in wild-type and Ddx5FKBPCTCFHALO KI cells (Ddx5-KI) treated with either DMSO or dTAG13 for 24 h, Nexperiments = 2; nuclei from one representative experiment are displayed. Source numerical data, unprocessed gels and blots are available in extended and source data as well as in data repositories (see also the webpage associated with this study).
Fig. 3
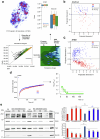
Fig. 3. Ddx5 loss weakens CTCF binding at CG-rich locations featuring high propensity to form G4q.
a, Mean difference and average intensity (MA) plot of the CTCF ChIP-seq peak signal (area under the curve ± 100 bp around the peak summit) change in wild-type and Ddx5−/− NS cells. b, Volcano plot of peak signal (in a) in wild-type and Ddx5−/− NS cells; blue: FDR <0.25, DESeq2 method. c, Average CTCF binding at sites identified as changing CTCF abundance upon Ddx5 loss (in b). d, Acute loss of Ddx5 leads to diminished CTCF binding at the Aldh1a3 locus. Left: experimental scheme. Ddx5 is removed upon the addition of dTAG13. Right: RPGC-normalized CTCF signal; grey tracks: difference between CTCF signal in dTAG13- and DMSO-treated NS cells. e, MA plot of the CTCF ChIP-seq peak signal (see b) following acute depletion of Ddx5 in NS cells. f, Identification of CTCF peaks affected by Ddx5 depletion. Two biological replicate samples of CTCF ChIP-seq for each genotype were considered (N = 2 wild type, N = 2 Ddx5−/− clones along with N = 2 biological replicate treatments of Ddx5FKBP KI NS cells with vehicle or dTAG13; ***P < 0.01, Fisher’s test). g, CTCF motif strength at peaks with altered CTCF signal upon Ddx5 removal (***P < 0.0001; two-sided t-test, peaks from f were considered; nlosing = 251, ngaining = 124). h, TF-binding site (TFBS) enrichment at peaks with altered CTCF signal upon Ddx5 removal (peaks from f were considered; nlosing = 251, ngaining = 124). i, The number of CpGs at peaks with altered CTCF signal upon Ddx5 removal (***P < 0.0001; two-sided t-test, peaks from f were considered; nlosing = 251, ngaining = 124). j, The number of G4q (score >20) at peaks with altered CTCF signal upon Ddx5 removal (***P < 0.0001; two-sided t-test, peaks from f were considered; nlosing = 251, ngaining = 124). k, G4q score at peaks with altered CTCF signal upon Ddx5 removal (***P < 0.0001; two-sided t-test, peaks from f were considered; nlosing = 251, ngaining = 124). The box spans the first and third quartiles, the line inside the box indicates the median, and whiskers indicate the smallest (bottom) and largest (top) non-outlier in the data. Source numerical data are available in the extended data and source data, and in data repositories.
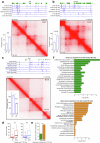
Fig. 4
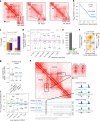
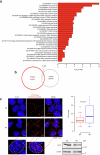
Fig. 4. The presence of Ddx5 leads to CTCF–CTCF loop strengthening genome-wide.
a, In situ Hi-C profiles in wild-type and Ddx5−/− CTCFHALO NS cells (each map is an average of two biological replicate libraries). b, Hi-C signal decline as a function of genomic distance in wild-type and Ddx5−/− NS cells. c, The fraction of CTCF peaks with altered CTCF abundance upon Ddx5 loss at loop anchors or other locations in the genome (P = 6.9 × 10−14, Fisher’s exact test, peaks from Fig. 3b). d, Architectural loop strength (Methods, purple) is diminished upon loss of Ddx5 in the NS cells. Grey: bin pairs not connected by a loop but separated at equal genomic distance as the loop anchors; ***P < 0.01 two-sided t-test; numbers of instances per interaction size range are indicated in the figure. e, The number of loops featuring diminished or enhanced Hi-C signal in Ddx5−/− compared with wild-type NS cells (Methods). f, APA of loops lost in the Ddx5−/− NS cells (in e). Loops with anchors separated by more than 100 kb were considered. g, Changes in loop strength in wild-type and Ddx5−/− NS cells. Changes in loop strength are shown for all loops and for loops with anchors overlapping CTCF peaks that decreased upon Ddx5 loss. Numbers of loops in each category are indicated; ***P < 0.01 two-sided t-test. h, Acute loss of Ddx5 impacts CTCF–CTCF loop formation. Hi-C was obtained in DMSO- and dTAG13-treated Ddx5FKBP NS cells. Biol., biological. i, Acute loss of Ddx5 affects primarily strong loops (measured as the summed Hi-C signal in a 5 × 5 square centred at loop centroid at a resolution of 10 kb; numbers of loops in each category are indicated; ***P < 0.01 two-sided t-test; ns, nonsignificant). Each box spans the first and third quartiles, the line inside the box indicates the median, and whiskers indicate the smallest (bottom) and largest (top) non-outlier in the data. Source numerical data are available in extended and source data as well as in data repositories (see also the webpage associated with this study).
Fig. 5
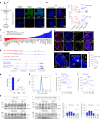
Fig. 5. NS cell-specific lncRNA Pantr1 regulates the association between CTCF and RBPs.
a, Left: acute RNA removal from the cells. Right: confocal microscopy images or Pyronin Y staining in untreated and RNAseA-treated NS CTCFHALO cells. Nexperiments = 3; nuclei from one representative experiment are displayed. b, PLA for CTCF–Ddx5 and CTCF–Fus interactions in untreated and RNaseA-treated CTCFHALO cells (***P < 0.001; numbers of nuclei in each category are indicated). c, Polyadenylated lncRNAs that interact with CTCF and feature changes in expression level upon the ES-to-NS transition (P-adj. < 0.1 DESeq2 method; 46C ES and NS cell transcriptomes were considered in this analysis). d, Pantr1 is transcriptionally activated upon neural induction of distinct ES cell lines (RNA-seq: 46C and CTCFHALO ES and NS cells, CTCF ChIP-seq: 46C ES and NS cells). Scissors: sgRNA locations in CRISPR–Cas9 editing. e, RNA-FISH of Pantr1 RNA (yellow) in CTCFHALO ES and NS cell nuclei (CTCF: TMR blue; DNA, DAPI magenta). A single plane is displayed. Nexperiments = 2 for NS and Nexperiments = 1 for ES: nuclei from one representative experiment are displayed. f, Over 60% of Pantr1 puncta overlap CTCF-enriched regions in NS cell nuclei. (Nexperiments = 2; representative nuclei from one experiment are shown). g, Normalized expression of Pantr1 in wild-type and Pantr1−/− NS cells (quantitative reverse-transcriptase PCR (qRT–PCR); normalized average expression of Pantr1 in two technical replicate qRT–PCR reactions for a representative validation is displayed; validations were performed before each experiment using Pantr1−/− NS cells (n > 3). h, Flow cytometry-assisted examination of CTCF protein expression in wild-type and Pantr1−/− CTCFHALO NS cells (nWt = 32,263, nPantr1 PB6 = 19,544, nPantr1 PE3 = 14,769; 5 µM TMR). i, Loss of Pantr1 disrupts CTCF–Ddx5 interactions. CTCF–Ddx5 interaction in wild-type and Pantr1−/− NS cells (***P < 0.001; two-sided t-test). j, Analysis of CTCF–Fus interactions, analogous to the one presented in i. k, Co-immunoprecipitation (co-IP) assays assessing interactions between CTCF and Ddx5 and CTCF and Fus in wild-type and CTCFHALO Pantr1−/− NS cells (readout: western blot; an exemplary experiment is displayed). Four clones of wild-type and two clones of Pantr1−/− were considered; three independent experiments probing CTCF–Ddx5 interactions and two experiments to probe CTCF–Fus interactions were performed. Each box spans the first and third quartiles, the line inside the box indicates the median, and the whiskers indicate the smallest (bottom) and largest (top) non-outlier in the data. Microscopy images were acquired with a Zeiss LSM800 confocal microscope with an AiryScan detector. Source numerical data are available in extended and source data as well as in data repositories (see accession codes and the webpage associated with this study).
Fig. 6
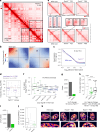
Fig. 6. Loss of Pantr1 leads to weakening of CTCF-anchored chromatin topology in NS cells.
a, The interaction profile of chromosome 2 in wild-type (lower triangle) and Pantr1−/− NS cells (upper triangle; Nexperiment = 1; Nwild-type clone = 1; NPantr1−/− clone = 2). b, Saddle plots in wild-type and Pantr1-knockout NS cells (samples as in a; obs, observed). c, Hi-C signal as a function of genomic distance (samples as in a). d, Removal of Pantr1 leads to insulator weakening. Numbers of loops in each group are displayed (mut, mutant). e, Exemplary Hi-C profiles in wild-type and Pantr1−/− NS cells. f, Loss of Pantr1 leads to weakening of strong architectural loops (***P < 0.01, two-sided t-test). g, There are more lost than gained loops in Pantr1−/− NS cells compared with their wild-type counterparts. h, Loops with Hi-C signal diminished in both Ddx5-depleted and Pantr1−/− NS cells display overall high Hi-C signal in the wild-type NS cells (***P < 0.01, two-sided t-test). i, More CTCF peaks lose than gain CTCF signal in the Pantr1−/− NS cells. j, CTCF peaks that lose CTCF signal in the Pantr1−/− NS cells compared with the wild-type cells feature high levels of CTCF. k, The distribution of CTCF in the cell nucleus in wild-type and Pantr1−/− NS cells. CTCF clusters are enriched at the nuclear rim in the Pantr1−/− NS cells compared with their wild-type counterparts. Microscopy images were acquired with a Zeiss LSM800 confocal microscope with an AiryScan detector. Each box spans the first and third quartiles, the line inside the box indicates the median, and whiskers indicate the smallest (bottom) and largest (top) non-outlier in the data. Source numerical data are available in extended and source data as well as in data repositories (see also the webpage associated with this study).
Fig. 7
Fig. 7. Gain of architectural functions of CTCF upon neural induction of ES cells.
a, The experimental design to assess the impact of CTCF removal on chromatin activity and gene expression in ES and NS cells. CTCF degradation in the CTCF-AID cells is induced by treatment with an auxin analogue IAA (the ES cells are from ref. ). b, Removal of CTCF more frequently leads to gene upregulation than downregulation in the NS cells. An opposite effect is seen in the ES cells, where CTCF loss leads primarily to gene downregulation (P = 4.2 × 10−11, Fisher’s exact test). c, Genes that feature increased expression upon CTCF removal in NS cells tend to reside at a shorter genomic distance from each other and from active enhancers (promoter–promoter, nup = 358, ndown = 195, Kolmogorov–Smirnov test P = 3.4 × 10−7; promoter–enhancer, nup = 358, ndown = 198, two-sided Kolmogorov–Smirnov test P = 5.4 × 10−4; the box spans the first and third quartiles, the line inside the box indicates the median, and whiskers indicate the smallest (bottom) and largest (top) non-outlier in the data). d, Genes upregulated upon CTCF removal are more frequently flanked by active enhancers than the downregulated or randomly sampled loci (analysis in the NS cells). Loop domains containing DEGs or randomly picked loci were considered in the analysis. Active enhancers (ATAC-seq peaks intersecting H3K27ac peaks located outside promoter regions) were counted in the 500-kb flanks of the two loop anchors (schematic above the box plot; ***P < 0.001, two-sided, Kolmogorov–Smirnov test). Loop annotation based on the in situ Hi-C data from ref. (each box spans the first and third quartiles, the line inside the box indicates the median, and whiskers indicate the smallest (bottom) and largest (top) non-outlier in the data; nup = 219, ndown = 125 and nrandom = 1,690). Source numerical data are available in extended and source data as well as in data repositories (see accession codes and the webpage associated with this study). Random, random.
Fig. 8
Fig. 8. Gain of architectural functions of CTCF at Aldh1a3 locus and the model.
a, Enhancement of CTCF–CTCF loops at the Aldh1a3 locus upon the ES-to-NS cell transition. Hi-C and chromatin activity profiles (RPGC-normalized in this study) at the Aldh1a3 locus in the control and IAA-treated ES and NS cells (red and blue, respectively). Insulation is displayed above the interactome plot. Three CTCF sites are close to the Aldh1a3 gene (grey boxes). Black-box: CTCF-anchored loop featuring an increase in Hi-C signal upon ES-to-NS transition; dashed lines: CTCF binding sites at the Aldh1a3 locus; grey area: region intersecting putative regulatory elements at the Aldh1a3 locus (zoomed in in the panel below); black arrow indicates the orientation of the CTCF motif at the CTCF binding site within the 3′ end of the Aldh1a3 locus. b, Zoom on Aldh1a3 locus together with the profile of CTCF binding and motif (fwd., forward; rev., reverse) orientation in ES (top) and NS (bottom) 46C cells. The three CTCF sites (sites 1, 2 and 3) were removed individually in the ES cells using CRISPR–Cas9 (bottom; two clones per region were obtained, validation of the deletion was performed twice). The ES cells were differentiated into NS cells. c, RNA-seq inferred expression of Aldh1a3 in untreated and IAA-treated CTCF-AID cells. P values were obtained with the DESeq2 method (ES, P = 0.08; NS, P = 6.6 × 10−31). d, qRT–PCR-based assessment of Aldh1a3 expression in the wild-type and CTCF-binding site-knockout ES and NS cells (P= 0.01, two-sided t-test; see a for an annotation of CTCF sites and genotyping; individual points indicate replicates in the qRT–PCR reactions). e, Model. Loss of pluripotency is linked with a gain of expression of RNAs that interact with CTCF, including Pantr1. Pantr1 RNA associates with DNA close to the CTCF motif within CpG-rich sequences. The sites also feature high propensity to form G4q (not displayed for simplicity). The Pantr1 locations close to CTCF locations attract RBPs that probably form local protein aggregates (perhaps phase-separated condensates), which may slow down cohesin, thereby stabilizing loop formation and consolidating TAD borders and chromatin structure in differentiation. A robust insulator function of CTCF in the NS cells is key to restraining the expression of neuronal genes, which would otherwise be efficiently upregulated by enhancers active in the NS cells. Source numerical data are available in extended and source data as well as in data repositories (see accession codes and the webpage associated with this study).
Extended Data Fig. 1
Extended Data Fig. 1. Relates to Fig. 2| The ES-to-NS cell transition is accompanied by changes in the nuclear distribution of CTCF and the gain of interactions between CTCF and RNA binding protein.
a. Pluripotency and neural stem cell marker protein expression in ES and NS CTCFHALO cells. ES cells express the pluripotency marker Oct4 and feature no signal for Nestin, a neural stem cell marker. On the contrary, NS cells express Nestin but maintain the pluripotency marker Oct4 silenced (secondary antibody coupled with Alexa Fluor was used, Zeiss LSM800 confocal microscope with Airyscan mode, the experiment was performed three times. ES-to-NS cell transition validation was displayed from one experiment). b. Western blot analysis of the level of CTCF protein in ES and NS CTCFHALO cells. Beta-actin was used as a loading control. Bottom left panel: densitometry-based quantification of Western blot signal for CTCF referred to the signal of actin beta in ES and NS CTCFHALO cells (***P = 0.0093, two-sided t-test, N = 3; box spans first and third quartile, line inside the box indicates median, whiskers indicate smallest (bottom) and largest (top) non-outlier in the data)). Bottom right panel: nuclear volume in ES and NS cells (****P = 7.74 × 10¹³, two-sided t-test, N = 45; box spans first and third quartile, line inside the box indicates median, whiskers indicate smallest (bottom) and largest (top) non-outlier in the data)). c. Stimulated emission depletion (STED) microscopy and Confocal (Zeiss LSM800 with Airyscan mode) analyses of paraformaldehyde-fixed ES and NS cells with pre-extraction. The cells were incubated with TMR to visualise CTCF; the dye was then washed off. CTCF not bound to DNA was removed by treating the cells with the extraction buffer. Next, the cells were fixed (4% paraformaldehyde), mounted to the coverslips, and analyzed using STED or Zeiss LSM800 confocal microscope with Airyscan mode, experiment was performed three times, nuclei from one representative experiment were displayed. d. A representative heatmap of TMR signal intensity is displayed for fixed ES and NS cells. Image were acquired in Airyscan mode, experiment was performed three times, representative nuclei from one experiment was displayed. e. Enhanced clustering of CTCF in the NS cells is visualised by STED. Single plane images were considered. To remove noise, Gaussian blur was applied and background subtracted. Features were then identified and analysed (right). We observe more aggregates of CTCF in the NS than in the ES cells. (Right: NESnuclei = 92, NESnuclei = 93; **P = 0.038; two-sided t-test; box spans first and third quartile, line inside the box indicates median, whiskers indicate smallest (bottom) and largest (top) non-outlier in the data). The CTCF aggregates in the NS cells are of a bigger volume than the aggregates in the ES cells (Left: NESnuclei = 92, NESnuclei = 93; ****P = 1.75 × 1046; two-sided t-test; box spans first and third quartile, line inside the box indicates median, whiskers indicate smallest (bottom) and largest (top) non-outlier in the data). Source numerical data and unprocessed blots are available in source data as well as in data repositories (see accession codes and the webpage associated with this study).
Extended Data Fig. 2
Extended Data Fig. 2. Relates to Fig. 1 Topological data analysis of CTCF signal distribution in the cell nucleus allows distinguishing ES and NS cells.
a. Topological Data Analysis (TDA) to assess the differences in the pattern of CTCF distribution in ES and NS cells. Images were pre-processed to remove any intensity differences for the structural analysis of the cells. Three-dimensional Zeiss confocal microscope pictures (Zeiss LSM800 with Airyscan mode) as well as three-dimensional super-resolution STED microscope pictures of CTCF distribution were considered and converted into cubical complexes. Persistence images, Betti Curves as well as Persistence Statistics were considered to obtain vectorisation. Machine learning was used to train different classifiers (70–30% train test split) in both cases. Precision, (balanced) accuracy, and recall values for the cell type prediction based on the topological features of CTCF distribution in the cell nucleus are displayed with the boxplots (Airyscan: NNucleiES = 39, NNucleiNS = 52, STED: NNucleiES = 269, NNucleiNS = 209; box spans first and third quartile, line inside the box indicates median, whiskers indicate smallest (bottom) and largest (top) non-outlier in the data) for the best-performing classifier & vectorisation. b. 2D projection of a separating hyperplane in 3D after dimensionality reduction using Principal Component Analysis on the Betti curve vectorization of persistence diagrams from Airyscan pictures (explained variance = 53%). The projection shows the hyperplane as the abscissa. Red circles: correctly annotated ES cells; blue circles: correctly annotated NS cells; crosses incorrect annotation of cell type based on the TDA analysis of the CTCF signal. c. TDA of STED images of CTCF distribution in ES and NS cells. Analogue projection of a separating hyperplane as in b for persistence image vectorizations of STED pictures (explained variance = 99.9%). Red circles: correctly annotated ES cells; blue circles: correctly annotated NS cells; crosses incorrect annotation of cell type based on the TDA analysis of the CTCF signal. d. Fluorescence recovery after photobleaching (FRAP) analysis of TMR (concentration: 5 µM) labelled ES and NS CTCFHALO cells (measurements were performed using Zeiss LSM780 confocal microscope). FRAP curves were normalized following the standard two-step method: first, the background signal was subtracted (background: signal coming outside of the nucleus), then the fluorescence signal was referred to that of the average fluorescence at the FRAP-ed area immediately before the bleach (first 5 frames). Finally, the normalized signal at the bleach cycle (t = 6s) was subtracted from the normalized values at t>6s.). CTCF displays overall similar dynamics of association with chromatin in ES and NS cells. e. Despite differences in the nuclear volume and the overall level of CTCF, the amount of chromatin-bound CTCF is similar in the ES and NS cells while Ddx5 interacts with chromatin more in the NS cells. The abundance of CTCF and Ddx5 chromatin-bound protein was determined in ES and NS cells using subcellular fractionation. Actin-beta and Tata binding protein (TBP) was used as a controls testifying successful nuclear fraction isolation (left panel). Right panel: densitometry-based quantification of Western blot signal for CTCF (top) and Ddx5 (bottom) in the nuclear and chromatin bound fractions. Ddx5 binding to chromatin is enhanced in NS cells compared to ES cells (*** P = 0.004, two-sided t-test, N = 3). Source numerical data and unprocessed blot are available in source data as well as in data repositories (see accession codes and the webpage associated with this study).
Extended Data Fig. 3
Extended Data Fig. 3. Relates to Fig. 1| The ES-to-NS cell transition is accompanied by changes in the nuclear distribution of CTCF and the gain of interactions between CTCF and RNA binding protein.
a. Gene ontology (GO) analysis of proteins linked with CTCF in ES or NS cells (P-adj. < 2.2 × 10⁻¹⁶). b. Venn Diagram displaying the overlap between Dppa4 and CTCF binding sites in the ES cells. c. PLA analysis of CTCF-Nono interaction in ES and NS CTCFHALO cells. Top: a representative example of proximity ligation assay (PLA) readout in ES and NS cells (CTCF-Nono interaction, Zeiss LSM800 confocal microscope with Airyscan mode, λex 594 nm; λem 624 nm). Bottom left: western blot analysis of expression of Nono in ES and NS CTCFHALO cells. Right: boxplot showing the distribution of the per nucleus number of PLA puncta in ES and NS cells (*** P = 4 × 10³, two-sided t-test NESnuclei = 30, NNSnuclei = 28; box spans first and third quartile, line inside the box indicates median, whiskerers indicate smalest (bottom) and largest (top) non-outlier in the data).). Source numerical data and unprocessed blot are available in source data as well as in data repositories (see accession codes and the webpage associated with this study).
Extended Data Fig. 4
Extended Data Fig. 4. Relates to Fig. 2| Ddx5 and Fus impact CTCF functions in a differentiation-stage-specific manner.
a. PLA for Ddx5-Fus interaction in ES and NS cells (NESnuclei = 16, NNSnuclei = 20; box spans first and third quartile, line inside the box indicates median, whiskers indicate smallest (bottom) and largest (top) non-outlier in the data, P = 0.47; ns = non-significant). b. Engineering of the Ddx5−/− CTCFHALO ES cells. Top panel: genome browser view of RNA-seq data tracks at the Ddx5 locus in CTCFHALO ES and NS cells. Scissors indicate sites targeted by sgRNAs used for the CRISPR-Cas9 mediated genome editing. Bottom panel: Ddx5 protein level in wild type and Ddx5 deletion ES cells, experiment was performed two times. c. Engineering of the Fus−/− CTCFHALO ES cells. Top panel: genome browser view of RNA-seq data tracks at the Fus locus in CTCFHALO ES and NS cells. Scissors indicate sites targeted by sgRNAs used for the CRISPR-Cas9 mediated genome editing. Bottom panel: Fus protein level in wild type and Fus deletion ES cells, experiment was performed two times. d. Loss of Ddx5 leads to loss of CTCF clustering in the nucleoplasm. Imaging of wild type and Ddx5−/− NS CTCFHALO cells. Cells were incubated with 5 µM TMR for 30 minutes at 37 °C. Following this, the cells were incubated with the pre-extraction buffer to remove the unbound fraction of CTCF. An additional Ddx5 deletion clone was obtained to further verify the effect (Zeiss LSM800 confocal microscope with Airyscan mode was used to acquire the images) experiment was performed three times. e. Western blot analysis of CTCF protein level in Ddx5−/− and Fus−/− NS CTCFHALO cells, experiment was performed two times. Source numerical data, unprocessed gels and blot are available in source data as well as in data repositories (see accession codes and the webpage associated with this study).
Extended Data Fig. 5
Extended Data Fig. 5. Relates to Fig. 2| Generation and validation of Ddx5 FKBP ES and NS cell lines.
a. Purification of Ddx5FKBP ES cells. CTCFHALO ES cells were co-transfected with modified pSpCas9(BB)-2A-GFP (PX458) plasmid containing two sgRNA targeting Exon1 of the Ddx5 gene and the donor plasmid with the knock-in cassette (AM-FKBP-RFP657-HA). Cells showing both the RFP657 and GFP fluorescent signals were sorted at 36 hours post-transfection. b. Pluripotency and neural stem cell marker protein expression in ES and NS CTCFHALO Ddx5FKBP cells. ES cells express pluripotency marker Oct4 and feature no signal for Nestin, a neural stem cell marker. On the contrary, NS cells express Nestin but maintain the pluripotency marker Oct4 silenced (secondary antibody coupled with Alexa Fluor was used, Zeiss LSM800 confocal microscope with Airyscan mode, experiment was performed two times).
Extended Data Fig. 6
Extended Data Fig. 6. Relates to Figs. 3 & 4| Ddx5 impacts CTCF binding and chromatin insulation in the NS cells.
a. Loss of Ddx5 diminishes CTCF binding to chromatin in the NS cells genome-wide. The top and bottom right panels are RPGC-normalized CTCF ChIP-seq tracks in two replicates of the wild type and Ddx5−/− cells (two clonal lines were considered). The bottom left panel: boxplot illustrating the distribution of the logarithm base 2 of the fold change of CTCF signal in ES and NS cells (PeaksES = 12718, PeaksNS = 42232; RPGC normalized signal integrated over regions −/+ 50bp around CTCF peak summits, P < 2.2 × 10⁻¹⁶, two-sided t-test, merged ChIP-seq files for the two wild type and two knockout clones were considered in this analysis; box spans first and third quartile, line inside the box indicates median, whiskers indicate smallest (bottom) and largest (top) non-outlier in the data). b. Loss of Ddx5 impacts inter-domain contacts, leading to diminished insulation score (IS). Histogram of IS change in wild type versus Ddx5−/− NS cells. Insulators identified in the wild type NS cells were considered (n = 6,132, P < 2.2 × 10¹⁶, two-sided t-test). c. IS change for insulators (left panel) and randomly picked genomic intervals (n = 6132, P < 2.2 × 10¹⁶, two-sided t-test; box spans first and third quartile, line inside the box indicates median, whiskers indicate smallest (bottom) and largest (top) non-outlier in the data).). d. Average signal of CTCF at peaks intersecting loop anchors (green) versus peaks in the rest of the genome (brown, *** - P < 2.2 × 10¹⁶, two-sided t-test). e. Distribution of putative G4 quadruplexes around the summits of CTCF peaks featuring a CTCF motif (within 20bp of the peak summit). G4q score was computed using R/Bioconductor package pqsfinder and G4q with a minimum score 10 were considered for this analysis. The direction of the CTCF motif is indicated with the arrow. f. Genotyping of Pantr1−/− clones in CTCFHALO ES cells, experiment was performed three times. Source numerical data and unprocessed gel are available in source data as well as in data repositories (see accession codes and the webpage associated with this study).
Extended Data Fig. 7
Extended Data Fig. 7. Relates to Fig. 5| Neat1 removal does not affect CTCF-Fus nor CTCF-Ddx5 interactions.
a. Removal of Neat1 gene in the CTCFHALO ES cells using CRISPR-Cas9. Left: Neat1 locus. The positions of sgRNAs are indicated with scissors. b. Genotyping results of Neat1−/− clones confirming removal of the entire locus, experiment was performed two times. c. The association between CTCF and Fus in NS cells is not affected by the removal of Neat1. Left: a representative example of proximity ligation assay (PLA) readout in NS cells (CTCF-Fus interaction, Zeiss LSM800 confocal microscope with Airyscan mode, λex 594 nm; λem 624 nm). Right: boxplot showing the distribution of the per nucleus number of CTCF-Fus PLA puncta in NS cells (P = 0.002, two-sided t-test NESnuclei = 30, NNSnuclei = 28; box spans first and third quartile, line inside the box indicates median, whiskers indicate smallest (bottom) and largest (top) non-outlier in the data). d. The association between CTCF and Ddx5 in NS cells is not affected by the removal of Neat1. Left: a representative example of proximity ligation assay (PLA) readout in NS cells. Right: boxplot showing the distribution of the per nucleus number of CTCF-Ddx5 PLA puncta in NS cells (P = 0.502, two-sided t-test, non-significant, NESnuclei = 30, NNSnuclei = 28; box spans first and third quartile, line inside the box indicates median, whiskers indicate smallest (bottom) and largest (top) non-outlier in the data). Source numerical data and unprocessed gel are available in source data as well as in data repositories (see accession codes and the webpage associated with this study).
Extended Data Fig. 8
Extended Data Fig. 8. Relates to Fig. 6| Gain of architectural functions of CTCF upon neural induction of ES cells translates to enhanced insulator role of CTCF.
a. Neural induction of the CTCF-AID ES cells leads to profound changes in the transcriptome. RNA-seq data was normalized using DESeq2. b. Volcano plot for DESeq2 analysis to identify differentially expressed genes upon ES-to-NS transition of the CTCF-AID cells (*P-adj. < 0.01). c. DESeq2-normalized Log2 (fold change) of gene expression of a panel of pluripotency and neural lineage markers in CTCF-AID ES and NS cells (*P-adj. < 0.01). d. Characterisation of CTCF-AID NS cells. Immunofluorescence-based detection of Nestin (NS cell marker), Tuj1 (neuronal marker) and Glial Fibrillary Acidic Protein (GFAP, astrocyte marker) in NS cells grown in the presence of EGF and FGF, which favour the self-renewal of the NS cells and therefore their undifferentiated state (left). Detection of Tuj1 and GFAP in the NS cells that were differentiated into astrocytic lineage (withdrawal of EGF, FGF, the addition of 2% Foetal Bovine Serum; top right panel) or neuronal lineage (removal of EGF and FGF). Zeiss LSM800 confocal microscope with Airyscan mode was used to acquire the images. Source numerical data are available in source data as well as in data repositories (see accession codes and the webpage associated with this study) experiment was performed three times.
Extended Data Fig. 9
Extended Data Fig. 9. Relates to Fig. 7| Gain of architectural functions of CTCF upon neural induction of ES cells translates to enhanced insulator role of CTCF.
a. CTCF removal in the CTCF-AID NS cells. Green fluorescence reports on the level of CTCF before and after the IAA (auxin analogue) treatment. CTCF is efficiently removed upon 24-hour exposure to IAA. b. RPGC-normalized ChIP-seq tracks of CTCF enrichment in ES and NS CTCF-AID cells in the presence and absence of IAA. c. Log2 fold change of CTCF signal upon IAA treatment in ES and NS CTCF-AID cells. Peak coordinates of CTCF in the untreated conditions were considered, and the RPGC normalized signal was integrated around the peak summits (+/− 50 base pairs) in the treated and untreated cells. d. Removal of CTCF does not lead to overt changes in chromatin openness and H3K27ac peaks in ES and NS cells. Venn diagrams compare peak sets identified in the untreated and IAA-treated cells. e. Volcano plot of DESeq2 analysis of RNA-seq data of untreated and IAA-treated ES and NS CTCF-AID cells. Red – P-adj. < 0.1. ES and NS cell conditions were analysed separately. f. Comparison of the transcriptional effects of CTCF removal in ES and NS cells (Log2 fold change of gene expression was computed using DESeq2). DEGs identified in at least one comparison were considered (P-adj. < 0.1). Blue – genes affected by CTCF removal in the NS cells only; red – genes affected by the CTCF removal in the ES cells only; green – genes affected in the two comparisons. g. Relationship between ATAC-seq and ChIP-seq peak changes and differential gene expression upon CTCF removal. Net number of peaks in 500kb intervals centred around TSS of genes differentially expressed upon CTCF removal are displayed for ES and NS cells (ES: H3K27acdown = 418, H3K27acup = 357; ATACdown = 418, ATACup = 357; NS: H3K27acdown = 198, H3K27acup = 358; ATACdown = 198, ATACup = 358; box spans first and third quartile, line inside the box indicates median, whiskerers indicate smalest (bottom) and largest (top) non-outlier in the data). Source numerical data are available in source data as well as in data repositories (see accession codes and the webpage associated with this study).
Extended Data Fig. 10
Extended Data Fig. 10. Relates to Fig. 7| Gain of architectural functions of CTCF upon neural induction of ES cells translates to enhanced insulator role of CTCF.
a. Hi-C (data from ref. ) and chromatin activity profiles (ChIP-seq and ATAC-seq profiles – this study) at the Nerve growth factor receptor (Ngfr) locus in NS cells. ChIP-seq and ATAC-seq were performed in NS cells derived from the CTCF-AID ES cells in the presence and absence of IAA. Three independent experiment was performed. Left panel: bar graph depicting the normalized expression of Ngfr in the untreated and IAA-treated NS cells (*** P < 0.01, P = 1.3 × 10⁻⁵; DESeq2 method). b. Chromatin structure and activity at Calcium/Calmodulin Dependent Protein Kinase II Alpha (Camk2a) locus. Three independent experiment was performed. Analysis analogous as in panel a. Left panel: bar graph depicting the normalized expression of Camk2a in the untreated and IAA-treated NS cells (*** P < 0.01, P = 1.4 × 10⁻³; DESeq2 method). c. Chromatin structure and activity at SRY-Box Transcription Factor 9 (Sox9) locus. The analysis is analogous to the one presented in panel a (*** P < 0.01; P = 3 × 10⁻⁸, DESeq2 method). d. Box-plot of the transcript per million sequenced read pairs (TPM) normalized expression level of genes that are either up- or down-regulated upon CTCF loss in the ES (left) and NS (right) cells (Three independent experiment was performed. Box spans first and third quartile, line inside the box indicates median, whiskerers indicate smalest (bottom) and largest (top) non-outlier in the data; *P = 0.012; ***P = 2.1 × 10⁻⁷). e. Percentage of genes that are up- or downregulated upon CTCF loss in the NS and that feature a CTCF binding site at its promoter (Fisher’s exact test, P = 2.4 × 10⁷). f. Enrichment of ontologies for sets of genes featuring an increased (green) or decreased (orange) expression upon CTCF removal in the NS cells (P-adj. < 0.1, DESeq2 method). Analysis was performed using DAVID tool (https://david.ncifcrf.gov/). Source numerical data are available in source data as well as in data repositories (see accession codes and the webpage associated with this study).

References

    1. Dixon, J. R. et al. Topological domains in mammalian genomes identified by analysis of chromatin interactions. Nature485, 376–380 (2012). - PMC - PubMed
    1. Nora, E. P. et al. Spatial partitioning of the regulatory landscape of the X-inactivation centre. Nature485, 381–385 (2012). - PMC - PubMed
    1. Sexton, T. et al. Three-dimensional folding and functional organization principles of the Drosophila genome. Cell148, 458–472 (2012). - PubMed
    1. Rao, S. S. P. et al. A 3D map of the human genome at kilobase resolution reveals principles of chromatin looping. Cell159, 1665–1680 (2014). - PMC - PubMed
    1. de Wit, E. et al. CTCF binding polarity determines chromatin looping. Mol. Cell60, 676–684 (2015). - PubMed

MeSH terms

LinkOut - more resources