. 2025 Oct;26(10):1781-1793.
doi: 10.1038/s41590-025-02263-y. Epub 2025 Sep 8.

Distinct roles for B cell-derived LTα3 and LTα1β2 in TNF-mediated ileitis

Affiliations

Distinct roles for B cell-derived LTα3 and LTα1β2 in TNF-mediated ileitis

Emma C Erlich et al. Nat Immunol. 2025 Oct.

Abstract

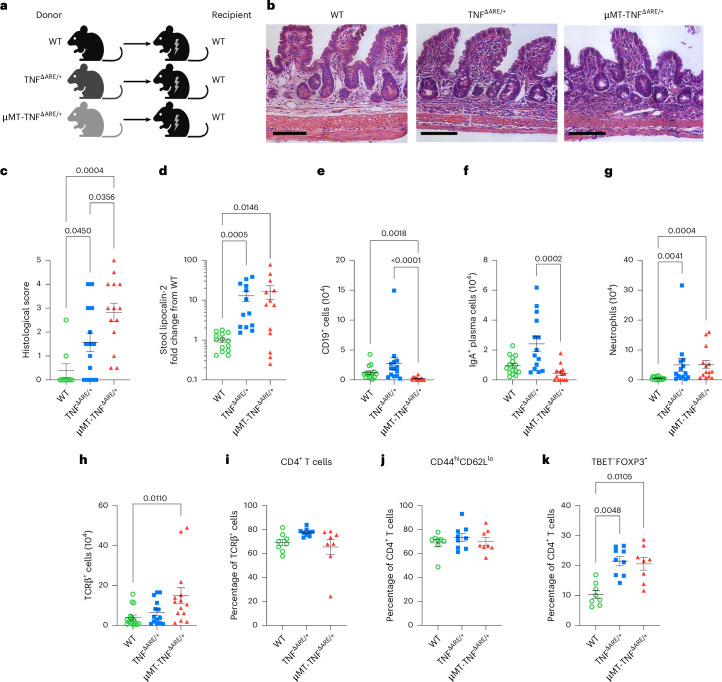
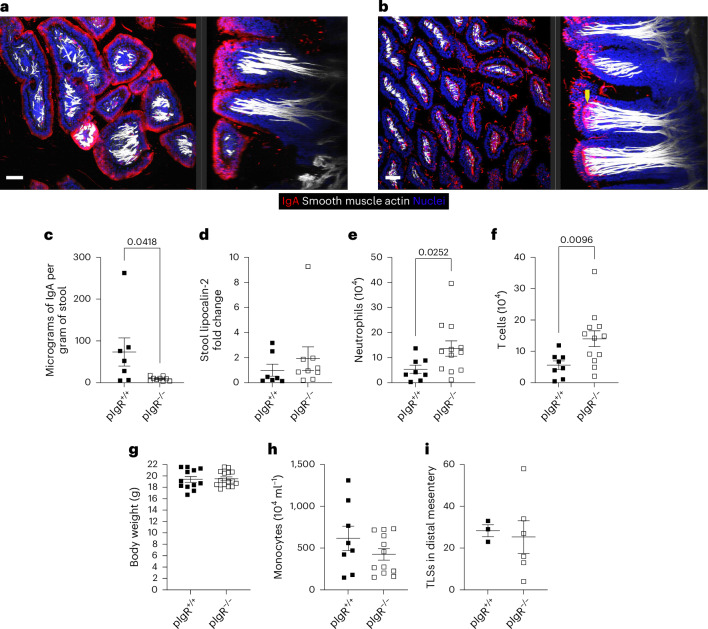
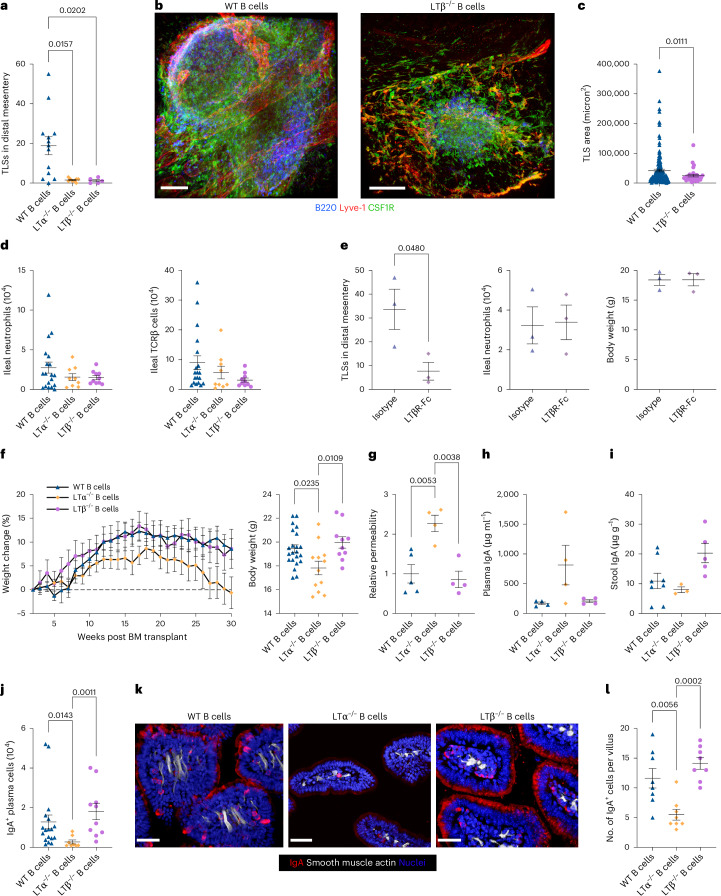
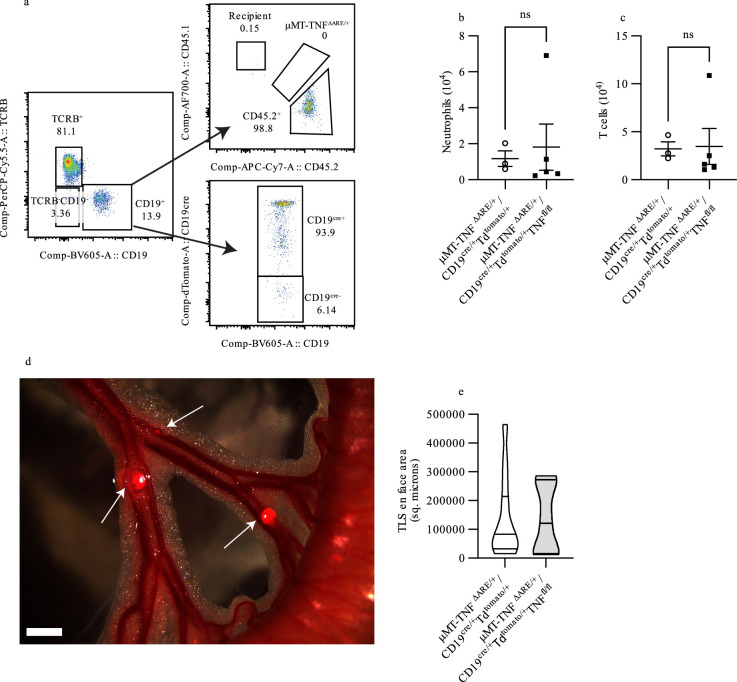
Crohn's disease pathology is modeled in TNFΔARE+/- mice that overproduce tumor necrosis factor (TNF) to drive disease through TNF receptors. An alternative ligand for TNF receptors, soluble LTα3, is produced by B cells, but has received scarce attention because LTα also partners with LTβ to generate membrane-tethered LTαβ2 that promotes tertiary lymphoid tissue-another feature of Crohn's disease. We hypothesized that B cell-derived LTαβ2 would critically affect ileitis in TNFΔARE+/- mice. However, whereas deleting LTβ in B cells was essential for tertiary lymphoid tissue, disease pathology was minimally affected. By contrast, loss of B cell-derived LTα increased intestinal permeability, shrunk the pool of IgA+ ileal plasma cells, elevated cytokines and prompted weight loss, including loss of muscle mass-a systemic feature of Crohn's disease. Neutralizing antibodies to LTα3 strongly augmented the cachexic-like effects of TNF. Thus, B cell-produced LTαβ2 and LTα3 have distinct roles in ileitis, with the role of LTα3 unexpectedly protective through counterbalancing TNF.


Conflict of interest statement

Competing interests: G.J.R. and R.S.C. receive royalties from the ADAPT-3D method for whole-mount imaging used in this study. The other authors declare no competing interests.

Figures

Fig. 1
Fig. 1. TNFΔARE/+ mice without B cells develop ileitis.
WT, TNFΔARE/+ and μMT-TNFΔARE/+ BM chimeras were analyzed 16–17 weeks post-BMT. a, Schema describing BM chimera groups. b, Representative hematoxylin and eosin staining of the distal ileum of mice given WT, TNFΔARE/+ and B cell-deficient μMT-TNFΔARE/+ BM. Scale bars: 150 μm. c, Semiquantitative histological scoring on the distal ileum of BM chimera recipients (three independent experiments (WT (n = 9), TNFΔARE/+ and μMT-TNFΔARE/+ (n = 14)). d, Fold change in the amount of lipocalin-2 in the stool of mice normalized to the average amount per WT group per experiment (three independent experiments, WT (n = 14), TNFΔARE/+ and μMT-TNFΔARE/+ (n = 13)). ek, Flow cytometry on single-cell suspensions of ileum to analyze the numbers and proportions of various immune cells including numbers of CD19+ cells (e), IgA+ plasma cells (f), neutrophils (g) and T cells (h), or the proportion of total CD4+ T cells (i), effector memory CD4+ T cells (j) or regulatory CD4+ T cells (k) (three independent experiments, WT (n = 15), TNFΔARE/+ and μMT-TNFΔARE/+ (n = 14)). Gating strategies for flow cytometry shown in Supplementary Figs. 1 and 3. All dataplots show mean ± s.e.m. Each symbol represents one mouse. One-way ANOVA with post hoc Tukey test (c), Kruskal–Wallis test with Dunn’s correction (dk). Source data
Fig. 2
Fig. 2. B cell-rich TLSs associate with ileitis-associated lymphatic transport blockade but not myeloid cell accumulation in the mesentery.
WT, TNFΔARE/+ and μMT-TNFΔARE/+ BM chimeras 16–17 weeks post-BMT were studied. ac, Representative whole-mount images (LYVE-1 red, CSF1R green, B220 blue) staining mice that received WT (a), TNFΔARE/+ (b) or μMT-TNFΔARE/+ (c) BM. Scale bars: 500 μm. d,e, The number of Ly6G+ neutrophils (d) and CD64+ MHCII+ macrophages (e) in the mesentery of TNFΔARE/+ and μMT-TNFΔARE/+ BM chimeric mice (three independent experiments, WT and TNFΔARE/+ (n = 14) and μMT-TNFΔARE/+ (n = 13)). fh, Representative stereoscope images (left, brightfield and FITC channels; right, FITC channel alone) of the mesentery of anesthetized mice after FITC–dextran injection of 1–1.5 μl into the most distal Peyer’s patch. Mice given WT (f), TNFΔARE/+ (g) and μMT-TNFΔARE/+ (h) BM. Scale bars: 1.5 mm. i, Quantification of time to MLN in tracer experiments (three independent experiments, WT (n = 4), TNFΔARE/+ (n = 6) and μMT-TNFΔARE/+ (n = 4)). jl, Number of TCRβ+ T cells (j), CD19+ B cells (k) and IgA+ plasma cells (l) in the mesentery of TNFΔARE/+ and μMT-TNFΔARE/+ BM chimeric mice (three independent experiments, WT and TNFΔARE/+ (n = 14) and μMT-TNFΔARE/+ (n = 13)). Gating strategy for flow cytometry shown in Supplementary Fig. 1. All dataplots show mean ± s.e.m. Each symbol represents one mouse; Kruskal–Wallis test with Dunn’s correction for d, e and il. Source data
Fig. 3
Fig. 3. B cells sustain retention of lean mass in mice given TNFΔARE/+ BM.
a, Weekly percent weight change in mice given WT, μMT, TNFΔARE/+ or μMT-TNFΔARE/+ BM normalized to weight 2 weeks post-BMT (six independent experiments, WT (n = 24), μMT (n = 9), TNFΔARE/+ (n = 22), μMT-TNFΔARE/+ (n = 23)). bf, Mice given WT, TNFΔARE/+ and μMT-TNFΔARE/+ BMT after 14 weeks (three independent experiments, WT and TNFΔARE/+ (n = 14) and μMT-TNFΔARE/+ (n = 13)). b, EchoMRI evaluation of the body composition of mice given WT, TNFΔARE/+ or μMT-TNFΔARE/+ BM. c, Core body temperature of mice given WT, TNFΔARE/+ or μMT-TNFΔARE/+ BM. df, Mice were housed in metabolic cages for 24 h, and activity (d), heat (e) and food intake (f) were measured. g, Weight of the gastrocnemius muscle in BM recipients (three independent experiments, WT (n = 13), TNFΔARE/+ (n = 14) and μMT-TNFΔARE/+ (n = 12)). h, Micro-CT analysis of paws of the bone mineral density (three independent experiments WT and μMT-TNFΔARE/+ (n = 14), TNFΔARE/+ (n = 13)). All data represent mean ± s.e.m. One-way ANOVA with post hoc Tukey test in c, g and h; two-way ANOVA (to test whether light versus dark is different in addition to whether there are group differences) in df. Source data
Fig. 4
Fig. 4. Secretory antibody partially protects against ileal inflammation in TNFΔARE/+ BM recipients, but this protection is limited only to the ileum.
All panels show lethally irradiated Pigr−/− mice or Pigr+/+ mice given TNFΔARE/+ BMT for 16 weeks. a,b, Visualization of two projections (left, en face; right, cross-sectional) of a 3D rendering of ileum after whole-mount staining for IgA (red), smooth-muscle actin (white) and DAPI to identify nuclei (blue). a, Representative Pigr+/+ recipient mouse given TNFΔARE/+ BM. b, Representative Pigr−/− recipient mouse given TNFΔARE/+ BM; yellow arrow, abluminal accumulation of IgA in the Pigr−/− recipient. Scale bars: 100 μm. c, Micrograms of IgA per gram of stool in Pigr−/− versus Pigr+/+ recipients given TNFΔARE/+ BM. d, Fecal lipocalin-2 levels normalized to the average fecal lipocalin-2 amount in the Pigr+/+ TNFΔARE/+ BM controls per experiment. (two independent experiments, Pigr+/+ (n = 7), Pigr+/+ (n = 9). e,f, Flow cytometry on the ileum shows numbers of neutrophils (e) and T cells (f) (three independent experiments, Pigr+/+ (n = 8), Pigr−/− (n = 12)). g, Total body weight (four independent experiments, Pigr+/+ (n = 12), Pigr−/− (n = 15)). h, Number of monocytes in the blood (three independent experiments, Pigr+/+ (n = 8), Pigr−/− (n = 12)). i, Number of TLSs along the most distal branch of the mesentery (one experiment, Pigr+/+ (n = 3), Pigr−/− (n = 6)). Gating strategy for flow cytometry in Supplementary Figs. 1 and 2. All data in ci show one mouse per symbol and depict mean ± s.e.m. Two-tailed Mann–Whitney test for all panels. Source data
Fig. 5
Fig. 5. Impact on local and systemic effects on ileitis of deleting Lta or Ltb in B cells.
Chimeras were studied at 30–32 weeks after BMT, wherein WT recipient mice received μMT-TNFΔARE/+ BM at 90% and 10% marrow from WT, Lta−/− or Ltb−/− mice to resupply the B cell compartment with these respective genotypes. a, Quantification of the number of TLSs in the branch of the mesentery that drains the distal ileum in these chimeras where B cells were WT, Lta−/− or Ltb−/−. Three independent experiments, WT B cells (n = 13), Lta−/− B cells (n = 8) and Ltb−/− B cells (n = 5). Statistical significance was evaluated using Kruskal–Wallis test. b, Representative whole-mount images (LYVE-1 red, CSFR1 green, B220 blue) of lymphoid aggregates in the ileal associated mesentery of WT/μMT-TNFΔARE/+ or Ltb−/−/μMT-TNFΔARE/+ chimeric mice. Scale bar: 500 μm. c, TLS area was assessed in whole-mount images and the area of each TLS quantified depicted in the graph, with each symbol representing one TLS from WT/μMT-TNFΔARE/+ (n = 4 mice evaluated) or Ltb−/−/μMT-TNFΔARE/+ (n = 5 mice evaluated) chimeric mice. Statistical significance used unpaired t test with Welch’s correction for nonparametric distribution. d, Flow cytometry on single-cell suspensions of the distal ileum of mice that received WT/μMT-TNFΔARE/+, Lta−/−/μMT-TNFΔARE/+ or Ltb−/−/μMT-TNFΔARE/+ BM to quantify neutrophils and T cells. Four independent experiments were done, WT/μMT-TNFΔARE/+ (n = 19), Lta−/−/μMT-TNFΔARE/+ (n = 9), Ltb−/−/μMT-TNFΔARE/+ (n = 10). e, Eight weeks after TNFΔARE/+ BMT, mice were dosed weekly with isotype control or LTβR-Fc for an additional 8 weeks in one experiment, isotype and LTβR-Fc (n = 3 mice in each cohort). TLSs were quantified in TNFΔARE/+ BM recipients given LTβR-Fc in the distal mesentery or isotype control. Flow cytometry on the ileum of mice given TNFΔARE/+ BM and treated with LTβR-Fc or isotype control to quantify neutrophils. f, Weekly percent weight change in μMT-TNFΔARE/+ BM chimeras that had WT (n = 13), LTα−/− (n = 12) or LTβ−/− (n = 10) B cells. Data are normalized to mouse weight 2 weeks post-BMT. Statistical analysis was carried out using two-way ANOVA with Tukey’s multiple comparisons post hoc test. Actual body weights at the endpoint are graphed separately on the right, with statistical analysis carried out using one-way ANOVA, with Tukey’s test for multiple comparisons. g, Relative intestinal permeability to FITC–dextran administered by gavage and assessed 2 h later (two independent experiments, WT B cells (n = 5), Lta−/− B cells and Ltb−/− B cells (n = 5)). h,i, Plasma (h) and fecal (i) IgA levels measured on mice given WT BM or mice lacking Lta−/− or Ltb−/− (two independent experiments, WT B cells (n = 8), Lta−/− B cells (n = 4), Ltb−/− B cells (n = 5)). j, Flow cytometry on single cell-digests of the ileum to quantify IgA+ plasma cells from the same mice used to generate data in d. k,l, Representative images of the mid-villus region in the ileum viewed in whole-mount specimens from en face after staining for IgA (red), smooth-muscle actin (white) and DAPI to identify nuclei (blue) (k) and quantification of their frequency (l). Two independent experiments, WT B cells (n = 5), Lta−/− B cells and Ltb−/− B cells (n = 5). Statistical comparisons used one-way ANOVA with Tukeyʼs test for multiple comparisons. Gating strategy for flow cytometry shown in Supplementary Fig. 1. Graphic plots show one mouse per symbol and depict mean ± s.e.m. Source data
Fig. 6
Fig. 6. Neutralizing LTα3 promotes weight loss in mice with elevated TNF.
ae, Percent weight change (a) or quantification of cytokines (be) including TNF (b), LTα (c), IL-33 (d) and IL-1β (e) of mice comparing day 0 to day 2 in mice transplanted with WT or TNFΔARE/+ BM 9 weeks post-BMT, then dosed with anti-LTα3 antibody or only isotype. f, Percent weight change, comparing day 0 to day 2 in mice transplanted with WT or TNFΔARE/+ BM 9 weeks post-BMT, then dosed with anti-LTα3 antibody, anti-TNF antibody, both or isotype only. g–i, Hydration analysis (g), activity (h) and food intake in the same mice on day 3 (i) dosed again on day 2 after weight assessment were made. j, MRI measurements of body fat composition were also made on these mice on day 3. k, Weights of the gastrocnemius muscle on day 5—the experimental endpoint. gi, All plots depict mean ± s.e.m. One symbol represents data from one individual mouse. Three independent experiments for a, n = 10 for WT mice and n = 13 for TNFΔARE/+ BM recipients. Two independent experiments for bk, n = 8 per group. Two-way ANOVA with post hoc Tukey test was used for ae, h and i to determine whether there was a difference between WT and TNFΔARE/+ mice as well as between isotype and anti-LTα3 treated mice. A one-way ANOVA with post hoc Tukey test was used for f, g, j and k. In all graphs except for c, the P value depicts the results of the post hoc test; in c, the P value shown is the difference between all WT mice and all TNFΔARE/+ BM recipients. Source data
Fig. 7
Fig. 7. Roles of LTα3 and TNF in sustaining B cells in ileitis.
a, scRNA-seq of sorted live, CD45+ mesenteric cells from three patients with CD with matched noninflamed and inflamed draining mesenteric samples. The dotplot depicts average expression of genes in the TNF/LTα/LTβ family along with their receptors. A UMAP plot of mesenteric immune cells is depicted in Extended Data Fig. 5b,c. b, Distribution of TNF+CD45+ cells analyzed with no ex vivo stimulation after staining permeabilized cells in cell suspensions of the ileum, mesentery or draining mLN of BM chimeric mice for TNF. TNF+ cells were gated and then divided into cell types that were TNF+ to assess proportional contribution of each population to the fraction of TNF+ cells in the tissue. This does not account for amount of TNF produced per cell or the possibility that some TNF is secreted and some is membrane-anchored. The same three mice were studied across the different tissue sites. c,d, UMAP projections of scRNA-seq on mLN cells that had migrated from the ileum in the previous 20 h. Feature plots (c) depict key genes identifying T cells (Cd3e), B cells (Ighd), DCs (Fscn1) and expression patterns of Tnf, Lta and Ltb. Cluster names assigned on the basis of marker genes are labeled in d, with distinct UMAP projections depicting profiles obtained in WT or TNFΔARE/+ chimeras treated with WT or anti-LTα3 neutralizing mAb. e, Dotplot depicting average expression of genes in the TNF/LTα/LTβ family along with their receptors and other genes that were impacted by anti-LTα3 treatment in either of the two B cell clusters or in CD4+ T cells. fi, Mixed BM chimeras wherein WT recipient mice received μMT-TNFΔARE/+ BM at 90% and 10% marrow from CD19Cre/+ × Tdtomatofl/fl mice or CD19Cre/+ × TNFfl/fl × Tdtomatofl/fl mice to resupply the B cell compartment with these respective genotypes and to mark CD19Cre active cells with TdTomato expression. f, Percentage of CD19+ B cells in the blood 10 weeks after BMT to assess CD45.2+ donor engraftment. g, Weekly percent weight change in chimeras that had received μMT-TNFΔARE/+/CD19cre/+Tdtomato/+ mixed BM (n = 5) or μMT-TNFΔARE/+/CD19cre/+Tdtomato/+TNFfl/fl (n = 5) B cells. Data were normalized to mouse weight 2 weeks post-BMT. Statistical analysis was carried out using two-way ANOVA with Tukey’s multiple comparisons post hoc test, showing that the curves were not statistically distinct. h,i, Percentage of CD19+ in the blood (h) or ileum (i) that were Tdtomato+ 32 weeks after BMT (one experiment μMT-TNFΔARE/+/CD19cre/+Tdtomato/+ (n = 5 at 10 weeks, n = 3 at 32 weeks), μMT-TNFΔARE/+/CD19cre/+Tdtomato/+TNFfl/fl (n = 5)). Flow cytometry gating strategies in Supplementary Figs. 1, 2 and 5. Graphs depict mean ± s.e.m. Two-tailed Mann–Whitney test was applied for statistical analyses in f, h and i. Source data
Extended Data Fig. 1
Extended Data Fig. 1. Quantification of cell types in mouse blood or regions of the small intestine.
a: Number of B cells in the blood by flow cytometry (four independent experiments, WT (n = 19), TNFΔARE/+ (n = 18), μMT-TNFΔARE/+ (n = 17)) b: Donor (CD45.2)+IgA+ plasma cells in the ileum by flow cytometry (three independent experiments, WT (n = 15), TNFΔARE/+ and μMT-TNFΔARE/+ (n = 14)). c: Percentages of FoxP3+RORγτ+ T regulatory cells. d: Number of neutrophils in the duodenum and jejunum by flow cytometry (2 independent experiments, WT and TNFΔARE/+ (n = 10) μMT-TNFΔARE/+ (n = 9)). e-g: Number of neutrophils (e) and monocytes (f) in the blood by flow cytometry (Four independent experiments, WT (n = 19), TNFΔARE/+ (n = 18) μMT-TNFΔARE/+ (n = 17)). g: Percentage of monocytes that are Ly6Chi in the blood (Three independent experiments, WT and TNFΔARE/+ (n = 14), μMT-TNFΔARE/+ (n = 12). Gating strategies for flow cytometry shown are in Supplementary Figs. 1–3. Kruskal-Wallis test on all with correction for multiple comparisons using Dunn’s test. All data depicted show mean ± SEM. Each symbol represents a single mouse. Source data
Extended Data Fig. 2
Extended Data Fig. 2. B cells protect against weight loss in TNFΔARE/+ mice.
a-g: WT, TNFΔARE/+, and μMT-TNFΔARE/+ BM recipients 14 weeks post-transplant. a: Body weight of the mice at week 14. Mice were housed in metabolic cages for 24 h and scatterplots show energy expenditure (b), food intake (c), and water intake (d,e), quantified in the metabolic cages (d), and charted against body weight (e). Hydration ratio of the mice, measured by MRI, calculated as (total water - free water) / lean weight. f,g: Paws collected from WT, TNFΔARE/+, and μMT-TNFΔARE/+ BM recipients 16–17 weeks post-transplant showing the percentage of bone volume over total volume (f) and bone surface area over bone volume (g). (Three independent experiments WT and TNFΔARE/+ (n = 14), μMT-TNFΔARE/+ (n = 13)). For a, d-g data represent mean ± SEM. For b,c, lines and shaded areas represent a linear regression model fit per group. Each symbol represents a single mouse. One-way ANOVA with Tukey post-hoc test (a, e-g), Two-way ANOVA on d. Source data
Extended Data Fig. 3
Extended Data Fig. 3. Impact of deleting Lta or Ltb in mixed bone marrow chimeras or reagents targeting LTbR or LTa3 on lymphoid tissue organization.
In Fig. 5, mixed BM chimeras were studied at 30–32 weeks after transplant, wherein WT recipient mice received μMT-TNFΔARE/+ BM at 90% and 10% marrow from WT, Lta−/− or Ltb−/− mice to resupply the B cell compartment with these respective genotypes. a: Vibratome sections of the spleen from these mice were made and immunostained for IgD, CD3, and CD21/CD35 to confirm that B cell deletions of Lta or Ltb altered splenic organization (Two independent experiments, n=2 spleens/group were imaged). b: Similar staining was made on spleen vibratome sections from TNFΔARE/+ mice that were treated with isotype control mAb, anti-LTα3 mAb, or LTβR-Ig for 2 days. Two independent experiments, n=2 spleens/group were imaged.
Extended Data Fig. 4
Extended Data Fig. 4. Analysis of the role of LTα in nutrient absorption.
a: Feces from a 24-h period of housing was collected from cages of mice that were recipients of WT/μMT-TNFΔARE/+ and Lta−/−/μMT-TNFΔARE/+ mixed bone marrow cells (cohort 1) or WT/μMT-TNFΔARE/+ and Ltb−/−/μMT-TNFΔARE/+ mixed bone marrow cells (cohort 2) to generate mice with ileitis with WT, LTα-deficient B cells (LTα−/− B cells), LTβ-deficient B cells (LTβ−/− B cells) with matched WT B cells compared in the respective cohorts. Feces from 4 to 5 mice in each cage were combined in each genotype of each cohort, dried and weighed, and subjected to bomb calorimetry. Data plot a combined value from each cage. b: TNFΔARE/+ mice were split into two cohorts and each was randomly assigned into groups (each 3 or 4 mice) that would receive anti-LTα3 mAb or isotype control. Fecal energy in the groups prior to administration of mAb versus the energy measured in feces over a 48-h treatment span (feces collected at 24 and 48 h in each cage) was assessed by bomb calorimetry. c,d: Plasma triglycerides were assessed after bolus gavage of olive oil in mice that were recipients of WT/μMT and Lta−/−/μMT mixed bone marrow cells (n=8 per group) (c) or in TNFΔARE/+ mice that were treated with anti-LTα3 or isotype control mAb for 2 days (n=4 per isotype, n=3 per anti-LTα3) (d). All mice in panels c and d were treated with poloxamer to inhibit lipolysis of triglycerides in the plasma during the assessment. Plasma measurements were performed as duplicates per mouse and timepoint and averaged together for a single value per mouse and timepoint. In c,d, data depicted show mean of the mouse groups ± SEM and each symbol represents a single time point per group. Source data
Extended Data Fig. 5
Extended Data Fig. 5. Analysis of B cells and other CD45+ mesenteric cells by single cell RNAseq.
a: Graph on the left shows quantification of the number of CD19+ B cells in surgically resected sections of ileal-draining mesentery normalized to the weight of tissue (Control (n = 20), CD non-inflamed (n = 16), CD inflamed (n = 15)). Graph on the right depicts a subset of the data on left to show only CD patients that had matched mesentery draining from non-inflamed ileum and from inflamed ileum, lines connect paired samples from the same patient (n = 13). Gating strategy in Supplementary Fig. 4. Data depict mean ± SEM. Kruskal-Wallis test for graph on left, two-sided paired t test on for the graph on right. b, c: Single cell RNA sequencing (scRNA-seq) of sorted live, CD45+ mesenteric cells from 3 CD patients with matched mesentery draining from inflamed and non-inflamed regions of the ileum. Uniform Manifold Approximation and Projection [UMAP] plot of mesenteric immune cells showing if the cells are derived from inflamed or non-inflamed regions of the mesentery (b) and assigned cell classification of all the different UMAP clusters (c) shown in Fig. 7a. d: Heatmap of genes defining the clusters of CD human mesentery shown in c. e: Heatmap of genes defining the clusters of mouse mLN shown in Fig. 7c–e. f: A correlation scatter plot showing expression of Lta vs Tnf in mouse mLN in B cell cluster 1. Source data
Extended Data Fig. 6
Extended Data Fig. 6. Assessment of the role of B cell-derived TNF in ileitis.
Mixed BM chimeras wherein WT recipient mice received μMT-TNFΔARE/+ BM at 90% and 10% marrow from CD19Cre/+ x Tdtomatofl/fl mice (n = 3) or CD19Cre/+ x TNFfl/fl x Tdtomatofl/fl mice (n = 5) were studied at 32 weeks after BMT to assess the role of B cell-derived TNF on ileitis. a: Flow cytometry gating strategy for TdTomato+ CD19+cells gated otherwise as in Supplementary Figs. 1 and 2. Flow cytometry on single cell suspensions of the distal ileum of these mice compared the two genotypes in impacting neutrophil accumulation (b) or accumulation of T cells (c) which were not statistically significantly different based on a two-sided Mann-Whitney test. d: TLSs were formed in the mesentery of the mice. Stereoscope micrography reveals Tdtomato+ follicles near the vascular and lymphatic tracts. Bright field images were overlaid on fluorescence so that the blood flowing in vessels also appears red and the surrounding mesenteric adipose tissue reflects light. e: Assessment of TLS face area in the two genotypes with measurements made of 26 TLSs from mice bearing WT B cells and measurements from 8 TLSs made from mice with Tnf−/− (TNF KO) B cells. The size of TLSs were not statistically significantly different based on a two-sided Mann-Whitney test to compare them. In b,c, each symbol represents a single mouse and data represent mean ± SEM. Source data
Extended Data Fig. 7
Extended Data Fig. 7. A schematic summary figure.
This figure summarizes findings in this body of work. Figure created with BioRender.com.

Update of

References

    1. Torres, J., Mehandru, S., Colombel, J. F. & Peyrin-Biroulet, L. Crohn’s disease. Lancet389, 1741–1755 (2017). - PubMed
    1. Rogler, G., Singh, A., Kavanaugh, A. & Rubin, D. T. Extraintestinal manifestations of inflammatory bowel disease: current concepts, treatment, and implications for disease management. Gastroenterology161, 1118–1132 (2021). - PMC - PubMed
    1. Crohn, B. B. & Janowitz, H. D. Reflections on regional ileitis, twenty years later. J. Am. Med. Assoc.156, 1221–1225 (1954). - PubMed
    1. Warren, S. & Sommers, S. C. Pathology of regional ileitis and ulcerative colitis. J. Am. Med. Assoc.154, 189–193 (1954). - PubMed
    1. Randolph, G. J. et al. Lymphoid aggregates remodel lymphatic collecting vessels that serve mesenteric lymph nodes in Crohn disease. Am. J. Pathol.186, 3066–3073 (2016). - PMC - PubMed

Substances

Grants and funding