. 2025 Sep 9;10(17):e186984.
doi: 10.1172/jci.insight.186984.

Intestinal epithelial Ceacam1 deficiency prevents steroid-refractory acute gut graft-versus-host disease

Affiliations

Intestinal epithelial Ceacam1 deficiency prevents steroid-refractory acute gut graft-versus-host disease

Qingxiao Song et al. JCI Insight. .

Abstract

Steroid-refractory gut acute graft-versus-host disease (SR-Gut-aGVHD) is the major cause of nonrelapse death after allogeneic hematopoietic cell transplantation. High numbers of donor-type IL-22+ T cells, IL-22-dependent dysbiosis, and loss of antiinflammatory CX3CR1hi mononuclear phagocytes (MNPs) play critical roles in SR-Gut-aGVHD pathogenesis. CEACAM1 on intestinal epithelial cells (IECs) is proposed to regulate bacterial translocation and subsequent immune responses in the intestine. Here, with imaging mass cytometry (IMC), combined scRNA-Seq with ATAC-Seq, and high-dimensional flow cytometry analysis, we show that CEACAM1 expression was enhanced on IECs in murine and human SR-Gut-aGVHD. Ceacam1 deficiency on host IECs effectively prevented SR-Gut-aGVHD in murine models. Ceacam1 deficiency on IECs resulted in (i) higher numbers of IL-22+IL-10+Foxp3+CD4+ peripheral Tregs (pTregs) and lower numbers of conventional IL-22+CD4+ T (Tcon), Th/Tc1, and Th17 cells in the intestine; (ii) higher prevalence of beneficial commensal bacteria that augment colonic pTreg expansion, with lower prevalence of pathogenic bacteria; and (iii) higher numbers of antiinflammatory CD103-CX3CR1hi MNPs that produce indoleamine 2,3-dioxygenase (IDO) and IL-10, with lower numbers of proinflammatory CD103+CX3CR1lo MNPs that produce IL-6. Thus, specifically targeting IEC CEACAM1 represents a promising approach for prevention of SR-Gut-aGVHD.

Keywords: Bone marrow transplantation; Cellular immune response; Hematology; Immunology; Mouse models; Transplantation.


Conflict of interest statement

Conflict of interest: The authors have declared that no conflict of interest exists.

Figures

Figure 1
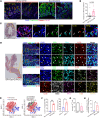
Figure 1. Colonic epithelial expression of CEACAM1 and infiltration of IL-22+IFN-γ+ T cells are enhanced in patients with SR-Gut-GVHD.
Using H&E staining and image mass cytometry (IMC), we evaluated the severity of tissue damage indicated by immune cell infiltration and CEACAM1 expression on epithelial cells in colon biopsies from SR-Gut-GVHD (n = 3) and Non–SR-GVHD patients (n = 3). The IMC scan was based on 1 µm per pixel. The H&E overview was acquired withZEISS ZEN Tile Scan, and the magnification of the indicated regions are shown with yellow boxes (scale bars) on the right. (A) Representative IMC staining patterns of CEACAM1, Ki-67, and E-cadherin in patient colon biopsy samples. Scale bar: 200 μm. (B) Percentage of CEACAM1+Ki-67+E-cadherin+ cells among total MNCs. The P value is shown. (C) Representative IMC staining pattern of colon biopsy from a non-SR-Gut-GVHD patient. The panel shows staining for DAPI (blue), CD3 (green), CD8α (cyan), and IL-22 (red). White arrows indicate representative CD8+ T cells. (D) Representative IMC staining patterns for analysis of IL-22+CD4+ and IL-22+CD8+T cells in a colon biopsy sample from a patient with SR-Gut-GVHD. The arrows in the upper rows of the two arrays of panels indicate representative IL-22+CD4+ or IL-22+CD8+ T cells. The lower rows provide a more detailed analysis of T cell subsets from the same patient. The white arrows indicate IL-22+CD8+ T cells with expression of Ahr, IFN-γ, T-bet, or IL-17A, while the green arrows indicate CD4+ T cells with or without expression of Ahr, IFN-γ, T-bet, or IL-17A. (32. AUTHOR: Please edit to specify the total magnifications for the images in C and D.) (E) General cellular distribution in the t-distributed stochastic neighbor embedding (t-SNE) map of all MNCs (left panel) and IL-22+CD4+ and IL-22+CD8+ T cells (right panel). (F) Percentages of IL-22+ T cells among total MNCs (left panel), CD4+ and CD8+ T among IL-22+ T cells in SR-Gut-GVHD, and non-SR-Gut-GVHD tissues. (G) Percentages of Ahr+ and T-bet+ cells among IL-22+ T cells. (H) Percentages of IFN-γ+IL-17A+Ahr+T-bet+IL-22+ T cells among total MNCs. P values were calculated by unpaired 2-tailed Student’s t tests (B, F-H). *P < 0.05; ***P < 0.001.
Figure 2
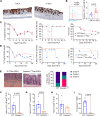
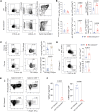
Figure 2. Host Ceacam1 deficiency ameliorates SR-Gut-aGVHD but not untreated GVHD.
(A and B) BALB/c recipients received T cell–depleted BM (TCD-BM) with or without splenocytes from WT C57BL/6 donors. Recipients of TCD-BM and splenocytes received 1 or 4 DEX injections after HCT. Colon epithelial CEACAM1 expression was analyzed on day 25 by IHC and flow cytometry. (A) Representative images. One representative micrographic photo (original magnification, ×100) is shown of 4 replicate mice in each group. (B) MFI of CEACAM1. n = 5–6 combined from 2 replicate experiments. (C) WT (WT Rec) or Ceacam1–/– BALB/c (Ceacam1–/– Rec) recipients received WT C57BL/6 splenocytes and TCD-BM (untreated GVHD). Original body weight, mice without diarrhea, and survival are shown as percentages. n = 15 from 2 replicate experiments. (D) Experimental conditions as in C, except that recipients received 4-DEX injection (SR-Gut-aGVHD). n = 10 from 2 replicate experiments. (E) Colon histopathology was evaluated on day 25. Representative micrographic photos (original magnification, ×200) and percentage of mice with indicated histopathological scores. n = 4/group from 2 replicate experiments. (F) Mean ± SEM of yield of CD11b+Ly6G+ cells. (G) Means ± SEM of yield of H2Kb+TCRβ+CD4+ T cell. n = 4 mice/group from 2 experiments. (H) Means ± SEM of %CEACAM1+H2Kb cells. (I) IHC staining of CEACAM1 (purple), CD11b (yellow) and CD3 (teal) in colon on day 25. Representative photomicrographs (original magnification, x100) are shown. The P value is shown in B, F, G, and I. Nonlinear regression (curve fit) was used for body weight comparisons. Log-rank test was used for survival comparisons. B and FI: unpaired 2-tailed Student’s t test).
Figure 3
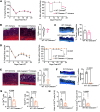
Figure 3. SR-Gut-aGVHD is ameliorated by Ceacam1 deficiency on host IECs but not on hematopoietic cells.
(AC) WT BALB/c recipients received TCD-BM from WT or Ceacam1–/– BALB/c donors to generate the chimeras. Two months after bone marrow reconstitution, WT or HC-Ceacam1–/– chimeras were lethally irradiated and engrafted with splenocytes and TCD-BM from WT C57BL/6 donors, and the recipients were given 4-DEX treatment. (A) Original body weight and mice without diarrhea are shown as percentages. n = 18 (WT chimeras), 15 (host HC-Ceacam1–/– chimeras) from 2 replicate experiments. (B) Histopathology of colon on day 25. Representative photomicrographs (original magnification, ×200) and percentage of mice with indicated histopathological scores. n = 6 (WT), n = 8 (HC-Ceacam1–/–), from 2 replicate experiments. (C) IHC staining of CEACAM1 (purple), CD11b (yellow) and CD3 (teal) on colon day 25 after HCT. Representative photomicrographs (original magnification, ×100). Mean ± SEM percentage of CEACAM1+ area relative to the whole slide. (DH) WT and Ceacam1–/– BALB/c recipients received TCD-BM from WT BALB/c donors to generate chimeras. Then the irradiated WT or IEC-Ceacam1–/– chimeras received splenocytes and TCD-BM from WT C57BL/6 donors. (D) Original body weight and mice without diarrhea are shown as percentages. n = 18 (WT), 15 (IEC-Ceacam1–/–), from 2 replicate experiments. (E) Histopathology of colon on day 25. Representative photomicrographs (original magnification, ×200) and percentage of mice with indicated histopathological scores. n = 4 (WT), 5 (IEC-Ceacam1–/–), from 2 replicate experiments. (F) IHC staining of CEACAM1 (purple), CD11b (yellow), and CD3 (teal) on colon on day 25. Representative photomicrographs (original magnification, ×100). Mean ± SEM percentage of CEACAM1+ area relative to the whole slides. (G and H) Mean ± SEM percentage (G) and yield of CD4+ and CD8+ T cells (H) in colon intraepithelial tissue. P values are shown in EH. D: nonlinear regression, curve fit; EH; unpaired 2-tailed Student’s t test.
Figure 4
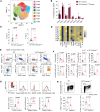
Figure 4. Amelioration of SR-Gut-aGVHD by Ceacam1 deficiency in IECs is associated with distinct CD4+ Tcon cells and pTreg subsets and gene signaling pathways in MLN cells.
WT and IEC-Ceacam1–/– (CC1–/–) chimeras were engrafted with donor cells and treated with 4-DEX as described for Figure 3. On day 25, CD4+ T cells from MLNs of WT or IEC-CC1–/– recipients were sorted for scRNA plus ATAC sequencing. (A) Subclustering t-SNE of all CD4+ T cells. The 15 clusters are indicated. (B) t-SNE plot of cell cycle. (C) Comparison of percentage of individual cluster of cell cycle. (D) Dot plot of immunomodulatory genes across all clusters. (E) Heatmap showing the differential transcription factor motif accessibility. (F) t-SNE showing the lineage trajectory ordered from naive cells to Tregs (cluster 14) or effector T cells (other clusters). The diagram shows changes in CD4+ T clusters in Ceacam1–/– chimeras compared with WT chimeras. ↑, increase; ↓, decrease; C1, naive T cells; C3, cycling CD4+ T cells (Ceacam1–/– chimera only); C5, G1 resting Th17; C7, Th1-, Th2-, Th17-, and Th22-like; C8, Th2; C11, G2M/S proliferating Th17; C12, anergic Th1; C13, Th1; C14, pTregs. (G) Comparison of percentages of individual clusters. (H) Bubble plot showing enriched KEGG, REACTOME, and HALLMARK signature pathways by comparing IEC-CC1–/– and WT. (I) Dot plot of immunomodulatory genes of clusters 5, 12, and 14, comparing IEC-CC1–/– and WT. (J and K) GSEA plot of HALLMARK apoptotic pathway (J) and BP_GO oxidative phosphorylation pathway (K) of cluster 14 by comparing IEC-CC1–/– recipients with WT recipients. abs(NES), absolute value of normalized enrichment score.
Figure 5
Figure 5. Amelioration of SR-Gut-aGVHD by Ceacam1 deficiency in the host is associated with a reduction in IL-22+CD4+ Tcon cells but expansion of IL-22+IL-10+CD4+ pTregs in the MLN.
WT and IEC-Ceacam1–/– chimeras were engrafted with splenocytes together with TCD-BM from WT C57BL/6 donors and induced to develop SR-Gut-GVHD, as described for Figure 2. On day 25, T cell subset in MLNs from WT or IEC-Ceacam1–/– recipients were analyzed. (A) UMAP plot generated from IL-22+IL17ACD4+ (Th22) cells in MLNs of both WT and IEC-Ceacam1–/– chimeras. (B) Mean ± SEM percentages of individual populations. (C) Mean ± SEM percentages of populations 4 and 5 (Pop4 and Pop5). (D) Heatmap plot of IFN-γ, CD127, T-bet, GM-CSF, AHR, IL-2, CCR6, FoxP3, PD-1, IL-17A, RORγt, CEACAM1, and IL-10 expression. (E) Representative flow cytometry pattern and gating strategy of FoxP3, AHR, RORγt and IL-10 in Th22 cells. (F) Mean ± SEM percentage of FoxP3AHR+, FoxP3RORγt+, and FoxP3+RORγt subsets in Th22 cells and of IL10+ in Foxp3+RORγt Th22 cells; and yields of the respective subsets. (G) Representative flow cytometry pattern and gating strategy for PD-1, CCR6, and T-bet in FoxP3+RORγt and Foxp3RORγt+ Th22 subsets. (H) Representative flow cytometry patterns and mean ± SEM percentage of T-bet+IFN-γ+ subset in CD4+ T cells and yields in WT and IEC-Ceacam1–/– chimeras. n = 10 (WT), n = 8 (IEC-Ceacam1–/–), from 2 replicate experiments. P values are shown in C and EH. C and FH: Unpaired 2-tailed Student’s t test.
Figure 6
Figure 6. Amelioration of SR-Gut-aGVHD by Ceacam1 deficiency specifically in host IECs validates results with WT and IEC-Ceacam1–/– chimeras, showing lower numbers of pathogenic IL-22+CD4+ Tcon cells but higher numbers of IL-22+IL-10+CD4+ pTregs in the MLN.
VillinCre-positive Ceacam1fl/fl and VillinCre-negative Ceacam1fl/fl recipients were engrafted with splenocytes together with TCD-BM from CD45.1 BALB/c donors and injected with 4-DEX. On day 21, T cell subsets in MLN from Cre-pos or Cre-neg recipients were analyzed. (A) Representative flow cytometry pattern and gating strategy of FoxP3, AHR, RORγt, and IL-10 expression in Th22 cells. (B and C) Mean ± SEM percentage (B) and yield (C) of FoxP3AHR+, FoxP3RORγt+, FoxP3+RORγt, and IL10+Foxp3+ Th22 subsets. (D) Mean ± SEM percentage of T-bet+IFN-γ+ in CD4+ T cells and yield of T-bet+IFN-γ+ CD4+ T cells. (E) Representative flow cytometry pattern and mean ± SEM percentage of RORγt+IL-17A+ in CD4+ T cells and yield of RORγt+IL-17A+ CD4+ T cells. n = 4, from 2 replicate experiments. P values are shown in B, C, and E. BE: Unpaired 2-tailed Student’s t test.
Figure 7
Figure 7. Amelioration of SR-Gut-aGVHD by intestinal epithelial Ceacam1 deficiency is associated with enrichment of IL-22+ pTregs cells among intestinal intraepithelial lymphocytes.
WT and IEC-Ceacam1–/– chimeras were engrafted with splenocytes together with TCD-BM from WT C57BL/6 donors as described for Figure 2. (A, B, and DF) VillinCre-pos-Ceacam1fl/fl and VillinCre-neg-Ceacam1fl/fl recipients were engrafted with splenocytes together with TCD-BM from CD45.1 BALB/c donors and injected with 4-DEX. (A) Representative flow cytometry patterns and gating strategy of IL-22+Foxp3+IL-10+NRP-1HeliosCD4+ T cells. (B) Mean ± SEM percentages and yields of %IL22+IL-17A, IL-22+FoxP3+IL-10+, and IL-22+FoxP3+IL-10+NRP-1Helios cells in the colonic epithelium. n = 7 (WT), 6 (IEC-Ceacam1–/–). (C) Representative flow cytometry patterns and mean ± SEM percentages and yields of FoxP3+IL-22+IL-17ACD4+ T cells in colon intraepithelial tissue. n = 7–9. (D) Representative flow cytometry patterns; mean ± SEM percentages and yields of FoxP3+IL-22 and FoxP3IL-22+ cells in the colonic lamina propria. n = 4. (E and F) Representative flow cytometry patterns;mean ± SEM percentages and yields of T-bet+IFN-γ+ cells among CD4+ and CD8+ T cells in the colonic lamina propria. n = 4. Combined from 2 replicate experiments. P values are shown in BD and F. Unpaired 2-tailed Student’s t test was used to compare 2 means.
Figure 8
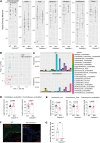
Figure 8. Amelioration of SR-Gut-aGVHD by Ceacam1 deficiency in IECs is associated with favorable changes in microbiota frequencies.
WT and IEC-Ceacam1–/– chimeras were engrafted with splenocytes and TCD-BM from WT C57BL/6 donors as described for Figure 2. (A) Mean ± SEM percentages of the diversity of ileal flora. (B) PCoA of the ileal flora. (C) The top 20 bacterial compositions at the species level. (D and E) Mean ± SEM percentages of log2-transformed normalized counts of Clostridiales_unclassified and Prevotellaceae_unclassified (D) and Escherichia_coli, Enterococcus_hirae, and Enterococcus_unclassified (E). (F) IF staining for CEACAM1 (green) and E. coli–LPS (red) in the colon. One representative photomicrograph (scale bars: 20 μm) is shown of 4 mice for each group. (G) Counting of LPS+ bacteria was performed manually using Fiji (ImageJ). LPS+ bacteria in 3 areas/mouse were evaluated. Statistical comparison of 4 mice/group. n = 11–17 from 3 experiments (AE). P values are shown in D, E and G. D and G: P values were calculated by unpaired 2-tailed Student t tests; *P < 0.05, **P < 0.01, ***P < 0.001; E: Mann-Whitney U test.
Figure 9
Figure 9. Amelioration of SR-Gut-aGVHD by Ceacam1 deficiency in IECs is associated with higher numbers of antiinflammatory CD103CX3CR1hi MNPs and lower numbers of proinflammatory CD103+CX3CR1lo MNPs in the colon.
Lethally irradiated WT and IEC-Ceacam1–/– chimeric recipients were engrafted with splenocytes and TCD-BM from WT C57BL/6 donors as described for Figure 2. On day 25, CD103+CX3CR1lo and CD103CX3CR1hi MNPs in the colons were analyzed, and cytokines were measured in homogenized colon tissue. (A) Representative flow cytometry pattern and gating strategy for CD103+CX3CR1lo and CD103CX3CR1hi MNP. (B) Plots of mean ± SEM of %CD103+CX3CR1lo and CD103CX3CR1hi MNPs among MNCs and their respective yields. n = 6–7. (C) Representative flow cytometry pattern and gating strategy showing IDO+IL-10+ population in CD103+CX3CR1lo and CD103CX3CR1hi MNP. (D) Percentages of CD103+CX3CR1lo and CD103CX3CR1hi MNPs expressing both IL-10 and IDO. Data are presented as mean ± SEM; n = 6–7. (E and F) Representative flow cytometry patterns and percentages of IL-6 in CD103+CX3CR1lo and CD103CX3CR1hi MNPs. Data are presented as mean ± SEM; n = 13. Comp, compensation. (G) Concentration of active TGF-β, IFN-γ, IL-6, TNF, and IL-2 in colon tissue homogenate. n = 3–4. (H and I) Representative flow cytometry patterns and percentages of IL-2+CD4+ T cells. n = 12–16. Combined from 2 experiments. P values are shown in B, D, F, G, and I. Unpaired 2-tailed Student’s t test was used to compare 2 means in B, F, and I. Two-way ANOVA was used to compare means in D and G.

References

    1. Martin PJ, et al. Increasingly frequent diagnosis of acute gastrointestinal graft-versus-host disease after allogeneic hematopoietic cell transplantation. Biol Blood Marrow Transplant. 2004;10(5):320–327. doi: 10.1016/j.bbmt.2003.12.304. - DOI - PubMed
    1. Harris AC, et al. International, multicenter standardization of acute graft-versus-host disease clinical data collection: a report from the Mount Sinai Acute GVHD International Consortium. Biol Blood Marrow Transplant. 2016;22(1):4–10. doi: 10.1016/j.bbmt.2015.09.001. - DOI - PMC - PubMed
    1. Naymagon S, et al. Acute graft-versus-host disease of the gut: considerations for the gastroenterologist. Nat Rev Gastroenterol Hepatol. 2017;14(12):711–726. doi: 10.1038/nrgastro.2017.126. - DOI - PMC - PubMed
    1. Martin PJ. How I treat steroid-refractory acute graft-versus-host disease. Blood. 2020;135(19):1630–1638. doi: 10.1182/blood.2019000960. - DOI - PubMed
    1. Martin PJ, et al. First- and second-line systemic treatment of acute graft-versus-host disease: recommendations of the American Society of Blood and Marrow Transplantation. Biol Blood Marrow Transplant. 2012;18(8):1150–1163. doi: 10.1016/j.bbmt.2012.04.005. - DOI - PMC - PubMed

MeSH terms