. 2025 Sep;22(230):20250048.
doi: 10.1098/rsif.2025.0048. Epub 2025 Sep 10.

Towards NetZero for hospital operating theatres

Affiliations

Towards NetZero for hospital operating theatres

Ian Eames et al. J R Soc Interface. 2025 Sep.

Abstract

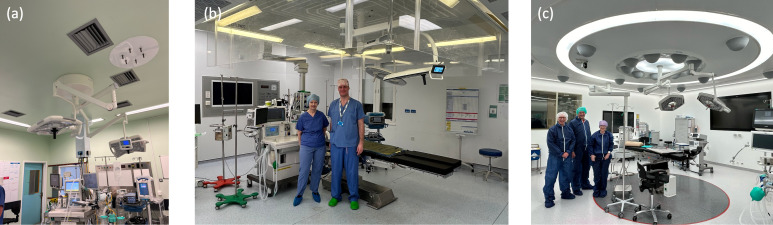
Hospital operating theatre suites are a particularly resource- and energy-intensive component of the health sector. Reducing their carbon footprint presents a significant challenge due to the necessity of maintaining patient safety. In this paper, we apply a multidisciplinary methodology to investigate and assess various strategies aimed at reducing the carbon footprint in hospital theatres. The strategies evaluated include (i) the duration of theatre ventilation operation, (ii) the efficiency of the ventilation strategy, and (iii) heat recovery systems and technologies. These approaches are assessed using a combination of theatre space monitoring (via building management systems), computational air-flow modelling and mathematical models. We develop a robust methodology that applies these modelling techniques to general hospital suites, enabling the estimation of reductions in CO2 equivalent.

Keywords: NetZero; infection control; operating theatre; sustainability.


Conflict of interest statement

We declare we have no competing interests.

Figures

Different hospital suite configurations highlighted in HTM 03−01 and HBN−29.
Figure 1.
Different hospital suite configurations highlighted in Health Technical Memorandum (HTM) 03-01 and Health Building Note (HBN)-29. The typical configuration is (a) with the difference between (a) and (b) concerning the removal of the door between the scrub area and operating theatre. In (c), the scrub is an annex. In (d), staff pass through the preparation room to the operating theatre, through the scrub area.
Photographs showing the different operating theatres: (a) turbulent flow ventilation (TFV) (or conventional ventilation), (b) laminar flow ventilation (LFV) (or ultra-clean canopy), and (c) thermally controlled ventilation (TCV)
Figure 2.
Photographs showing the different operating theatres: (a) turbulent flow ventilation (TFV) (or conventional ventilation), (b) laminar flow ventilation (LFV) (or ultra-clean canopy), and (c) thermally controlled ventilation (TCV). See table 1. In each case, the operating theatre is located in the middle of the room and the specialist ventilation highlighted. ((a) is taken by J. Groome, while (b,c) are taken by I. Eames.)
(a) Floor plan of a typical hospital operating theatre suite - Theatre 12 of Whipps Cross Hospital – incorporating parts of Theatre 11 on the left-hand side
Figure 3.
(a) Floor plan of a typical hospital operating theatre suite—Theatre 12 of Whipps Cross Hospital— incorporating parts of Theatre 11 on the left-hand side. The critical ventilation components are the volumetric supply and exhaust, with the design pressure differential (relative to the corridor) indicated. Pressure stabilizers are set between adjacent rooms to maintain the correct pressure differentials in the spaces. The location of the pressure sensors is denoted by S in (a). (b) Ventilation diagram for Theatre 12 suite is shown along with the volume flow rate, pressure differentials and air changes per hour (ACH). The volume flow rate for the operating theatre is Qs=1.2 m3 s1 because of the additional floor area for the scrub room. Photographs of typical anaesthetic and scrub rooms (taken at the Royal London), highlighting the duplicated equipment and the location of the sink.
Schematic of the computational domains used to explore the critical flow physics with (a), (b) and (c) corresponding to TFV, LFV and TCV.
Figure 4.
Schematic of the computational domains used to explore the critical flow physics with (a), (b) and (c) corresponding to TFV, LFV and TCV. The room height H=3 m, while the floor area is AH=55 m2. The outward normal from the supply and extract surfaces is un. In (a), un=1.4 m s1 on the supply vents, (b) un=0.38 m s1 on the supply hood and un=0.6 m s1 on the extract hood and (c) un=0.5 m s1 over each diffuser. A uniform pressure constraint is applied on the exhaust surfaces.
Numerical results showing the flow characteristics of turbulent flow ventilation (TFV)
Figure 5.
Numerical results showing the flow characteristics of TFV. The turbulent intensity (It=urms/1.4 m s1) and mean flow (q) are shown in (a,b) respectively. The flushing of a passive contaminant, introduced after flow is established, is shown in (c).
Flow characteristics of a laminar flow ventilation (LFV) system, operating in an ultra-clean mode, is shown, highlighting the critical features of the laminar flow, irrotational straining region and interfacial shear layer with the recirculating regions at the side
Figure 6.
Flow characteristics of a laminar flow ventilation (LFV) system, operating in an ultra-clean mode, are shown, highlighting the critical features of the laminar flow, irrotational straining region and interfacial shear layer with the recirculating regions at the side. In (a), the turbulent intensity is shown (It=urms/0.38 m s1) in a plane that runs diagonal across the domain. The instantaneous flow speed (q) is shown in (b,i) for the case of a canopy hood present, while in (b,ii), the extract and hood are absent. The concentration field is shown in (c) t=20 s after the flow is established.
Flow characteristics of a temperature controlled ventilation system (TCV) for a temperature differential.
Figure 7.
Flow characteristics of a temperature-controlled ventilation system (TCV) for a temperature differential of ΔT=2C. In (a) the turbulent intensity (It=urms/0.5 m s1) and (b,i) mean speed (q) is shown in a plane that runs diagonal across the domain. In (b,ii), the influence of reducing the temperature differential (comparing ΔT=1C with 2C) on the thermal stratification is shown; the temperature field on the top and sides of the domain are shown in (c) for ΔT=2C. The concentration field C is shown at a time t=20 s after the flow has been established and the supply air is introducing air with C=0.
Time averaged vertical (downwards) air velocity.
Figure 8.
Time-averaged vertical (downwards) air velocity, uz, at z=2 m and z=1 m for (a) LFV and (b) TCV. In (a) the span is the canopy width and inner region ( approx. 60%. of the canopy width) and (b) the inner region of radius 1.1 m. The outline of a theatre bed (length 2.1 m, width 0.56 m) gives a representative lengthscale. In (c), the decrease in the concentration of a passive contaminant is shown as a function of time for the whole room (black curve) and inner volume (red curve) for (i) TFV, (ii) LFV and (iii) TCV. The inner volume extends from 1 m to ceiling height in a square of circular region (width 1.92 m or radius 1.1 m, respectively). The blue curves are theoretical predictions based on perfect mixing (2.3) or flow displacement (2.4) and applied to the whole room (Vr) or inner region (Vr).
Experimental measurements of the vertical (downwards) air speed.
Figure 9.
Experimental measurements of the vertical (downwards) air speed, uz (in m s1) for LFV under different conditions. The velocity scale is the same in each figure. In (a), a typical validation report is shown for the z=2 m and z=1 m (in the inner region). In (b,c), the vertical air speed is shown at z=2 m, measured at the hood edge and centre and averaged over five measurements, with the lamp locations approximately indicated by circles. The results are shown under full mode and setback (or conventional operation) for (i) and (ii), respectively. The sound intensity and frequency distribution are shown for full (on) and setback operation.
(a) The variation of the maximum and minimum temperature, on each day of the year, at Heathrow Airport in 2023
Figure 10.
(a) The variation of the maximum and minimum temperature, on each day of the year, at Heathrow Airport in 2023. The data is taken from http://nw3weather.co.uk/. The horizontal line is a set point of Tsp=20.5C. (b) Scatter plot showing the prescribed ACH for different rooms with isocontours correspond to volume flux (in m3 s−1). The vertical line corresponds to a typical operating theatre (55 m2, H=3 m) with the triangles correspond to the ACH for TFV, TCV and LCV (see table 1). The black filled squares correspond to the theatre, anaesthetic room and preparation room (figure 3b) with the red square corresponding to the whole theatre suite.
Photographs of typical air-handling units
Figure 11.
Photographs of typical air-handling units. In (a), the supply and exhaust vents of the externally mounted AHU of Theatres 11 and 12 (Whipps Cross) and in (b), the inspection hatches, drain ports and manual/electronic manometers placed across filters can be seen. The systems (a,b) are wholly electric with a stacked arrangement. A typical steam-heated AHU system is shown with the chiller and steam pipes for the battery heater are visible in (c). The traditional gas-powered boilers and a combined heat and power (CHP) system are shown in (d) (Whipps Cross Energy Centre).
A schematic representation of two contrasting AHUs are shown along with a nodal representation of the air pathway
Figure 12.
A schematic representation of two contrasting air handling units (AHUs) is shown along with a nodal representation of the air pathway. In (a), a typical all-electric system (e.g. Theatre 12, Whipps Cross Hospital) with heat recovery via a recoup damper is shown. In (b), a typical mixed gas/electric AHU system is shown, with heating supplied from a gas boiler and cooling from a chiller unit. The heat recovery comes from a recirculating loop and coils. In these examples, the supply and exhaust air during heat recovery remain separate.
Variation of the (a) temperature and (b) humidity in a fully electric AHU over a ten day period starting on 5th March 2024.
Figure 13.
Variation of the (a) temperature and (b) humidity in a fully electric AHU over a 10-day period starting on 5 March 2024 (N=65). In (a), the OAT (To) is contrasted with the room (Tr), extract (Te) and supply air temperature (Ts). In (b), the OA humidity is contrasted with the room humidity. The green curve corresponds to the prediction of room humidity based on raising the external air temperature to the room temperature. The grey rectangles correspond to the period of time extending from 7.00 to 19.00.
(a) The thermal heat energy demand.
Figure 14.
(a) The thermal heat energy demand, ETh, for one year of continuous load is plotted as a function of air freshness (1α) for different ventilation systems that operate in full ventilation mode continuously. The full curve corresponds to ETh with the dashed curve corresponds to the heating contribution. The horizontal line shows the energy corresponding to 1 kW in continuous mode of operation. (b) The fan energy demand, ETf, is shown for the different ventilation systems (see table 1). The energy consumption for LFV is estimated using u¯z=0.45 m s1 and u¯z=0.38 m s1 (which is labelled as LFV (min)). The estimates are based on an extract temperature Te=20.5C during the working period and Tr=22C during setback and at night. The thermal power P is set at 550 W outside the working period and 1625 W (corresponding to seven adults in theatre) during the working day.
(a) The influence of the mode of operation on the thermal energy consumption
Figure 15.
(a) The influence of the mode of operation on the thermal energy consumption. This case corresponds to a LFV with air supplied from an AHU that is heated by a gas-boiler. The working day is defined to extend from 7.00 to 19.00, during which the operating theatre ventilation is set to full operation. The modes of operation are (i) continuous, (ii) set back outside working day, (iii) off outside working day, (iv) set back outside the working day and w/e and (v) off outside working day and weekend. In (b), ratio between the thermal energy consumption compared with the benchmark case of full operation of a gas-boiler heated AHU is shown. A comparison is given between a fractional time estimate and that based on integrating consumption over time.
The pressure differentials between the rooms and the hospital bay (taken as a proxy for corridor pressure) is shown as a function of time for Theatre 12 at Whipps Cross Hospital; the legend identifies the pressure differential in the theatre, dirty utility and preparation room
Figure 16.
The pressure differentials between the rooms and the hospital bay (taken as a proxy for corridor pressure) is shown as a function of time for Theatre 12 at Whipps Cross Hospital; the legend identifies the pressure differential in the theatre, dirty utility and preparation room. In (a), the pressure differential on 18 March 2024, shows a normal process of operation with t=0 corresponding to midnight. In (b), the variation of the pressure differentials with time are shown for the period during which the AHU is switched off and then on.

References

    1. Callendar GS. 1938. The artificial production of carbon dioxide and its influence on temperature. Q. J. R. Meteorol. Soc. 64, 223–240. ( 10.1002/qj.49706427503) - DOI
    1. IPCC . 2018. Summary for policymakers, (ed. Masson-Delmotteet V), pp. 3–24. Cambridge, UK: Cambridge University Press. ( 10.1017/9781009157940.001) - DOI
    1. Intergovernmental Panel on Climate Change (IPCC) . 2021. Climate Change 2021: The Physical Science Basis. In Contribution of Working Group I to the Sixth Assessment Report of the Intergovernmental Panel on Climate Change. Cambridge, UK: Cambridge University Press. ( 10.1017/9781009157896) - DOI
    1. UK Act of Parliament . 2008. The Climate Change Act 2008. https://www.legislation.gov.uk/ukpga/2008/27/contents.
    1. MacNeillA L, Lillywhite R, Brown CJ. 2017. The impact of surgery on global climate: a carbon footprinting study of operating theatres in three health systems. Lancet Planet. Health 1, e381–e388. ( 10.1016/S2542-5196(17)30162-6) - DOI - PubMed

LinkOut - more resources