. 2025 Sep 9;16(1):8246.
doi: 10.1038/s41467-025-63600-1.

Amazon forest resistance to drought is increased by diversity in hydraulic traits

Affiliations

Amazon forest resistance to drought is increased by diversity in hydraulic traits

Liam Langan et al. Nat Commun. .

Abstract

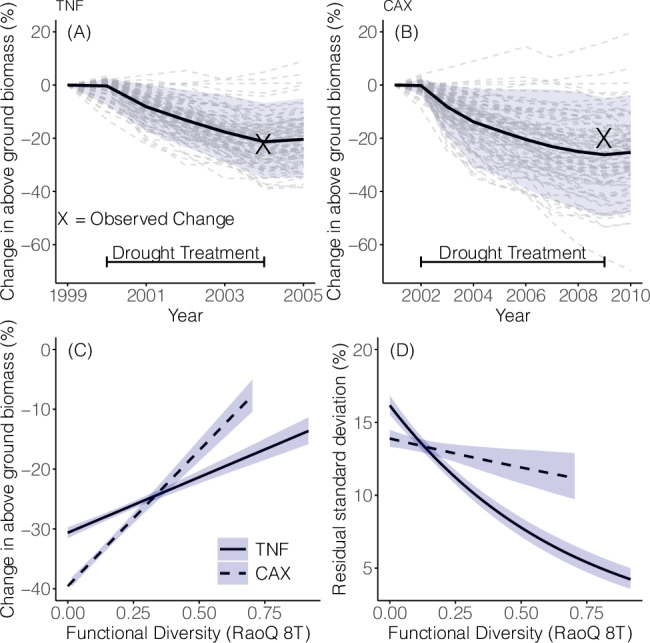
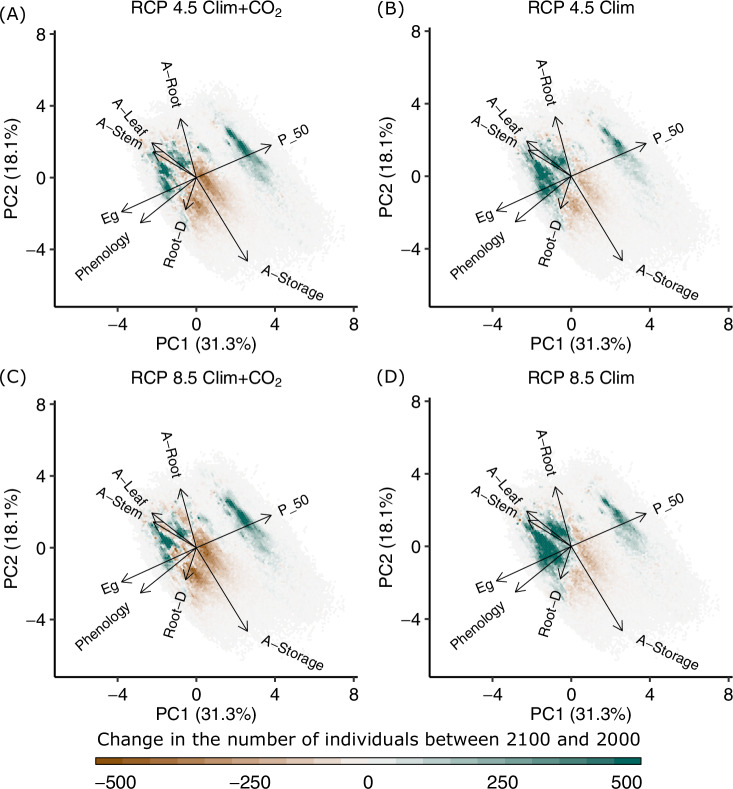
The unique biodiversity and vast carbon stocks of the Amazon rainforests are essential to the Earth System but are threatened by future water balance changes. Empirical evidence suggests that species and trait diversity may mediate forest drought responses, yet little evidence exists for tropical forest responses. In this simulation study, we identify key axes of trait variation and quantify the extent to which functional trait diversity increases tropical forests' drought resistance. Using a vegetation model capable of simulating observed tropical forest drought responses and trait diversity, we identify emergent trade-offs between water-related traits (hereafter hydraulic traits) as a key axis of variation. Our simulations reveal that higher functional trait diversity reduces site-scale biomass loss during sudden catastrophic drought, i.e., a 50% precipitation reduction for four and seven years, by 17% and 32%, respectively, and continental-scale biomass loss due to severe chronic climate change-associated precipitation reductions, i.e., RCP8.5, constant CO2 at 380 ppm, and a 50% precipitation reduction over 100 years, by 34%. Additionally, we find that functional trait diversity-mediated biomass resistance is stronger under more severe drought conditions. These findings quantify the essential role of hydraulic-trait diversity in enhancing tropical forest drought resistance and highlight the critical linkages between biodiversity conservation and climate change mitigation.


Conflict of interest statement

Competing interests: The authors declare no competing interests.

Figures

Fig. 1
Fig. 1. Functional trait diversity-mediated drought responses.
Simulated drought experiments for TNF (A) and CAX (B). Shown is the change in above-ground biomass during drought using the default model setup with no constraints placed on diversity. Each line represents one of 96 replicate simulations. The bold line represents the mean over the replicate simulations. Crosses indicate the observed biomass reduction and the year these reductions were observed. Horizontal bars indicate the start and end of simulated and real-world drought treatments. For (C and D), simulated drought experiments were repeated, and the diversity level was manipulated by initialising the model with varying numbers of unique trait combinations (species). The model was initialised with the following 18 different numbers of species (1, 2, …, 12, 16, 32, 48, 64, 80, and 96). No two species had identical trait values. 96 replicates were run for each species number treatment (see Fig. S1 and “Methods”). C Mean predicted post-drought biomass reductions vs. simulated functional trait diversity. D Residual standard deviation about mean biomass reductions. C, D The results of a Bayesian linear regression analysis (see “Examining relationships between functional trait diversity and changes in above-ground biomass” and Tables S2, S3). Shading indicates the 95% credible interval around mean posterior predictions. Rao’s quadratic entropy, i.e., the mean functional dissimilarity between two randomly selected individuals, was used as a measure of functional trait diversity in (C) and (D). 8T indicates that RaoQ was calculated using the 8 traits displayed in Figs. 2, 3. The data underlying this figure are provided in figshare (10.6084/m9.figshare.26232395).
Fig. 2
Fig. 2. Emergent axes of trait variation.
Principal component analysis of the trait combinations (species) used to initialise simulated diversity experiments (Fig. 1). PCA for (A) TNF and (B) CAX; points represent the position of each of the 96 species in trait-space. Density plots for the conservative vs productive axis (PC1) for the TNF and CAX sites (C). Density plots for the hydraulic trait axis (PC2) for the TNF and CAX sites (D). Coloration of points and density curves in (AD) based on the four leaf phenological combinations of plant strategies. All traits are adaptive, see Supplementary Notes “Reproduction, inheritance, mutation, and crossover'', Table S9. Conservative vs productive axis (PC1, AC): arrows point toward a higher allocation of carbon to grow roots (A-Root), leaves (A-Leaf) and stems (A-Stem) vs deferred growth via higher allocation to storage (A-Store). Hydraulic-trait axis (PC2, A, B, D): arrows point toward less negative water potential at 50% loss of conductance (P50), an evergreen leaf phenology (Eg) (as opposed to deciduous), light-triggered leaf flush (Phenology) (as opposed to water-triggered), increased maximum rooting depth (Root-D). Note: significant conclusions cannot be drawn from the two Deciduous_Light species. The data underlying this figure are provided in figshare (10.6084/m9.figshare.26232395).
Fig. 3
Fig. 3. Change in Amazonian functional composition across trait-space.
Principal component analysis for the continental-scale simulation area (Fig. S3) and each climate change scenario: A RCP4.5 Clim+CO2, B RCP4.5 Clim, C RCP8.5 Clim+CO2, and D RCP8.5 Clim. All trees in the study region were included in the calculations. Trait space was divided into hexagons. Each hexagon was then overlaid with an empirical 2D kernel density estimate of the change in the number of individuals across trait-space between 2000 and 2100. Traits used as in Fig. 2. Hydraulic-strategy traits align predominantly along PC1, with productive vs. conservative strategy traits along PC2. For clarity, arrow length was tripled, and changes greater or less than  ±500 were set to  ±500. Arrows point toward: a higher allocation of carbon to grow roots (A-Root), leaves (A-Leaf) and stems (A-Stem) vs deferred growth via higher allocation to storage (A-Store), less negative water potential at 50% loss of conductance (P50), an evergreen leaf phenology (Eg) (as opposed to deciduous), light-triggered leaf flush (Phenology) (as opposed to water-triggered), increased maximum rooting depth (Root-D). The data underlying this figure are provided in figshare (10.6084/m9.figshare.26232395).
Fig. 4
Fig. 4. Functional trait diversity-mediated changes in future above-ground biomass.
Predicted change in above-ground biomass between 1990 and 2100 for RCP4.5 with and without increasing CO2. A, B Predicted percentage change in biomass as mediated by functional trait diversity (Rao’s quadratic entropy). Changes are shown at varying levels of precipitation reduction by 2100. A, B Predictions with increasing CO2. C, D As in (A) and (B) but with CO2 held constant at 1990 levels. Predictions are based on a linear mixed effects model (Table S6). Lines are predicted mean responses for the effect of functional diversity on change in above-ground biomass at varying levels of precipitation reduction. Shading indicates a 95% confidence interval. The range of values for precipitation reductions was based on the approximate mean reduction for the study area of 30% (Fig. S2B, C) up to a value of 50% consistent with site-level drought experiments. See “Amazonian climate change scenario simulations—Plant strategy removal” and Table S6 for further details. 2T indicates that RaoQ was calculated using 2 traits (P50 and Root-D). The data underlying this figure are provided in figshare (10.6084/m9.figshare.26232395).

Similar articles

References

    1. Magrin, G. et al. Central and South America. In: Climate Change 2014: Impacts, Adaptation, and Vulnerability. Part B: Regional Aspects. Contribution of Working Group II to the Fifth Assessment Report of the Intergovernmental Panel on Climate Change, (eds Barros, V. R. et al.) pp. 1499–1566 (Cambridge University Press, Cambridge, United Kingdom and New York, NY, USA, 2014).
    1. Perrings, C., Duraiappah, A., Larigauderie, A. & Mooney, H. The biodiversity and ecosystem services science-policy interface. Science331, 1139–1140 (2011). - PubMed
    1. McDowell, N. G. & Allen, C. D. Darcy’s law predicts widespread forest mortality under climate warming. Nat. Clim. Change5, 669–672 (2015).
    1. Hubau, W. et al. Asynchronous carbon sink saturation in African and Amazonian tropical forests. Nature579, 80–87 (2020). - PMC - PubMed
    1. McKay, D. I. A. et al. Exceeding 1.5C global warming could trigger multiple climate tipping points. Science377, eabn7950 (2022). - PubMed

LinkOut - more resources