. 2025 Sep 10;10(1):290.
doi: 10.1038/s41392-025-02378-6.

Characterization of the extrinsic and intrinsic signatures and therapeutic vulnerability of small cell lung cancers

Affiliations

Characterization of the extrinsic and intrinsic signatures and therapeutic vulnerability of small cell lung cancers

Gui-Zhen Wang et al. Signal Transduct Target Ther. .

Abstract

Small-cell lung cancer (SCLC), an aggressive neuroendocrine tumor strongly associated with exposure to tobacco carcinogens, is characterized by early dissemination and dismal prognosis with a five-year overall survival of less than 7%. High-frequency gain-of-function mutations in oncogenes are rarely reported, and intratumor heterogeneity (ITH) remains to be determined in SCLC. Here, via multiomics analyses of 314 SCLCs, we found that the ASCL1+/MKI67+ and ASCL1+/CRIP2+ clusters accounted for 74.38% of the 190,313 SCLC cancer cells from 39 patients, with the ASCL1+SOX1+ stem-like cell cluster across SCLC subtypes. The major histocompatibility complex (MHC) class I molecules were expressed at low levels in six and high levels in five cancer cell clusters and were inversely associated with the KI67 expression level. Abnormal splicing of mRNAs was a feature of SCLC, with focal adhesion kinase (FAK) splicing variants identified in 119 (77.3%) of 154 patients. FAK variants exhibited elevated kinase activity, were associated with the worst prognosis, and were sensitive to FAK inhibitors in patient-derived organoids and xenograft models. Eleven high-frequency mutations were identified in addition to TP53 and RB1, and smoking status and tumor stage did not affect microbiota variance in SCLC. Taken together, our data further revealed the complicated ITH and discovered that FAK splicing variants represent high-frequency gain-of-function alterations in oncogene in SCLC and potential therapeutic targets for this recalcitrant cancer.


Conflict of interest statement

Competing interests: The authors declare no competing interests.

Figures

Fig. 1
Fig. 1
Microenvironment landscape of small cell lung cancer (SCLC). a Schematic representation of the transcriptomic study design, utilizing a total of 65 samples from 39 patients with SCLC for single-cell RNA sequencing. b Dot plot of selected marker genes in each cell lineage. Dot size and color indicate the fraction of expressing cells and normalized expression levels, respectively. c UMAP visualization of expression profile clusters for cancer and immune cells within the tumor microenvironment, identifying 7 major cell types (left panel) and 58 major subtypes (right panel). d Bar plots illustrating the distribution of the 7 major cell types in each sample, categorizing samples as tumor samples (pre- or posttherapy), adjacent normal tissues (pre- or posttherapy), peripheral blood mononuclear cells (PBMCs), and lymph nodes. e Comparison of the ratios of T/NK cell, Mφ/monocyte, and B cell in the tumor tissues of patients with NSCLC (Wu et al. and Zhang et al.) and SCLCs (this cohort, Wang et al.) via scRNA-seq analysis. Data were obtained from the scRNA-seq datasets GSE148071 and GSE207422. f Comparison of the relative enrichment of T cell, Macrophage/monocyte, and B cell in the bulk RNA-seq data of this cohort (Wang et al.), George et al., Zhang et al. and Jiang et al. cohorts. The enrichment scores for T cells, macrophages/monocytes, and B cells were calculated via the Xcell algorithm. g Tertiary lymphoid structures (TLSs) in patients receiving neoadjuvant therapy. Images of three patients are shown, and patient characteristics are listed within the images. Pan-CK, pancytokeratin. h Quantification of TLSs in g. P value, Student’s t test. ***, P < 0.001
Fig. 2
Fig. 2
Immune cells in the microenvironment of SCLC. a Analysis of macrophages (Mφs)/monocytes. A total of 7 Mφ subtypes, 2 monocyte subtypes and 1 dendritic cell subtype were identified (left panel). The distribution of cells across different sample types is shown in the right panel. b Dot plot of selected gene expression in each cell lineage. Dot size and color indicate the fraction of expressing cells and normalized expression levels, respectively. c-e Boxplots representing the relative proportions of each Mφ/monocyte population. Comparisons were made among different stages classified by TNM stage (c), smoking status (d), and outcomes of neoadjuvant therapy (e). f Analysis of T/NK cells. A total of 14 subtypes of T/NK cells were identified (left panel). The distribution of cells in different sample types is shown in the right panel. g Boxplots representing the relative proportions of each T/NK cell subtype. Comparisons were made among different stages and outcomes of neoadjuvant therapy. h Analysis of B cells. A total of 9 subtypes of B cells were identified (left panel). The distribution of cells across different sample types is shown in the right panel. i Boxplots representing the relative proportions of each B cell subtype. Comparisons were made among different stages and outcomes of neoadjuvant therapy. P values in (c, d, e, g, and i) were determined via the Wilcoxon rank-sum test. *P < 0.05, **P < 0.01
Fig. 3
Fig. 3
Cancer cells and cancer stem-like cells in SCLC. a Analysis of cancer cells and nonimmune normal cells identified 19 cell clusters (left panel). The distribution of cells in different sample types is shown in the right panel. b, c Expression of feature genes in the cell clusters. The expression of ASCL1, NEUROD1, YAP1, and POU2F3 is shown in a violin plot (b). The marker genes of each cluster are shown in dot plots (c). Dot size and color indicate the fraction of expressing cells and normalized expression levels, respectively. d Relative fractions of tumor samples in the 14 cancer cell clusters. e Distribution of distinct tumor cell clusters across the 39 tumor samples. f Gene set enrichment analysis (GSEA) plots for the indicated gene sets in the stem-like cell cluster and the other cancer cell cluster. g Potency and differentiation states of the 19 cell clusters evaluated by the CytoTrace algorithm. h Enrichment scores of potential cell origins for SCLC in lung tissues. The top 100 genes in neuroendocrine, club, ciliated, basal, AT1, and AT2 cells were used for enrichment analysis. i, j Comparisons of the indicated cell clusters at different stages (i) and outcomes of neoadjuvant therapy (j). P values in panels h and i were determined via the Wilcoxon rank-sum test. *P < 0.05; **P < 0.01
Fig. 4
Fig. 4
Antigen processing and presentation (APP) machinery in SCLC. a UMAP displaying the enrichment of genes related to APP via MHC-I and MHC-II. The enrichment scores are visualized via color coding. b The expression of MHC molecules in the indicated cell clusters. ce The expression of HLA-A and HLA-DRA on EPCAM+ cancer cells. Two representative images from two patient samples are shown (c, e), and 12 patient samples were tested via PhenoCycler-Fusion 2.0. The ratios of EPCAM+HLA-A+ and EPCAM+HLA-DRA+ EPCAM+ cells in each patient are shown in (d). f The expression of HLA-A and HLA-DRA in EPCAM+KI67+ cancer cells. Two representative images from two patient samples are shown, and 12 patient samples were tested via PhenoCycler-Fusion 2.0. g The correlation between the expression levels of KI67 and MHC components in SCLC (n = 107). The data were obtained from Liu et al. P values, Pearson correlation test. hj HLA-A/HLA-DR expression in cancer and immune cells (h), and the staining intensity of HLA-A and HLA-DR on cancer and immune cells was obtained via QuPath (i, j). Patient characteristics are listed at the bottom of each image. P value, Student’s t test. k HLA-A expression in cancer and immune cells localized at the center and border of the tumors. Enlarged signals are shown in the lower panels
Fig. 5
Fig. 5
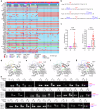
High-frequency alternatively spliced genes in SCLCs. a Alternative splicing events (ASEs) in the genes most frequently affected in 45 SCLCs. The tumors are arranged from left to right in the top track. b Alignment of FAK, FAK6, FAK7, and FAK6,7. Only the regions flanking Y397 are shown. c The percent spliced-in (PSI) values of FAK transcripts containing Box 6 and Box 7 in tumor and counterpart normal lung tissues. P value, Student’s t test. d-g Models of the FERM-Kinase region of FAK and its variants. The FERM and kinase domains are colored gray, and the activation (A) loop in the kinase domain is colored green. The variant region is in red for each FAK alternative. The linker between the FERM and kinase domains is in yellow in FAK (d), slate in FAK6 (e), cyan in FAK7 (f), and blue in FAK6,7 (g). The Y397 autophosphorylation site in the linker is labeled. The additional tyrosine residues from the insertion (Y414 in FAK7 and Y420 in FAK6,7) are also labeled. h FAK variants were detected via RT‒PCR in paired tumor–normal samples from 37 patients, including 27 patients whose samples were analyzed via bulk RNA-seq. Sanger sequencing was used to confirm these results, as shown in Supplementary Fig. 10b, c. T tumor tissue, N adjacent normal lung tissue
Fig. 6
Fig. 6
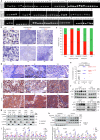
FAK splicing variants in an additional cohort of 99 SCLCs. a FAK variants in the tumor tissues of patients detected by RT‒PCR. b Representative results of FAK variants in tumor tissues detected by in situ hybridization BaseScope Duplex assays. c Positive rates of FAK splicing alternatives across different subtypes of SCLCs. The numbers in the columns indicate positive cases. d Representative results of p-FAK in patients with variants of FAK in tumor tissues detected by IHC assays. e Immunoreactivity scores from the immunohistochemistry assays in patients with FAK splicing variants. P values, Student’s t test. f The expression level of p-FAK in patients was detected by Western blotting. g The indicated SCLC cells were lysed, and cytosolic and nuclear proteins were separated and subjected to western blotting with the indicated antibodies. h DMS114 cells were transfected with the indicated FAK transcripts and lysed, and cytosolic and nuclear proteins were isolated for western blotting with the indicated antibodies. i DMS114 and H1339 cells were transfected with the indicated FAK transcripts and lysed, and RNA samples were isolated for quantitative RT‒PCR
Fig. 7
Fig. 7
Clinical significance of FAK splicing variants in SCLC. a OS of patients with SCLC with wild-type FAK and those with splicing variants. P value, log-rank test. b H446 and DMS114 cells were treated with 2.5 to 10 μM PF562271 and monitored with an IncuCyte live-cell analysis system. P values, Student’s t test. ****, P < 0.0001. c Three SCLC patient-derived organoids were established and treated with PF562271, and organoid cell viability was quantified via the CCK-8 assay. Representative images are shown. O, organoid. P value, Student’s t test. **, P < 0.01; ***, P < 0.001; ****, P < 0.0001. d FAK in the two patient-derived xenograft (PDX) models was detected by RT‒PCR (upper panel). The PDX1 mice were treated with PF562271 at 50 mg·kg−1·day−1 5 days per week for four weeks. The tumor volume was estimated every 2 days. The data are shown as mean ± sd. N = 6 for each group. P value, Student’s t test. e Images of xenograft tumors isolated from the mice. f Weights of xenograft tumors isolated from the mice. P value, Student’s t test. ****, P < 0.0001. g, h Representative images of hematoxylin‒eosin (HE) staining and IHC assays for p-FAK and Ki67 in tumor sections harvested from PF562271-treated and vehicle control-treated mice (n = 4 for each group; g). The immunoreactivity scores of p-FAK and Ki67 were calculated (h). P values, two-tailed unpaired t test. ***, P < 0.001; ****, P < 0.0001. i Western blot assays using lysates of tumor samples harvested from four mice in each group. j Mice bearing PDX2 tumors were treated with 50 mg·kg−1·day−1 PF562271, and the tumor volume was estimated every 3 days. The data are shown as mean ± sd. N = 6 for each group. P value, Student’s t test. k Images of xenograft tumors isolated from the mice. l Weights of xenograft tumors isolated from the mice. P value, Student’s t test. ***, P < 0.001. m, n Representative images of HE staining and IHC assays of p-FAK and Ki67 in tumor sections harvested from PF562271- and vehicle control-treated mice (n = 4 for each group; m). The immunoreactivity scores of p-FAK and Ki67 were calculated (n). P values, two-tailed unpaired t test. **, P < 0.01; ***, P < 0.001. o Western blot assays using lysates of tumor samples harvested from the mice. p H82 cell-inoculated mice were treated with PF562271 at the indicated dosage, and the tumor volume was estimated every two days. The data are shown as mean ± sd. N = 6 for each group. P value, Student’s t test. *, P < 0.05; ****, P < 0.0001. q Images of xenograft tumors isolated from the mice. r Weights of xenograft tumors isolated from the mice. P value, Student’s t test. s Western blot assays using lysates of tumor samples harvested from the mice. t, u Representative images of HE staining and IHC assays of p-FAK and Ki67 in tumor sections (n = 6 for each group; t). The immunoreactivity scores of p-FAK and Ki67 were calculated via the IHC assay results (u). P values, two-tailed unpaired t test. ***, P < 0.001; ****, P < 0.0001
Fig. 8
Fig. 8
Somatic exonic mutations and carcinogen signatures in SCLC. a Somatic exonic mutations in SCLCs. Tumors are arranged from left to right in the top track, alterations in candidate genes are annotated for each sample according to the color panel, and the mutation rates for each gene are shown in the right panel. b Nucleotide substitutions in smokers and nonsmokers. TMB, tumor mutation burden. P values, two-sided Student’s t test. *, P < 0.05; **, P < 0.01; ***, P < 0.001. c Nucleotide changes in each patient. The tumors are arranged from left to right in the top track, the demographic characteristics of the patients are annotated according to the right-side color panel, and the de novo signatures A, B, C, and D are described in (d). d De novo signatures A through D. COSMIC and carcinogen signatures are used as references, and potential etiologies are shown

References

    1. Sung, H. et al. Global Cancer Statistics 2020: GLOBOCAN estimates of incidence and mortality worldwide for 36 cancers in 185 countries. CA Cancer J. Clin.71, 209–249 (2021). - PubMed
    1. George, J. et al. Comprehensive genomic profiles of small cell lung cancer. Nature524, 47–53 (2015). - PMC - PubMed
    1. Rudin, C. M. et al. Comprehensive genomic analysis identifies SOX2 as a frequently amplified gene in small-cell lung cancer. Nat. Genet.44, 1111–1116 (2012). - PMC - PubMed
    1. Peifer, M. et al. Integrative genome analyses identify key somatic driver mutations of small-cell lung cancer. Nat. Genet.44, 1104–1110 (2012). - PMC - PubMed
    1. Jiang, L. et al. Genomic landscape survey identifies SRSF1 as a key oncodriver in small cell lung cancer. PLoS Genet12, e1005895 (2016). - PMC - PubMed

Substances