. 2025 Sep;27(9):1543-1554.
doi: 10.1038/s41556-025-01697-8. Epub 2025 Sep 9.

Durotaxis is a driver and potential therapeutic target in lung fibrosis and metastatic pancreatic cancer

Affiliations

Durotaxis is a driver and potential therapeutic target in lung fibrosis and metastatic pancreatic cancer

Taslim A Al-Hilal et al. Nat Cell Biol. 2025 Sep.

Abstract

Durotaxis, cell migration along stiffness gradients, is linked to embryonic development, tissue repair and disease. Despite solid in vitro evidence, its role in vivo remains largely speculative. Here we demonstrate that durotaxis actively drives disease progression in vivo in mouse models of lung fibrosis and metastatic pancreatic cancer. In lung fibrosis, durotaxis directs fibroblast recruitment to sites of injury, where they undergo mechano-activation into scar-forming myofibroblasts. In pancreatic cancer, stiffening of the tumour microenvironment induces durotaxis of cancer cells, promoting metastatic dissemination. Mechanistically, durotaxis is mediated by focal adhesion kinase (FAK)-paxillin interaction, a mechanosensory module that links stiffness cues to transcriptional programmes via YAP signalling. To probe this genetically, we generated a FAK-FATL994E knock-in mouse, which disrupts FAK-paxillin binding, blocks durotaxis and attenuates disease severity. Pharmacological inhibition of FAK-paxillin interaction with the small molecule JP-153 mimics these effects. Our findings establish durotaxis as a disease mechanism in vivo and support anti-durotactic therapy as a potential strategy for treating fibrosis and cancer.


Conflict of interest statement

Competing interests: D.L. is a founder and has a financial interest in both Mediar Therapeutics and Zenon Biotech. The companies are developing treatments for organ fibrosis and cancer related to this work. D.L. has received consulting fees from Merck & Co, Scholar Rock, Ono Pharma, UCB Biopharma, Calico Life Sciences, Johnson & Johnson, Inzen Therapeutics, BioHope and PureTech Health LLC that are not related to this work. D.L. has received research support from Boehringer Ingelheim, Merck & Co, Indalo Therapeutics, Ono Pharma and Unity Biotechnology, which was not used in this work. D.J.T. is a scientific advisor and has a financial interest in Zenon Biotech. D.T. has received consulting fees from ROME Therapeutics, Foundation Medicine, Inc., NanoString Technologies, EMD Millipore Sigma and Pfizer that are not related to this work. D.T. is a founder and has equity in ROME Therapeutics, PanTher Therapeutics and TellBio, Inc., which is not related to this work. D.T. receives research support from ACD-Biotechne, PureTech Health LLC and Ribon Therapeutics, which was not used in this work. D.L.’s and D.T.’s interests were reviewed and are managed by Mass General Brigham in accordance with their conflict-of-interest policies. The other authors declare no competing interests.

Figures

Fig. 1
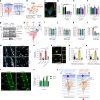
Fig. 1. Fibrotic tissues exhibit steep stiffness gradients in mice.
Spatial mapping of matrix stiffness of healthy and fibrotic tissues obtained from mouse models of skin, lung and kidney fibrosis by in situ AFM nanoindentation. a, Mouse model of lung fibrosis induced by a single intratracheal (i.t.) instillation of bleomycin (1.2 U kg−1). b, Picrosirius red staining (marker of fibrosis) of mouse lung tissue of saline- and bleomycin-challenged mice. Representative images are presented from n = 6 mice per group. Scale bar, 100 μm. c, Representative 3D elastographs of saline- and bleomycin-challenged mouse lung parenchyma from n = 6 mice per group. Three-dimensional stiffness maps were obtained from lung tissues in the respective regions of interest identified in b. The colour bar indicates Young’s modulus, with red colour indicating areas of increased stiffness. d, Measurement of matrix stiffness as a function of distance in mouse lung tissues. Calculation of stiffness gradients and average slope based on 50 slopes per mouse lung tissue sample from n = 6 mice per group. e, Mouse model of skin fibrosis induced by daily subcutaneous (s.c.) injection of bleomycin (0.05 U kg−1). f, Picrosirius red staining of mouse skin tissues from n = 6 mice per group. Scale bar, 100 μm. g, Representative 3D elastographs of saline- and bleomycin-challenged mouse skin from n = 6 mice per group. h, Calculation of stiffness gradients and average slope based on 50 slopes per mouse skin tissue sample from n = 6 mice per group. i, Mouse model of kidney fibrosis induced by unilateral ureteral obstruction (UUO). j, Picrosirius red staining of mouse kidney tissues from n = 6 mice per group. Scale bar, 100 μm. k, Representative 3D elastographs of UUO- and sham-operated mouse kidneys from n = 6 mice per group. l, Calculation of stiffness gradients and average slope based on 50 slopes per mouse kidney tissue sample from n = 6 mice per group. Source data
Fig. 2
Fig. 2. Stiffness gradients induce durotaxis of fibroblasts.
a, A schematic of the microfabrication of mechanically patterned hydrogels to assess durotaxis. A soft polyacrylamide (PA) hydrogel (4 kPa) was initially photo-polymerized on top of a methacrylate-treated coverslip using UV light. A second PA stiff hydrogel (40 kPa) was added on top of the soft hydrogel by photo-crosslinking the polymer solution in the form of stripes using a photomask. b, The final product results in a ‘step’ hydrogel consisting of alternating soft and stiff bars, creating a stiffness gradient of 900 Pa µm−1 between adjacent stripes bars that expands over 40 µm. c, Durotaxis assay on ‘step’ hydrogels. Immunofluorescence showed that fibroblasts durotax to stiff bars 24 h after plating. Fibroblasts were identified by staining for phalloidin (red) to visualize F-actin and DAPI (blue) to visualize nuclei. Mitomycin C treatment was used to prevent proliferation. d, Durotaxis index of multiple human and murine cell types involved in tissue fibrosis. MSCs, mesenchymal stem cells. Data were obtained from three biological replicates each. Two-way ANOVA test. *P < 0.05, **P < 0.01, ***P < 0.001 versus 4 h. e, A schematic of the microfabrication of hydrogels with continuous stiffness gradients by microfluidic gradient generator. As shown in f, the final product results in a hydrogel in which the stiffness gradient (36 Pa µm−1) incorporates an identical change in matrix stiffness over a greater distance (1,000 µm). g,h, Representative brightfield (g) and immunofluorescence (h) images of lung fibroblasts plated either on hydrogels of uniform stiffness (25 kPa) or hydrogels with stiffness gradients (4–40 kPa). Scale bar, 25 µm. n = 3 independent experiments. i, A schematic of a cell trajectory and the variables used to calculate the forward migration index (FMI) in time-lapse imaging studies. Angular displacement was used to determine the cell’s angular trajectory. j, Rose diagrams of cell migration showing angular distributions of cell trajectories in their migration tracks relative to the stiffness gradient, with the radius length indicating the number of events in each trajectory. Data were obtained from 4 biological replicates, n = 68–77 cells. For cell-based assays, data are given as mean ± s.d. from three independent experiments. Source data
Fig. 3
Fig. 3. The FAK–paxillin mechanosensitive pathway controls fibroblast durotaxis.
a, A schematic of matrix mechanosensing via the FAK–paxillinY31/118 pathway and its role in initiating durotaxis. b, A schematic of FAK-FAT domain interaction with paxillin LD4 and LD2 domains that is disrupted by a small molecule inhibitor JP-153 without affecting FAK catalytic activity. c, PLA demonstrates activation of the FAK–paxillinY31/118 pathway at the leading edge of durotaxing fibroblasts. Green indicates F-actin, and blue indicates nuclei. Red dots indicate FAK–phospho-paxillin Y31 interaction. Scale bar, 10 µm. df, The effect of lentiviral overexpression of paxillin mutants including constitutively active phosphomimetic paxillin (paxillinY31/118E), inactive non-phosphorylatable paxillin (paxillinY31/118F) or paxillin point mutant defective in vinculin binding (paxillinE151Q) on fibroblast durotaxis induced by stiffness gradients (d), chemotaxis induced by gradients of LPA (e), and haptotaxis induced by gradients of fibronectin (f). Data are presented as fold increase over controls (dotted line). One-way ANOVA test. **P < 0.01 versus GFP. g, The effect of JP-153 on matrix stiffness-induced activation of the FAK–paxillinY31/118 pathway. hl, Schematic of different cell migration pathways (h). JP-153 dose–response effects on fibroblast, chemotaxis induced by gradients of lysophosphatidic acid (LPA) (i) or platelet-derived growth factor (PDGF) (j), haptotaxis induced by gradients of fibronectin (k), and durotaxis induced by stiffness gradient (l). Data are presented as fold increase over controls (dotted line). One-way ANOVA test. ****P < 0.0001 versus 0 μM. m,n, The effect of JP-153 on myofibroblast formation induced by stiff matrix after fibroblast durotaxis. Activated myofibroblasts were identified by staining for α-SMA (pink, a marker of myofibroblast differentiation), phalloidin (grey, to visualize F-actin) and DAPI (blue, to visualize nuclei). Scale bar, 50 µm. One-way ANOVA test. *P < 0.05, **P < 0.01 versus vehicle. oq, Focal adhesions were identified by staining for phospho-paxillin (Y31) (yellow) (o). Scale bar, 10 µm. The effect of JP-153 on the number (p) and size of focal adhesions (q). One-way ANOVA test. ****P < 0.0001 versus vehicle. r,s, The effect of JP-153 on the cellular localization of YAP (cytoplasmic versus nuclear) was assessed by immunostaining for YAP (green) (r) and its quantification (s). Scale bar, 50 µm. One-way ANOVA test. ****P < 0.0001 versus control. t, A schematic of the stiffness gradients coupling fibroblast durotaxis and myofibroblast activation via the FAK–paxillinY31/118–YAP pathway. For cell-based assays, data are given as mean ± s.d. from three independent experiments. Source data
Fig. 4
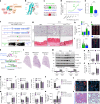
Fig. 4. Genetic or pharmacological inhibition of the FAK–paxillin pathway inhibits fibroblast durotaxis and organ fibrosis in mice.
a, A schematic of the interaction between FAK-FAT and paxillin LD2 domains. The red ball represents the positions of site-directed binding between FAT and LD2 domains. b, A 3D model of the LD2 motif of paxillin binding to FAT via L994 motif. c, The amino acid sequences of WT FAT on exon 32 and its point mutated version (L994E). d, The binding of WT FAT and mutated FAT (L994E) with paxillin LD2 domain. e, The effect of transfection of WT FAK and L994E FAK on fibroblast durotaxis induced by stiffness gradients. Student’s t-test. ***P < 0.001 versus WT FAT. f, gRNAs targeting FAK locus used to create a FAKL994E KI mice. g, H&E and picrosirius red staining of mouse lung and skin tissues from WT and FAKL994E KI mice subjected to fibrosis models induced by bleomycin (BLM) injury. n = 5 mice per group. Scale bar, 100 μm. h, Collagen content after bleomycin treatment assessed by hydroxyproline. One-way ANOVA test. ***P < 0.001 versus WT. i,j, Quantification (i) and representative images (j) of durotaxis in isolated primary fibroblasts from bleomycin-treated FAKL994E KI and WT mice with n = 3 for each group. Student’s t-test. ***P < 0.001 versus WT. k, A schematic showing JP-153 treatment regimens (prophylactic or therapeutic, 5 mg kg−1 daily) in mice subjected to bleomycin-induced lung fibrosis. n = 6 mice for each group. l, Histological measure of fibrosis by Masson’s trichrome stain. m, Representative western blot (top) and densitometry (bottom) of P-FAK, FAK, P-paxillin and paxillin protein expression levels (normalized to β-actin). One representative out of three technical replicates is shown. n,o, The concentration of total (n) and active (o) TGF-β protein levels, as determined by ELISA. p, The concentration of total protein in bronchoalveolar lavage (BAL) fluid. q, Percentage of total cells in BAL fluid. r, Percentages of different immune cells, as determined by flow cytometry, in BAL fluid at 7 days post bleomycin with n = 4 mice for all groups. One-way ANOVA test. ***P < 0.001 versus vehicle. s,t, Number of α-SMA+ myofibroblasts (s) per cluster assessed by immunohistochemistry (t), n = 6 for all groups. Scale bar, 100 μm. One-way ANOVA test. *P < 0.05, ***P < 0.001 versus vehicle. u,v, Lung collagen content post bleomycin (u) and Masson’s trichrome (v) analysis with n = 6 for all groups. For animal experiments, data are given as mean ± s.d. Source data
Fig. 5
Fig. 5. Genetic inhibition of FAK–paxillin reduces tumour cell durotaxis and metastasis in a mouse model of pancreatic cancer.
a, A schematic of generating an orthotopic xenograft PDAC model in SCID mice. b, Representative immunohistochemistry showing tumour cells and CAFs at 15 days after inoculation. c, Detection of collagen type I and tumor fibrosis by Picrosirius red staining. d,e, AFM mapping (d) and its measurement as a function of distance (e) reveals increased matrix stiffness at the interface between the primary tumour and invasive front, featuring a steep stiffness gradient towards the TME (n = 6 for each group; scale bar, 100 μm). f, A schematic depicting hydrogels with mechanically patterned island of soft matrix (1 kPa) surrounded by alternating soft (1 kPa) and stiff (25 kPa) stripes used to visualize collective tumour cell durotaxis. g, Durotaxis assay on ‘island’ hydrogels. Data were obtained from three biological replicates. hk, Durotactic (h), chemotactic (i), invasion (j) and proliferation (k) index of quasi-mesenchymal (QM) or classical epithelial PDAC subtypes. n = 3 independent tumour cell lines per subset. l, Representative western blot of P-FAK, FAK, P-paxillin and paxillin protein expression levels (normalized to β-actin) in QM or classical epithelial tumour cells. n = 3 independent tumour cell lines per subset. One of three technical replicates shown. m, PLA demonstrating activated FAK–paxillinY31/118 signalling at the leading edge in durotaxing PDAC3 cells. Red dots indicate FAK–phospho-paxillin Y31 interactions, with F-actin (green, phalloidin) and nuclei (blue, DAPI). Scale bar, 10 µm. n, A representative western blot of genetically engineered control PDAC3 and PDAC3PxnY31E/Y118F tumour cells. n = 3 independent experiments. or, Proliferation (o), chemotactic (p), invasion (q) and durotactic (r) index of the WT PDAC3 tumour cell line (herein PDAC3PxnWT) compared with the mutated PDAC3PxnY31E/Y118F. s,t, In vivo tumorigenic assessment after orthotopic injection of PDAC3PxnWT and PDAC3PxnY31E/Y118F cells along with CAFs into the pancreas of SCID mice. Primary tumour growth and fibrosis evaluated by picrosirius red staining (s) and immunofluorescence (t) at day 15. n = 6 for each group. Scale bar, 100 μm. u,v, Quantification of fibrosis (u) and angiogenesis (v) in the primary pancreatic tumours (n = 6 for each group). w, Representative bioluminescence images of PDAC3PxnWT and PDAC3PxnY31E/Y118F tumours at days 2 and 15 after inoculation. Scale bar photon flux, luminescence (a.u.). n = 8 for each group. x, Proliferation curves of PDAC3PxnWT and PDAC3PxnY31E/Y118F tumours at days 2, 5, 9 and 15 after inoculation. y, Total, liver and gastrointestinal (GI) metastatic index at euthanasia. Data are given as mean ± s.d. from three independent experiments. Source data
Fig. 6
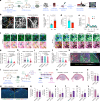
Fig. 6. Pharmacological inhibition of the FAK–paxillin pathway inhibits tumour cell durotaxis and metastasis in a mouse model of pancreatic cancer.
a, Workflow for two-photon microscopy. b, Second-harmonic generation (SHG) images of the collagen network at the tumour core (TC) and tumour invasive front (TIF) of tumour slices. ce, Collagen fibre width distribution (Student’s t-test; ****P < 0.0001 versus TC) (c), collagen fibre orientation distribution (Student’s t-test; ***P < 0.001 versus TC) (d) and collagen fibre curvature, defined by the curvature ratio, measured from SHG images at the TC and TIF areas (e). f, Representative two-photon images at the interfaces of TC and TIF of tumour slices treated with vehicle control or JP-153 for 2 days. Migratory YFP+ tumour cells (green/blue in top panel and circle in bottom panel) and SHG (grey). Tracks are colour-coded according to tumour cell displacement length. Frame interval, 20 min. Scale bar, 100 μm. gj, Quantification of YFP+ tumour cell motility in mean track length (g), mean track speed (h), mean track directionality (i) and invasion (j) into tumour stroma for treated groups at day 2 after administration. One-way ANOVA test. *P < 0.05, **P < 0.01, ****P < 0.0001. k, Representative multiplex immunofluorescence images of tumour slices after treatment with vehicle control, pertussis toxin or JP-153. Staining for tumour cells (green), α-SMA (red), collagen (white) and DAPI (blue). l, A schematic of the second syngeneic tumour model involving subcutaneous injection of the pancreatic mouse cancer line (KPC689) into C57BL/6J mice. m, A schematic showing JP-153 (durotaxis inhibitor, 5 mg ml−1, administered daily via topical microemulsion) treatment regimen in mice. n,o, The effect of JP-153 on subcutaneous flank tumour growth at 21 days, as assessed by H&E histological staining (n) and volume measurement (o). Representative experiment with n = 8 for each group. p, The effect of JP-153 on tumour fibrosis and angiogenesis in the primary tumour, assessed by immunohistochemistry. Staining for α-SMA (green), CD31 (red) and DAPI (purple). Scale bar, 100 μm. Student’s t-test. *P < 0.05 versus vehicle. q,r, Quantification of angiogenesis (q) and fibrosis (r) in the treated groups. su, The effect of JP-153 on monocytes (s), macrophages (t) and CD8+ T cells (u) in the primary tumour, assessed by flow cytometry (n = 6 for each group). Student’s t-test. *P < 0.05 versus vehicle. v, The number of lung metastases, assessed by picrosirius red staining. Scale bar, 100 μm. Student’s t-test. *P < 0.05 versus vehicle. For cell-based assays and animal experiments, data are given as mean ± s.d. from independent experiments. Source data
Extended Data Fig. 1
Extended Data Fig. 1. Increased collagen deposition in fibrotic tissues from mouse models of skin, lung, and kidney fibrosis.
(a,b,c) Hydroxyproline content (biochemical marker of collagen deposition) measured in the lungs, skin, and kidneys of mice subjected to the mouse models described in Fig. 1. Data are given as mean ± SD with n = 6 for each group. P value was determined by Student’s t test. Source data
Extended Data Fig. 2
Extended Data Fig. 2. Assessment of durotaxis in multiple human and mouse cells involved in tissue fibrosis on mechanically patterned hydrogels.
Durotaxis capacity was assessed on human fibroblasts isolated from skin (a), lungs (b), and kidneys (c), human hepatic stellate cells (d), human mesenchymal stem cells (e), human umbilical vein endothelial cells (HUVECs, f), mouse lung endothelial cells (MLEC, g), human embryonic kidney 293 cells (HEK 293, h), mouse pro-inflammatory M1 (i) and pro-fibrotic M2 polarized macrophages (j,k) and mouse T helper type 1 (Th1) and Th2 cells (k,l). Durotaxis was determined by quantifying the ratio of the number of cells accumulated on stiff versus soft stripes at 24 h after plating. Cells were identified by staining with phalloidin (red) to visualize F-actin and 4′,6-diamidino-2-phenylindole (DAPI; blue) to visualize nuclei. Representative images from 3 biological replicates. (m) Durotaxis capacity was assessed on epithelial and macrophages using laminin-coated substrates. Source data
Extended Data Fig. 3
Extended Data Fig. 3. Genetic or pharmacological inhibition of the FAK-PaxillinY31/118 pathway inhibits fibroblast durotaxis in vitro.
(a) Activation of the FAK-PaxillinY31/118 pathway at the leading edge of durotaxing fibroblasts, assessed by proximity ligation assay (PLA). Quantification from data shown in Fig. 3c. Data are given as mean ± SD with n = 5 for each group. P value was determined by Student’s t test. (b) Effect of lentiviral overexpression of paxillin mutants including constitutively active phosphomimetic paxillin (paxillinY31/118E), inactive non-phosphorylatable paxillin (paxillinY31/118F), or paxillin point mutant defective in vinculin binding (paxillinE151Q) on fibroblast durotaxis on mechanically patterned hydrogels. Red arrows indicate cells on stiff bars, whereas blue arrows mark cells on soft stripes. Representative images from 3 biological replicates. (c) Effect of JP-153 (300 nM) on FAK-Paxillin interaction in lung fibroblasts, assessed by PLA. Cells were identified by staining with phalloidin (green) to visualize F-actin and 4′,6-diamidino-2-phenylindole (DAPI; blue) to visualize nuclei. Red dots indicate FAK/phosphoPaxillin Y31 interaction. Scale bar 10 µm. Representative images from 8 biological replicates. (d,e) Dose response effect of JP-153 on fibroblast proliferation and survival at 48 h. (f) JP-153 has no effect on α-SMA expression or YAP cytoplasmic to nuclear translocation on stiffness-activated myofibroblasts. Fibroblasts were cultured on stiff-hydrogels (25 kPa) for 3 days and treated with or with JP-153 at 1 micromolar and 300 nM for addition 24 h. n = 3. Data are given as mean ± SD with n = 3 for each group. P value was determined by Student’s t test. Source data
Extended Data Fig. 4
Extended Data Fig. 4. Assessment of durotaxis in different fibroblast populations isolated from the bleomycin-induced lung fibrosis model.
(a-e) Co-registration of matrix stiffness by atomic force microscopy (AFM) and fibroblast position by immunofluorescence shows that GFP+α-SMA+ fibroblasts locate at areas of high stiffness, while GFP+α-SMA- fibroblasts reside in regions of lower stiffness. Pseudocolor imaging revealed low GFP expression levels (GFPlow) in lung fibroblasts compared to high GFP expression levels (GFPhigh) observed in α-SMA+ myofibroblasts. One representative experiment is presented from n = 4. Scale bar 20 µm. (f) Percentage of GFPhigh and GFPlow fibroblasts in healthy and fibrotic lungs. Representative experiment from n = 4 per group. (g) Assessment of durotactic capacity of GFPlow/α-SMA- fibroblasts and GFPhigh/α-SMA+ myofibroblasts isolated from fibrotic lungs via fluorescence-activated cell sorting (FACS), and GFPlow fibroblasts after passaging three times. These experiments used hydrogels fabricated by microfluidic gradient generator and cells were allowed to durotax for 7 days. Results showed that GFPlow fibroblasts and GFPhigh fibroblasts demonstrate very distinct durotactic capacities, while GFPlow fibroblasts durotax up stiffness gradients with great directionally, GFPhigh fibroblasts barely durotax in this in vitro system. (h,i) Assessment of collagen type I (Col1a1) and α-SMA (Acta2) mRNA levels by real time PCR in GFPhigh and GFPlow fibroblasts isolated from healthy and fibrotic lungs via fluorescence-activated cell sorting (FACS). (j,k) Assessment of fibroblast and myofibroblast proliferation in vivo by BrdU staining in Col-GFP mice at 21 days post-bleomycin challenge. Paraffin-embedded lung sections were stained for BrdU (orange), GFP (blue), α-SMA (yellow), and DAPI (purple) to visualize proliferating GFPhigh/α-SMA+ myofibroblasts and GFPlow/α-SMA- fibroblasts. One representative experiment from n = 5. Scale bar 100 μm. Source data
Extended Data Fig. 5
Extended Data Fig. 5. Genetic and pharmacological inhibition of the FAK-Paxillin pathway inhibits fibroblast durotaxis and fibrosis development in vivo.
(a) Body weight changes of bleomycin treated FAKL994E KI and WT mice as the disease progresses with n = 5 for each group. (b) Assessment of durotaxis in isolated primary fibroblasts from bleomycin treated FAKL994E KI and WT mice in the presence of absence of JP-153 with n = 3 for each group. (c) Representative images of isolated primary fibroblasts from bleomycin treated FAKL994E KI and WT mice in the presence of absence of JP-153 in durotaxis assay. Data are given as mean ± SD with n = 3 for each group. P value was determined by Student’s t test. Source data
Extended Data Fig. 6
Extended Data Fig. 6. Genetic or pharmacological inhibition of the FAK-Paxillin pathway inhibits tumor cell durotaxis in vitro and in vivo.
(a) Measurement of matrix stiffness in mouse pancreatic tissues by atomic force microscopy (AFM). AFM was applied to map local elastic properties of thin slices of fresh pancreatic samples prepared from the xenograft tumor model described in Fig. 5. Elastic modulus was measured in healthy pancreas, the primary pancreatic tumor, the tumor-tumor microenvironment border, and the tumor microenvironment (TME). Matrigel was used as control for mechanical measurements. Data are given as means ± SD with n = 6 for each group. P value was determined by Student’s t test. (b) The wild type PDAC3 tumor cell line (herein PDAC3PxnWT) was genetically engineered by transducing lentivirus encoding human Paxillin siRNA and mutated Y31E/Y118F chicken paxillin, effectively knocking down human paxillin while overexpressing mutated chicken paxillin (herein PDAC3PxnY31E/Y118F). Cells were stained with phalloidin (green) to visualize F-actin, total Paxillin and phospho-Paxillin Y31 (red) and 4′,6-diamidino-2-phenylindole (DAPI; blue) to visualize nuclei. Note the overexpression of total paxillin and lack of phospho-paxillin in the mutated PDAC3PxnY31E/Y118F line compared to PDAC3PxnWT. Scale bar 20 µm. Representative images from 4 biological replicates. (c) Assessment of durotaxis in PDAC3PxnY31E/Y118F, PDAC3PxnWT, PDAC3PxnWT treated with JP-153 (300 nM) at 24 h. Data are given as mean ± SD with n = 5 for each group. P value was determined by Student’s t test. (d) Measurement of matrix stiffness in mouse pancreatic tissues prepared from mice orthotopically injected with PDAC3PxnWT or PDAC3PxnY31E/Y118F tumor cell lines into the pancreas of SCID mice. Data are given as mean ± SD with n = 6 for all groups. Source data
Extended Data Fig. 7
Extended Data Fig. 7. Effect of genetic inhibition of the FAK-Paxillin pathway on angiogenesis, liver metastases and collagen fiber structure in vivo.
(a) Immunofluorescence showing tumor cell growth (GFP+ cells, red), myofibroblast formation (α-SMA+ cells, green), and angiogenesis (CD31+ cells, orange) in mouse pancreatic tissues prepared from mice orthotopically injected with PDAC3PxnWT or PDAC3PxnY31E/Y118F tumor cell lines into the pancreas of SCID mice. Representative images with n = 6 for each group. Scale bar 100 µm. (b) Histological analysis showing the higher number of liver metastasis in mice with PDAC3PxnWT tumor compared to PDAC3PxnY31E/Y118F tumor. Representative SHG images of tumor slices post-treatment with JP-153. (a) SHG images of the collagen network at the tumor core (TC) and tumor invasive front (TIF) of tumor slices. (b) Collagen fiber width distribution, (c) collagen fiber orientation distribution, and (d) collagen fiber curvature, defined by the curvature ratio, measured from SHG images at the TC and TIF areas. Data are given as mean ± SD with n = 6 for all groups. Source data
Extended Data Fig. 8
Extended Data Fig. 8. Effect of JP-153 on tumor cell invasion and fibrosis in vivo.
(a) Representative multiplex immunofluorescence images of tumor slices post-treatment with vehicle, pertussis toxin, or JP-153. Staining for tumor cells (green), α-SMA (red), collagen (white), and dapi (blue). (b) Staining for tumor cells (green), α-SMA (red), collagen hybridizing peptide (white), and dapi (blue). (c) Quantification of tumor fibrosis and α-SMA, shown as % Area. Source data
Extended Data Fig. 9
Extended Data Fig. 9. JP-153 has no effect on immune cells infiltration and changes in the basement membrane level.
(a) Immunofluorescence of laminin LN-β1, a component of nascent BMs, and LN-332, a component of mature BMs, early basement membrane marker in PDAC tumors. Data are given as mean ± SD with n = 6 for all groups. (b-f) Effect of JP-153 on the immune response in the primary tumor, assessed by flow cytometry (n = 6 for each group). Data are given as mean ± SD with n = 6 for all groups. (g) Lung metastases assessed by picrosirius red staining. Representative experiment with n = 6 for each group. Scale bar 100 μm. Source data
Extended Data Fig. 10
Extended Data Fig. 10. Effect of blocking FAK-Paxillin by JP-153 on tumor intrinsic STAT3 pathway.
Representative immunofluorescence staining for STAT3 (a) and pSTAT3 (b) in pancreatic tumor tissue after vehicle and JP-153 treatment. Please note that JP-153 did not affect the tumor intrinsic STAT3 signaling. Scale bar, 100 μm. Data are given as mean ± SD with n = 6 for all groups. Source data

References

    1. Lo, C. M., Wang, H. B., Dembo, M. & Wang, Y. L. Cell movement is guided by the rigidity of the substrate. Biophys. J.79, 144–152 (2000). - PMC - PubMed
    1. Sunyer, R. et al. Collective cell durotaxis emerges from long-range intercellular force transmission. Science353, 1157–1161 (2016). - PubMed
    1. Tse, J. R. & Engler, A. J. Stiffness gradients mimicking in vivo tissue variation regulate mesenchymal stem cell fate. PLoS ONE6, e15978 (2011). - PMC - PubMed
    1. Yang, C. et al. Spatially patterned matrix elasticity directs stem cell fate. Proc. Natl Acad. Sci. USA113, E4439–E4445 (2016). - PMC - PubMed
    1. Isenberg, B. C., Dimilla, P. A., Walker, M., Kim, S. & Wong, J. Y. Vascular smooth muscle cell durotaxis depends on substrate stiffness gradient strength. Biophys. J.97, 1313–1322 (2009). - PMC - PubMed

MeSH terms