. 2025 Oct;26(19):4847-4885.
doi: 10.1038/s44319-025-00558-7. Epub 2025 Sep 8.

Streptococcus pyogenes EVs induce the alternative inflammasome via caspase-4/-5 in human monocytes

Affiliations

Streptococcus pyogenes EVs induce the alternative inflammasome via caspase-4/-5 in human monocytes

Kathrin Krause et al. EMBO Rep. 2025 Oct.

Abstract

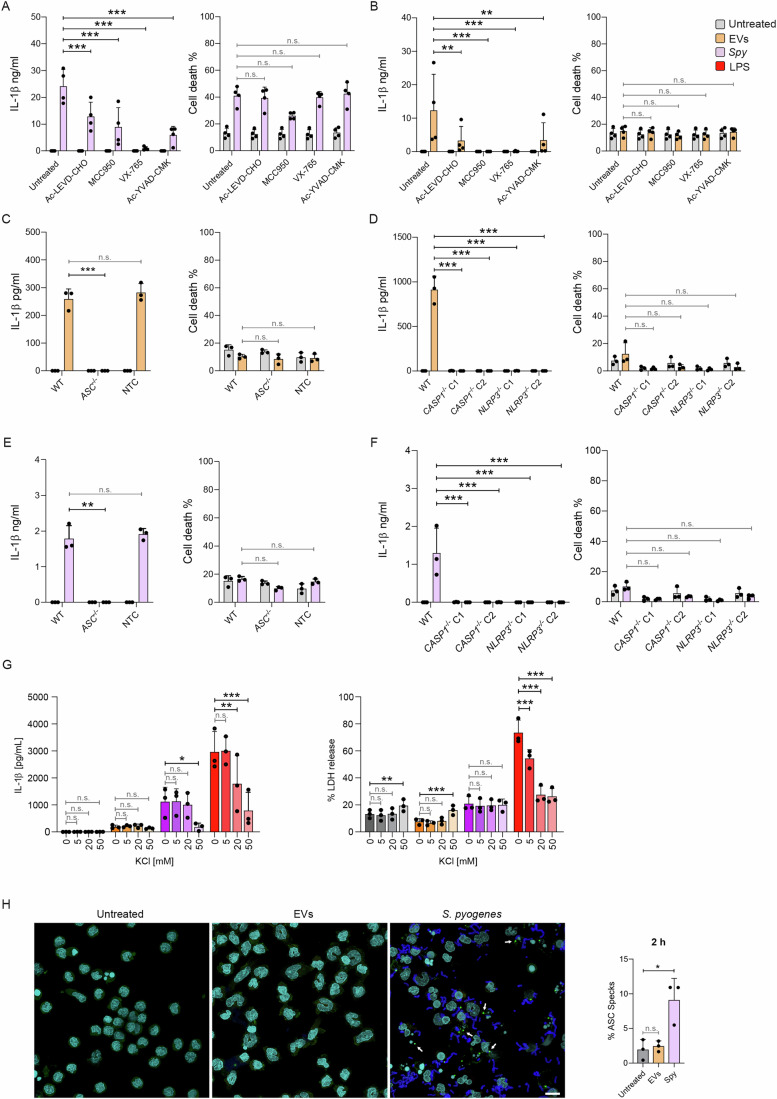
The sensing of Gram-negative Extracellular Vesicles (EVs) by the innate immune system has been extensively studied in the past decade. In contrast, recognition of Gram-positive EVs by innate immune cells remains poorly understood. Comparative genome-wide transcriptional analysis in human monocytes uncovered that S. pyogenes EVs induce proinflammatory signatures that are markedly distinct from those of their parental cells. Among the 209 genes exclusively upregulated by EVs, caspase-5 prompted us to study inflammasome signaling pathways in depth. We show that lipoteichoic acid (LTA), a structural component of Gram-positive bacterial membranes present on EVs from S. pyogenes and other Gram-positive species, is sensed by TLR2 which triggers the alternative inflammasome composed of NLRP3 and the inflammatory caspases-4/-5 to mount an IL-1β response without inducing cell death. For S. pyogenes, we identify TLR8 as a sensor to mediate caspase-4/-5-dependent IL-1β secretion. Notably, inflammasome activation by intact bacteria is independent of the global virulence regulator CovS in monocytes. Overall, our study highlights a new role for TLR2 and caspase-4/-5 in the recognition of Gram-positive EVs in human monocytes.

Keywords: Streptococcus pyogenes; Caspases; Extracellular Vesicles; Inflammasome; Monocytes.


Conflict of interest statement

Disclosure and competing interests statement. The authors declare no competing interests.

Figures

Figure 1
Figure 1. S. pyogenes EVs induce a distinct expression profile in monocytes.
(A) Schematic summary of the study design. Primary monocytes were purified through density gradient followed by magnetic negative selection. Four hours after S. pyogenes infection or challenge with its EVs, RNA from monocytes was purified and processed for RNA sequencing. (B) Principal component analysis of gene transcription colored by treatment. (C) Scatterplot comparison of Log2 fold change (FC) (treatment vs untreated control, Unt) in transcript abundance for S. pyogenes-infected (x axis) or EV-treated samples (y axis). Dashed lines mark cut-off criteria of a log2 FC > |2|. Grey dots represent transcripts commonly regulated but with an FC < |2|. Blue dots denote commonly regulated transcripts with a FC ≥ |2|. Orange and purple dots indicate differentially expressed genes for either EVs or S. pyogenes, respectively. Dashed areas indicate four distinct gene groups which meet our cut-off criteria that share (2 and 4) or display unique (1 and 3) transcription patterns for both or either stimulus, respectively. Representative genes in each group are highlighted. Wald test was applied for statistical analyses. (D) Venn diagrams summarizing unique and overlapping up- or downregulated genes with FC ≥ |2|. The top three genes for each category are displayed. (E) Heatmap of twenty representative genes from each gene group in (D). Data information: (BE) Data are representative of eight biological replicates. (CE) Graphs include gene transcription after 4 h upon EV or S. pyogenes stimulation compared to untreated monocytes. Genes were defined as differentially regulated when FC ≥ |2| as compared to untreated cells and the adjusted P value was <0.01 after Benjamini-Hochberg correction for multiple comparisons.
Figure 2
Figure 2. S. pyogenes EVs are recognized by caspase-4 and caspase-5.
(A, B) IL-1β, IL-6, IL-1α, and LDH released by monocytes after stimulation with either Spy EVs (A) or intact S. pyogenes (B) for 18 h. Monocytes were either preincubated with the caspase-4/-5 inhibitor Ac-LEVD-CHO or left untreated. The percentage of LDH released from the positive control is shown as a measure of cell death. Bars represent the mean ± standard deviation (SD) of four biological replicates. (A) P = 0.0385, (B) P = 0.0036, (C) Caspase-4/5 substrate cleavage in supernatants from monocytes after stimulation with Spy EVs or intact S. pyogenes. Bars represent the mean ± SD of six biological replicates. P = 0.0139 (EVs_3.5 × 109), P = 0.0024 (Spy MOI 5). (D) IL-1β released by BLaER1 cells after stimulation with either Spy EVs (left panel) or S. pyogenes (right panel) for 18 h. BLaER1 cell lines: wild-type (WT), Caspase-4 knock-out (KO, CASP4−/−), Caspase-5 KO (CASP5−/−, clones 1 and 2) and non-targeting control (NTC). Bars represent the mean ± SD of three biological replicates. (Left panel) P = 0.0034, P < 0.0001, P = 0.003. (Right panel) P = 0.0239, P = 0.0131, P = 0.0131. (E) Immunoblot analysis of cleavage products for caspase-1/4/5 in cell culture supernatants from human monocytes & macrophages. Cells were either left untreated or infected with S. pyogenes strains M1T1 5448, M1T1 5448 AP, ISS3348, or ISS3348 Δslo at MOI 5 (covS-: covS inactivation). Representative of four biological replicates. (F) Immunoblot, RTqPCR & ELISA analysis of IL-1β released by monocytes after stimulation with Spy EVs in the presence or absence of BafA1 (100 nM) for 2 h or 18 h. A dotted line indicates the mean expression of the housekeeping genes (GAPDH/TUBB). Representative of four biological replicates. P = 0.0254. (G) Immunoblot analysis of LC3 levels in human monocytes after stimulation with Spy EVs in the presence or absence of BafA1 (100 nM). Bars represent the mean ± SD of four biological replicates. P = 0.0132 (30’), P = 0.0151 (90’). Data information: (ABDG) Two-way ANOVA with Holm–Šídák correction for multiple comparisons was applied for statistical analyses. (C) Multiple t tests with Holm–Šídák correction for multiple comparisons. (F) One-way ANOVA with Holm–Šídák correction for multiple comparisons was applied for statistical analyses. *P ≤ 0.05, **P ≤ 0.01, ***P ≤ 0.001, n.s. not significant. Source data are available online for this figure.
Figure 3
Figure 3. EV-dependent cytokine release requires Toll-like receptor 2-mediated signaling.
(A) IL-1β, IL-6, and LDH in supernatants of BLaER1 WT, MYD88 KO (MYD88−/−), Toll-like receptor 2 KO (TLR2−/−) and NTC cells stimulated with Spy EVs for 18 h. Bars represent the mean ± SD of three biological replicates. (left panel, IL-1β) P < 0.0001 (MYD88−/−), P < 0.0001 (TLR2−/−). (middle panel, IL-6) P = 0.0019 (MYD88−/−), P = 0.0040 (TLR2−/−). (B) IL-1β, IL-6, and LDH released by BLaER1 WT, MYD88−/−, TLR2−/−, and NTC cells after 18 h stimulation with S. pyogenes. Bars represent the mean ± SD of three biological replicates. (left panel, IL-1β) P = 0.0017 (MYD88−/−). (Middle panel, IL-6) P = 0.0016 (MYD88−/−). (A, B) The percentage of LDH released from the positive control is shown as a measure of cell death. (C) IL-1β and IL-6 released by human monocytes that were either left untreated or preincubated with Ac-LEVD-CHO (caspase-4/5), GSK3145095 (RIPK1), TLR2-C29 (TLR2/1, TLR2/6), or CU-CPT22 (TLR2/6). Cells were then left unstimulated or challenged with Spy EVs or S. pyogenes for 18 h. Bars represent the mean ± SD of four biological replicates. (EVs, IL-1β) P = 0.0001, P = 0.0018, P = 0.0003, P = 0.0018. (EVs, IL-6) P = 0.0082. (Spy, IL-1β) P < 0.0001, P = 0.0437. (D) TLR2 activity in HEK-Blue TLR2 cells after stimulation with Spy EVs for 18 h. Baseline represents untreated cells. Bars represent the mean ± SD of four biological replicates. (7 × 108) P < 0.0001, (3.5 × 108) P < 0.0001, (7 × 107) P < 0.0001, (3.5 × 107) P = 0.0081. (E) IL-1β and IL-6 released by human monocytes that were either left untreated or preincubated with TLR inhibitors CLI-095 (TLR4), M5049 (TLR7/8, 0,1 µM = TLR7, 1 µM = TLR8), or TLR9-IN-1 (TLR9). Cells were then left unstimulated or infected with S. pyogenes for 18 h. Bars represent the mean ± SD of four biological replicates. P = 0.0048. (F) IL-1β and IL-6 released by human monocytes that were either left untreated or preincubated with the TLR8 inhibitor CU-CPT9a. Cells were then left unstimulated or infected with S. pyogenes for 18 h. Bars represent the mean ± SD of four biological replicates. P < 0.0001. (G) IL-1β and IL-6 released by human monocytes that were either left untreated or preincubated with the caspase-8 inhibitor Ac-IETD-CHO. Cells were then left unstimulated or challenged with Spy EVs, S. pyogenes, or LPS for 18 h. Bars represent the mean ± SD of four biological replicates. (EVs) P = 0.0043, (Spy) P = 0.0075, (LPS) P = 0.0043. Data information: (AC, EG) Two-way ANOVA was applied with Holm–Šídák correction for multiple comparisons. (D) One-way ANOVA was applied with Holm–Šídák correction for multiple comparisons. *P ≤ 0.05, **P ≤ 0.01, ***P ≤ 0.001, n.s. not significant. Source data are available online for this figure.
Figure 4
Figure 4. The NLRP3 inflammasome contributes to IL-1β and LDH release upon recognition of S. pyogenes EVs.
(A, B) IL-1β and IL-6 released by human monocytes that were either left untreated or preincubated with Ac-LEVD-CHO, MCC950, VX-765, or Ac-YVAD-CMK. Cells were then left unstimulated or stimulated with either S. pyogenes (A) or Spy EVs (B) for 18 h. Bars represent the mean ± SD of four biological replicates. (A) P < 0.0001 (for all comparisons). (B) P = 0.0068, P = 0.0006, P = 0.0006, P = 0.0076. (C, D) IL-1β and LDH were measured in supernatants of BLaER1 WT, PYCARD KO (ASC-/-), Caspase-1 KO (CASP1−/− clone 1 and 2), NLRP3 KO (NLRP3−/− clone 1 and 2), and NTC cells after 18 h either left untreated or stimulated with Spy EVs. Bars represent the mean ± SD of three biological replicates. (C) P = 0.0010. (D) P < 0.0001 (for all comparisons). (E, F) IL-1β and LDH were measured in supernatants of BLaER1 WT, ASC−/−, CASP1−/− clone 1 and 2, NLRP3−/− clone 1 and 2, and NTC cells after 18 h either left untreated or stimulated with S. pyogenes. Bars represent the mean ± SD of three biological replicates. (E) P = 0.0016. (F) P = 0.0003 (for all comparisons). (G) IL-1β and LDH in supernatants from BLaER1 WT cells after 18 h, either left untreated or stimulated with Spy EVs, S. pyogenes, or LPS (200 ng/mL). Bars represent the mean ± SD of three biological replicates. (IL-1β) P = 0.0177 (Spy, 50 mM), P = 0.0017 (LPS, 20 mM), P < 0.0001 (LPS, 50 mM). (LDH) P = 0.0084 (Untreated, 50 mM), P = 0.0007 (EVs, 50 mM), P < 0.0001 (LPS, all comparisons). (H) Immunofluorescence staining and corresponding quantification results for ASC speck formation in human monocytes either left untreated or stimulated with Spy EVs or S. pyogenes for 2 h (scale bar: 10 µm). White arrows indicate ASC specks. Bars represent the mean ± SD of three biological replicates. P = 0.0103. Data information: (AG) The percentage of LDH released from the positive control is shown as a measure of cell death. Two-way ANOVA was applied with Holm–Šídák correction for multiple comparisons. (H) One-way ANOVA was applied with Holm–Šídák correction for multiple comparisons. *P ≤ 0.05, **P ≤ 0.01, ***P ≤ 0.001, n.s. not significant. Source data are available online for this figure.
Figure 5
Figure 5. Lipoteichoic acid conserved in Gram-positive EVs promotes caspase-4/-5-dependent IL-1β secretion.
(A) S. pyogenes cells imaged by Scanning Electron Microscopy and immunogold staining (SEM, scale bar = 200 nm). (B) Immunogold-labelling of surface lipoteichoic acid from purified Spy EVs (LTA clusters indicated with white arrows, scale bar = 200 nm). (C) Immunoblot analysis of LTA in Spy EVs. (D) IL-1β in supernatants from monocytes either left untreated or preincubated with Ac-LEVD-CHO prior to the addition of S. pyogenes LTA after 18 h. Bars represent the mean ± SD of four biological replicates. P = 0.0181. (E) IL-1β in supernatants from BLaER1 cells either left untreated or preincubated with Ac-LEVD-CHO prior to the addition of S. pyogenes LTA after 18 h. Bars represent the mean ± SD of three biological replicates. P = 0.0177. (F) IL-1β release at 18 h from monocytes that were left untreated or treated with S. pyogenes LTA, either directly applied (LTA) or transfected using Lipofectamine LTX (LTx:LTA). Bars represent the mean ± SD of four biological replicates. (G) TLR2 activity in HEK-Blue TLR2 cells after stimulation with Spy LTA for 18 h. Baseline represents untreated cells. Bars represent the mean ± SD of four biological replicates. (H) Immunoblot, RTqPCR & ELISA analysis of IL-1β released by monocytes after stimulation with S. pyogenes LTA in the presence or absence of BafA1 (100 nM) for 2 h or 18 h. Bars represent the mean ± SD of four biological replicates. P = 0.0067. (I) Immunoblot analysis of LC3 levels in human monocytes after stimulation with S. pyogenes LTA in the presence or absence of BafA1 (100 nM). Bars represent the mean ± SD of four biological replicates. P = 0.0412 (30’), P = 0.0143 (60’), P = 0.0002 (90’). (J) IL-1β release at 18 h from monocytes either left untreated or preincubated with Ac-LEVD-CHO before the addition of EVs from S. aureus (left), S. agalactiae (middle), or B. subtilis (right). Bars represent the mean ± SD of four biological replicates. P = 0.0164 (S. aureus), P = 0.0099 (S. agalactiae). (K) IL-1β and IL-6 in supernatants from monocytes or BLaER1 cells either left untreated or stimulated with Spy EVs isolated −/+ LtaS-IN-1771 for 18 h. Bars represent the mean ± SD of three biological replicates. (Primary, IL-1β) P = 0.0003 (both comparisons). (Primary, IL-6) P < 0.0001 (both comparisons). (BLaER1, IL-1β) P = 0.0005, P = 0.0160, P = 0.0044. (BLaER1, IL-6) P = 0.0005, P = 0.0051, P = 0.0161. Data information: (D, E, I) Two-way ANOVA was applied with Holm–Šídák correction for multiple comparisons. (F, H, K) One-way ANOVA was applied with Holm–Šídák correction for multiple comparisons. (J) Statistical significance was assessed using paired t tests. *P ≤ 0.05, **P ≤ 0.01, ***P ≤ 0.001, n.s. not significant. Source data are available online for this figure.
Figure 6
Figure 6. Spy EVs isolated using size exclusion chromatography partially recapitulate the monocyte response against conventional EV preparations.
(A) LTA concentration in double-filtered S. pyogenes culture supernatants before and after ultracentrifugation. Bars represent the mean ± SD of four biological replicates. P = 0.0080. (B) IL-1β, IL-6, and LDH released by monocytes after 18 h stimulation with either Spy EVs, THB medium, or EV-depleted supernatants (SUP) derived from either S. pyogenes WT or Δslo mutant strains. The percentage of LDH released from the positive control is shown as a measure of cell death. Bars represent the mean ± standard deviation (SD) of four biological replicates. (IL-1β) P < 0.0001. (IL-6) P < 0.0001 (THB, all comparisons), P = 0.0020, P = 0.0002, P < 0.0001. (LDH) P < 0.0001 (all comparisons). (C) Immunoblot of Slo and LTA in EV-depleted supernatants from S. pyogenes WT (4 biological replicates) or Δslo mutant strains. THB media was used as negative control. (D) Venn diagram & immunoblots for EV-depleted supernatants. The Venn diagram shows protein expression in ultracentrifuged EV preparations (EV UC) vs. EV-depleted supernatants. Numbers indicate the total amount of proteins for each category. Immunoblots display caspase-3 cleavage and phospho-p44/42 MAPK in human monocytes after 18 h stimulation with either Spy EVs, THB medium, or EV-depleted supernatants (SUP) derived from either S. pyogenes WT or Δslo mutant strains. Representative of four biological replicates. (E) LTA and protein concentration in 28 fractions of double-filtered S. pyogenes culture supernatant fractionated using size exclusion chromatography. Bars represent the mean ± standard deviation (SD) of three biological replicates. Immunoblot shows LTA present in fractions 8–28. (F) Venn diagrams showing protein expression in ultracentrifuged EV preparations (EV UC) vs. pooled SEC fractions 8–16 (EVs) or 17–28 (soluble), respectively. (G) Concentration, size, and zeta potential of Spy EVs analyzed with the exoid instrument. Bars represent the mean ± SD of three biological replicates. (H) LTA concentration in EVs UC vs. EVs SEC (left panel). Bars represent the mean ± SD of four vs. two biological replicates. LDH (middle panel) and IL-6 (right panel) released by human monocytes treated with Spy EVs isolated using SEC for 18 h. Bars represent the mean ± SD of seven biological replicates with pooled EV fractions from 2 SECs (black circles: SEC1 F8-16; grey circles: SEC2 F8-15). P = 0.0299 (LDH), P = 0.0003 (IL-6). (I) TLR2 activity in HEK-Blue TLR2 cells after stimulation with Spy EVs isolated using SEC for 18 h. Baseline represents untreated cells. Bars represent the mean ± SD of eight biological replicates with pooled EV fractions from 2 SECs (black circles: SEC1 F8-16; grey circles: SEC2 F8-15). P = 0.0007, P = 0.0071. (J) Immunoblots displaying caspase-3 cleavage, phospho-p44/42 MAPK, and caspase-5 expression in human monocytes after 18 h stimulation with Spy EVs isolated using SEC. Representative of four biological replicates. Data information: (A, G, H) Statistical significance was assessed using unpaired t test. (B, H) Owo-way ANOVA was applied with Holm–Šídák correction for multiple comparisons. *P ≤ 0.05, **P ≤ 0.01, ***P ≤ 0.001, n.s. not significant. Source data are available online for this figure.
Figure EV1
Figure EV1. Purification, quantification, and characterization of bacterial EVs used in this study.
(A) Schematic protocol of the purification strategy used for EVs. (B) Mean size (left) and concentration (right) of Spy EVs (n = 15) characterized by nanoparticle tracker analysis (NTA). (C) Linear correlation between particles/mL (measured by NTA) and the amount of protein of the same batches (Bradford assay, n = 15). (D) LPS analysis of EV preparations separated by SDS PAGE followed by Pro-Q Emerald 300 staining. Smooth LPS standard from E. coli serotype O55:B5 with characteristic ladder pattern was used as positive control. (E) Spy EV preparation imaged by transmission electron microscopy (TEM, scale bar: 1 µm). (F) IL-1β and IL-6 released by human monocytes stimulated with increasing amounts of Spy EVs for 18 h. Bars represent the mean ± SD of six biological replicates. P < 0.0001 (for all comparisons). Data information: (F) One-way ANOVA was applied with Holm–Šídák correction for multiple comparisons. ***P ≤ 0.001, n.s. not significant.
Figure EV2
Figure EV2. RNA sequencing of monocytes: pathway analysis and RTqPCR of specific genes.
(A) Scatterplot comparison of Log2 fold change (FC) (treatment vs untreated control, Unt) in transcript abundance for S. pyogenes-infected (x-axis) or EV-treated samples (y-axis) in BLaER1 cells (related to Fig. 1). Grey dots represent transcripts commonly regulated but with an FC < | 2 | . Blue dots denote commonly regulated transcripts with a FC ≥ | 2 | . Orange and purple dots indicate differentially expressed genes for either Spy EVs or S. pyogenes, respectively. (B) Venn diagrams of differentially transcribed genes in BLaER1 cells after stimulation with Spy EVs or S. pyogenes for 4 h. Numbers indicate the total amount of genes for each category. (C, D) Top ten upregulated KEGG pathways (C) or GO terms (D) are shown for Spy EV-treated versus untreated monocytes and S. pyogenes-treated versus untreated monocytes. Solid lines indicate same pathway and dashed lines indicate a related pathway. (EH) Quantitative real time PCR of selected genes. Floating bar plots displaying the negative ΔCt values of three biological replicates. The central line represents the mean, the borders represent the minimum and the maximum values. A dotted line indicates the mean expression of the housekeeping genes (GAPDH/TUBB). (E) Genes upregulated by Spy EV treatment. (WNT5A) P = 0.0029, P = 0.0004. (CASP5) P = 0.0028. (F) Genes upregulated by S. pyogenes and Spy EV treatments. (IL1A) P = 0.0003 (for both comparisons). (CCL4) P = 0.0014 (for both comparisons). (G) Genes upregulated by S. pyogenes treatment. (IFNG) P = 0.0025. (IFNB) P = 0.0308. (H) Genes downregulated for both S. pyogenes and Spy EV treatments. (CCR2) P = 0.0055 (Spy), P = 0.0010 (EVs). (PTGRFN) P = 0.0130 (for both comparisons). Data information: (EH) One-way ANOVA with Holm–Šídák correction for multiple comparisons was applied for statistical analyses. *P ≤ 0.05, **P ≤ 0.01, ***P ≤ 0.001, n.s. not significant.
Figure EV3
Figure EV3. BLaER1 knock-out characterization.
(A) Quantitative real time PCR of selected genes in human monocytes. Shown are mean ± SD of three biological replicates. A dotted line indicates the mean expression of the housekeeping genes (GAPDH/TUBB). (CASP5) P = 0.0013 (−), P = 0.0018 (+). (IL1B) P = 0.0006 (EVs for both comparisons), P = 0.0001 (Spy, for both comparisons). (IL6) P = 0.0001 (EVs for both comparisons), P < 0.0001 (Spy, for both comparisons). (B) Immunoblot analysis of pro-IL-1β in human monocytes. Cells were either left untreated or preincubated with the caspase-4/-5 inhibitor Ac-LEVD-CHO. Representative of three biological replicates. (C) IL-1β in response to LPS in supernatants from human monocytes either left untreated or preincubated with Ac-LEVD-CHO at 18 h. Shown are mean ± SD of three biological replicates. P < 0.0001 (D) Graphical representation of the differentiation protocol of BLaER1 cells as well as CRISPR-Cas9 mutagenesis of BLaER1 cells. The existence of frameshift mutations on each allele of the CASP4−/−, CASP5−/−, TLR2−/−, CASP1−/−, and NLRP3-/- clones was assessed using next generation sequencing. The guide RNAs used for genome editing are shown in the Reagents and Tools Table. Mass spectrometry analysis was used to confirm the absence of caspase-4 and caspase-5 from their respective KO clones compared to wild-type or non-targeted control (NTC) BLaER1 cells. (EH) IL-6 and LDH released from BLaER1 WT, caspase-4 KO (CASP4−/−), caspase-5 KO clones 1 and 2 (CASP5−/− C1 or C2), and non-targeted cells (NTC). BLaER1 cells were left untreated or were stimulated for 18 h with either Spy EVs or S. pyogenes. The percentage of LDH released from the positive control is shown as a measure of cell death. Bars represent the mean ± SD of three biological replicates. Data information: (A, C, EH) Two-way ANOVA with Holm–Šídák correction for multiple comparisons was applied for statistical analyses. **P ≤ 0.01, ***P ≤ 0.001, n.s. not significant.
Figure EV4
Figure EV4. Cytokine controls and cell death of monocytes and BLaER1 cells: canonical inflammasome.
(A) IL-6 in supernatants from human monocytes either left untreated or preincubated with Ac-LEVD-CHO, MCC950, VX-765, or Ac-YVAD-CMK. Cells were then left unstimulated or challenged with S. pyogenes or its EVs for 18 h. Bars represent the mean ± SD of four biological replicates. P = 0.0011. (B, C) IL-6 released from BLaER1 WT, PYCARD KO (ASC−/−), NLRP3 KO clones 1 and 2 (NLRP3−/−), Caspase-1 KO clones 1 and 2 (CASP1−/−), and non-targeted control (NTC) cells stimulated with Spy EVs or infected with S. pyogenes for 18 h. Bars represent the mean ± SD of three biological replicates. (D) Box plot showing caspase and NLRP protein levels differentially expressed in BLaER1 cells (5 biological replicates) and primary human monocytes (4 biological replicates). Each dot represents the protein level of an individual sample. The boxplot displays the distribution of the data with the box representing the interquartile range (IQR) between the 25th (Q1) and 75th (Q3) percentiles. The line inside the box indicates the median (50th percentile). Whiskers extend to the smallest and largest values within 1.5 × IQR below Q1 and above Q3, respectively. Data points outside this range are shown individually as outliers. In total, 6472 proteins were quantified in at least 3 biological replicates of BLaER1 cells, and 6092 proteins were quantified in primary monocytes. (E) Immunoblots displaying GSDMD and IL-1β in human monocytes either left untreated or challenged with Spy EVs or S. pyogenes for 18 h. Representative of four biological replicates. Data information: (AC) Two-way ANOVA with Holm–Šídák correction for multiple comparisons was applied for statistical analyses. **P ≤ 0.01, n.s. not significant.
Figure EV5
Figure EV5. Cytokine controls and cell death of monocytes and BLaER1 cells: role of LTA in EV-dependent monocyte activation.
(A) IL-6 and LDH release at 18 h from monocytes that were left untreated or incubated with Ac-LEVD-CHO before the addition of S. pyogenes LTA. Shown are mean ± SD of four biological replicates. P = 0.0069. (B) IL-6 and LDH release at 18 h from BLaER1 cells that were left untreated or incubated with Ac-LEVD-CHO prior to addition of purified S. pyogenes LTA. Shown are mean ± SD of three biological replicates. (C) IL-6 and LDH release at 18 h from monocytes that were left untreated or treated with S. pyogenes LTA, either directly applied (LTA) or transfected using Lipofectamine LTX (LTx:LTA). Shown are mean ± SD of four biological replicates. (D) IL-1β and IL-6 release at 18 h from monocytes that were left untreated or incubated with Ac-LEVD-CHO before the addition of S. aureus LTA. Shown are mean ± SD of four biological replicates. P = 0.0374. (E) Quantitative real time PCR of CASP5 and CASP4. Shown are mean ± SD of three biological replicates. A dotted line indicates the mean expression of the housekeeping genes (GAPDH/TUBB). P < 0.0001 (for all comparisons). (F) TLR2 activity in HEK-Blue TLR2 cells after stimulation with S. aureus LTA for 18 h. Baseline represents untreated cells. Bars represent the mean ± SD of four biological replicates. (G) IL-1β and IL-6 released by human monocytes that were either left untreated or preincubated with the caspase-8 inhibitor Ac-IETD-CHO. Cells were then left unstimulated or treated with S. pyogenes LTA for 18 h. Bars represent the mean ± SD of four biological replicates. P = 0.0066. (H) Mean size and particles/mL of S. pyogenes, S. aureus, B. subtilis, and S. agalactiae EVs (n = 2). (I) IL-6 and LDH release from monocytes either left untreated or preincubated with Ac-LEVD-CHO before the addition of EVs from S. aureus, S. agalactiae, or B. subtilis for 18 h. Shown are mean ± SD of four biological replicates. (J) Immunoblot analysis of LTA in bacterial pellets treated −/+ LtaS-IN-1771 and particles/mL of corresponding S. pyogenes EVs. Representative image of 2 biological replicates is shown. (K) S. pyogenes growth in the presence of LtaS-IN-1771 in THB media. Shown are mean ± SD of three biological replicates. (3 h) P = 0.0010, (4h-8h) P < 0.0001. Data information: (ABDEGK) Two-way ANOVA was applied with Holm–Šídák correction for multiple comparisons. (C) One-way ANOVA was applied with Holm–Šídák correction for multiple comparisons. (IH) Statistical significance was assessed using paired t tests. *P ≤ 0.05, **P ≤ 0.01, ***P ≤ 0.001, n.s. not significant.

References

    1. Anand PK, Tait SWG, Lamkanfi M, Amer AO, Nunez G, Pagès G, Pouysségur J, McGargill MA, Green DR, Kanneganti T-D (2011) TLR2 and RIP2 pathways mediate autophagy of Listeria monocytogenes via extracellular signal-regulated kinase (ERK) activation. J Biol Chem 286(50):42981–42991 - PMC - PubMed
    1. Andrei C, Dazzi C, Lotti L, Torrisi MR, Chimini G, Rubartelli A (1999) The secretory route of the leaderless protein interleukin 1β involves exocytosis of endolysosome-related vesicles. Mol Biol Cell 10(5):1463–1475 - PMC - PubMed
    1. Ashburner M, Ball CA, Blake JA, Botstein D, Butler H, Cherry JM, Davis AP, Dolinski K, Dwight SS, Eppig JT et al (2000) Gene ontology: tool for the unification of biology. Nat Genet 25:25–29 - PMC - PubMed
    1. Bankhead P, Loughrey MB, Fernández JA, Dombrowski Y, McArt DG, Dunne PD, McQuaid S, Gray RT, Murray LJ, Coleman HG et al (2017) QuPath: open source software for digital pathology image analysis. Sci Rep 7(1):16878 - PMC - PubMed
    1. Biagini M, Garibaldi M, Aprea S, Pezzicoli A, Doro F, Becherelli M, Taddei AR, Tani C, Tavarini S, Mora M et al (2015) The human pathogen Streptococcus pyogenes releases lipoproteins as lipoprotein-rich membrane vesicles. Mol Cell Proteom 14(8):2138–2149 - PMC - PubMed

MeSH terms

LinkOut - more resources