. 2025 Sep 9:10.1038/s41587-025-02772-z.
doi: 10.1038/s41587-025-02772-z. Online ahead of print.

Antibody-bottlebrush prodrug conjugates for targeted cancer therapy

Affiliations

Antibody-bottlebrush prodrug conjugates for targeted cancer therapy

Bin Liu et al. Nat Biotechnol. .

Abstract

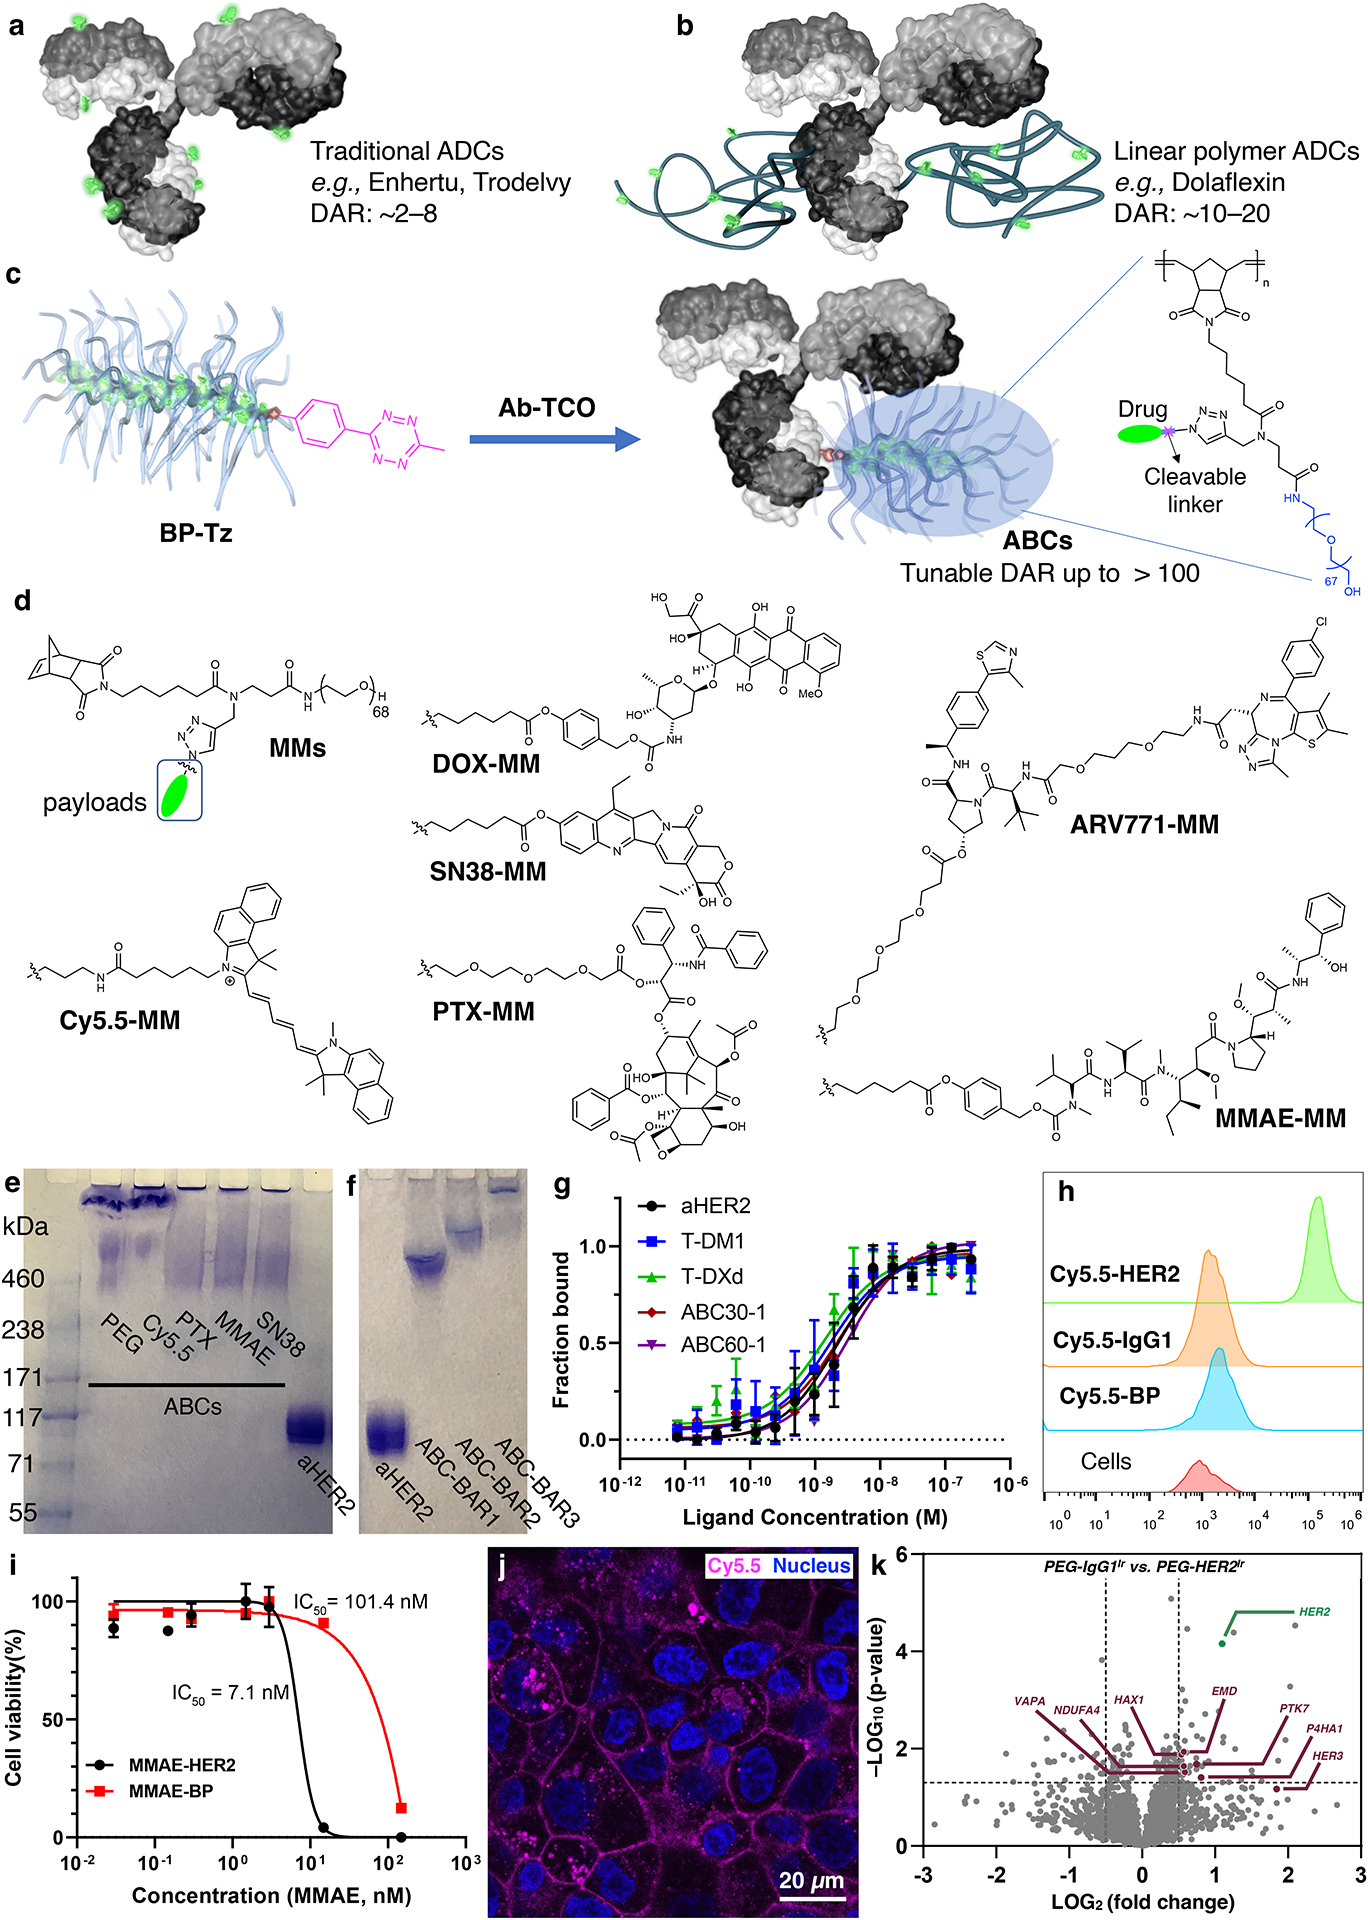
Antibody-drug conjugates (ADCs) are effective targeted therapeutics but are limited in their ability to incorporate less-potent payloads, varied drug mechanisms of action, different drug release mechanisms and tunable drug-to-antibody ratios. Here we introduce a technology to overcome these limitations called 'antibody-bottlebrush prodrug conjugates' (ABCs). An ABC consists of an IgG1 monoclonal antibody covalently conjugated to the terminus of a compact bivalent bottlebrush prodrug that has payloads bound through cleavable linkers and polyethylene glycol branches. This design enables the synthesis of ABCs with tunable average drug-to-antibody ratios up to two orders of magnitude greater than those of traditional ADCs. We demonstrate the functional flexibility and manufacturing efficiency of this technology by synthesizing more than 10 different ABCs targeting either HER2 or MUC1 using drugs with potencies spanning several orders of magnitude as well as imaging agents for ABC visualization and photocatalysts for proximity-based labeling of the ABC interactome. ABCs display high target engagement, high cell uptake and improved efficacy in tumor models compared to conventional HER2-targeted ADCs, suggesting promise for clinical translation.


Conflict of interest statement

Competing interests: J.A.J., H.V.-T.N. and Y.J. are shareholders of Window Therapeutics. D.W.C.M. declares an ownership interest in Dexterity Pharma, which has commercialized materials used in this work. The remaining authors declare no competing interests.

Figures

Extended Data Figure 1.
Extended Data Figure 1.. ABC synthesis using different stoichiometries of BP-Tz and Ab-TCO.
a. Non-reducing SDS-PAGE analysis of model IgG1-based ABCs as a function of synthesis stoichiometry. BAR = brush–antibody ratio. b. Non-reducing SDS-PAGE analysis of Trastuzumab-based ABCs as a function of synthesis stoichiometry. c. Flow cytometry histograms showing Cy5.5-HER2 uptake into HER2+ BT-474 cells as a function of synthesis stoichiometry (i.e., the constructs are present as a mixture of BAR values). The x-axis represents the Cy5.5 fluorescence intensity. Since the number of Cy5.5 dyes per ABC increases with BAR, histograms are normalized to the total Cy5.5 loading for each construct to enable comparison (normalized to 40 µg/mL Cy5.5-BP, 1 h). d. Flow cytometry histograms for the same constructs shown in panel c normalized by antibody dose (normalized to 10 µg/mL mAb, 1 h). The x-axis represents the Cy5.5 fluorescence intensity. e. and f. Flow cytometry histograms for BT-474 cell uptake of isolated Cy5.5-HER2 ABCs with different BAR values (25 µg/mL, 1 h) (i.e., ABCs with each BAR were separated from the synthesis mixture. Results are presented as mean ± SEM (n = 3 biological replicates). Statistical analysis was done using a 2-tailed t-test. For these statistical tests, **** denotes P  < 0.001.
Extended Data Figure 2.
Extended Data Figure 2.. HER2-targeted ABCs synthesized via site-specific cysteine conjugation.
a. Non-reducing SDS-PAGE analysis of site-specific Cy5.5-HER ABCs. Two independent experiments were performed with similar results. b. Flow cytometry histograms showing enhance BT474 cell uptake for site-specific Cy5.5-HER2 ABC compared to BPD alone. The x-axis represents the Cy5.5 fluorescence intensity. c. and d. Quantification of cell uptake based on mean fluorescence intensity from flow cytometry (n = 3 biological replicates). e. and f. Flow cytometry histogram (The x-axis represents the Cy5.5 fluorescence intensity.) and quantification, respectively, for cell uptake studies comparing site-specific Cy5.5-HER2 to stochastically functionalized lysine-based Cy5.5-HER2 ABC with BAR of 1 (BT474 cells, 20 µg/mL, 60 min incubation). Both ABCs have the same 5% Cy5.5 concentration. ABCK is the lysine-conjugated Cy5.5-HER2 ABC prepared from commercial Trastuzumab. We note that this ABC was stored at 4 °C for ~1.5 years prior to this study, demonstrating excellent long-term storage stability. T-ABCK is a stochastic Lys conjugate prepared using the engineered Trastuzumab designed for cysteine conjugation; this construct is designed to rule out differences in cell uptake between Lys-conjugated commercial Trastuzumab and the engineered antibody. Finally, T-ABCC is the site-specific cysteine conjugate Cy5.5-HER2. Results are presented as mean ± SEM (n = 3 biological replicates). Statistical analysis was done using a 2-tailed t-test. For these statistical tests, NS denotes non-significant; **, P  < 0.01.
Extended Data Figure 3.
Extended Data Figure 3.. HER2+ BT474 cell uptake and toxicity experiments comparing C5.5-labeled constructs.
a. Cell uptake studies compared Cy5.5-HER2 to non-targeted controls Cy5.5-IgG1 and Cy5.5-BP each containing 1% Cy5.5 loading (40 µg/mL, 60 min incubation, BAR = 3 for ABCs). The x-axis represents the Cy5.5 fluorescence intensity. b. Cell uptake for similar constructs with 5% Cy5.5 loadings (40 µg/mL, 60 min incubation, BAR = 3 for ABCs). The x-axis represents the Cy5.5 fluorescence intensity. c. Cytotoxicity of PTX-HER2 ABC compared to non-targeted PTX-BP (BPD only), a mixture of PTX-BPD and Trastuzumab (aHER2), and Trastuzumab (aHER2) alone for 24 h incubation. Results are presented as mean ± SEM (n = 3 biological replicates). The ABC PTX-HER2 displays improved cytotoxicity compared to controls. d. Confocal fluorescence microscopy images showed improved cell engagement and uptake for Cy5.5-HER2 compared to non-targeted controls (50 μg/mL, 6 h incubation, 1% Cy5.5 labeled ABC). Two independent experiments were performed with similar results.
Extended Data Figure 4.
Extended Data Figure 4.. In vitro targeting abilities of ABCs across cell lines with different HER2 expression.
a) Flow cytometry histograms demonstrating that Cy5.5-HER2 ABC uptake is dependent on HER2 expression. The x-axis represents the Cy5.5 fluorescence intensity. Cell uptake was studied using cell lines with varied HER2 expression: MCF-10A (HER2–); SKOV-3 (HER2 medium); SKBR-3 (HER2 high). Cells were treated with Cy5.5-HER2 ABC or non-targeting Cy5.5-BP polymer (1% Cy5.5 labeling) under the conditions listed at the bottom of the figure (varied times and concentrations). (b-d) Cytotoxicity results for HER2-targeted ABCs comprising different payloads in cell lines with varied HER2 expression. Results are presented as mean ± SEM (n = 3 biological replicates). b. MTT assay results for PTX-HER2 compared to non-targeted PTX-BP in HER2 high, medium, and negative (from left to right), respectively, cell lines following 24 h and 72 h incubation. c. HER2+ SKBR3 cell viability results for ABCs with different payloads (from left to right: MMAE, SN-38, and DOX). d. HER2– MCF-10A cell viability results for ABCs with different payloads (from left to right: MMAE, SN-38, and DOX).
Extended Data Figure 5.
Extended Data Figure 5.. Imaging of cell uptake and payload release in BT-474 cells.
a. Confocal fluorescence images of BT-474 cells incubated with Cy5.5-HER2 ABC (20 μg/mL) for different times. b. Confocal fluorescence images of BT-474 cells incubated with “theranostic” ABC SN38-Cy5.5-HER2 (50 μg/mL) for different times. White arrows point to cell nuclei where SN38 has localized following release from the ABC. In panels a and b, 4 h + 24 h and 4 h + 72 h mean that the cells were incubated with Cy5.5-HER2 or SN38-Cy5.5-HER2, respectively, for 4 h. Then, the cells were washed with PBS buffer three times and then further incubated for an additional 24 h or 72 h before imaging. Two independent experiments were performed with similar results.
Extended Data Figure 6.
Extended Data Figure 6.. Proposed ABC cell uptake and drug release mechanism.
First, ABCs bind to the cell surface through antibody-antigen interactions (upper left). Then, bound ABCs enter the cells through receptor-mediated endocytosis. Inside the endosome or lysosome, covalently attached payloads are released with rapid kinetics and subsequently diffuse to regions of the cell (e.g., the nucleus or cytosol) to perform their MoA. Graphic created with BioRender.com.
Extended Data Figure 7.
Extended Data Figure 7.. Time-dependent biodistribution (BD) studies.
a. Ex vivo images of organs from mice (n = 3) at different time points following administration Cy5.5-HER2 and non-targeted controls Cy5.5-IgG1 and Cy5.5-BP. b. Quantification of time-dependent BD for targeted and non-targeted constructs as quantified by fluorescence imaging. The bottom bar graphs correspond to the tumor fluorescence signals for different treatment groups, showing substantially greater tumor accumulation for HER2-targetd ABC Cy5.5-HER2. Results are presented as mean ± SEM (n = 3 biological replicates). Statistical analysis was done using a 2-tailed t-test. For these statistical tests, NS denotes non-significant; *, P  < 0.05; **, P < 0.01.
Extended Data Figure 8.
Extended Data Figure 8.. In vitro and in vivo evaluation of the anticancer efficiency of ABCs with different payloads on BT-474 cells or xenograft tumor model.
a. Cell viability studies for ABCs with different payloads compared to their nontargeting BPs (top and middle row, from left to right: MMAE, SN-38, and DOX; top row: 2 days incubation; bottom row: 5 days incubation) and different ADCs (bottom row, from left to right: T-DM1 and T-DXd, 2 d or 5 d incubation). Each data point represents the mean of three independent replicates (n = 3 biological replicates). b. BT-474 tumor volumes at day 40 for mice given MMAE-based ABCs and non-targeted controls (n = 4 mice/group). c. Ex vivo images of the tumors at day 40 for mice given MMAE-based constructs. d. Enlarged Figure 3d for tumor volume measurement with dose schedule illustrated via green arrows (n = 6 mice/group). e. SDS-PAGE analysis of ABCs with DOX as the payload. f. BT-474 tumor volumes at day 40 for mice given DOX-based ABCs and non-targeted controls (n = 6 mice/group). g. Ex vivo images of the tumors at day 40 for mice given DOX-based constructs. Results are presented as mean ± SEM. Statistical analysis was done using a 2-tailed t-test. For these statistical tests, NS denotes non-significant; *, P  < 0.05; **, P  < 0.01.
Extended Data Figure 9.
Extended Data Figure 9.. Microscopic images of mice organs and xenografts examined after ABCs treatments on the BT-474 xenograft tumor model.
Tissue sections were formalin-fixed paraffin-embedded (FFPE), stained with hematoxylin and eosin (H&E), and evaluated by a board-certified veterinary pathologist. a. No sign of toxicity was observed in the heart, lung, liver, spleen, and kidney supporting a good safety profile. b. Xenografts with different magnifications. Tumor cells were only visible in the PBS, MMAE-BP, and MMAE-IgG1 groups. Tumor-bearing mice were treated with MMAE-based constructs (5 mg/kg mAb; 1.7 mg/kg MMAE per dose). Mice were dosed once a week for a total of 4 doses as illustrated via green arrows in panel a of Figure 3. Scale bar = 300 μm. For each representative histology image, tissue sections from 4 mice were analyzed independently, with 3 slices examined per mouse, yielding similar results across all samples.
Figure 1.
Figure 1.. Construction and in vitro evaluation of ABCs.
a. Traditional ADCs feature DARs of ~2–8. b. ADCs based on linear polymer–drug conjugates with drugs distributed on the pendants of hydrophilic polymer chains have been developed. The surface exposure of payloads and chemical heterogeneity in such systems may limit DAR and payload diversity. c. Formation of ABCs through “click” conjugation between Ab-TCO and BP-Tz enabled by a ROMP terminator (enyne-PEG12-Tz). ABCs comprise a mAb covalently conjugated to the end of one or more BPDs (BPD-to-antibody ratio or “BAR” = 1 shown in Figure), the latter of which has hydrophilic polymer chains (blue; PEG in this work) and drugs (green) and cleavable linkers (pink) attached to backbone repeat units, leading to a compact, homogenous microstructure that enables DAR values up to ~135 for a wide range of mechanistically distinct payloads. d. Chemical structures of the 6 different dye and drug–linker-containing MMs used in this work. e. Non-reducing SDS-PAGE gel comparing ABCs with different payloads. f. Non-reducing SDS-PAGE gel for isolated ABCs with different BAR values. g. Binding affinities of various HER2-targeted ADCs and ABCs as measured by MST. ABC30–1 refers to an ABC with DAR = 30 and BAR = 1. ABC60–1 refer to an ABC with DAR = 60 and BAR = 1. Results are presented as mean ± SEM (n = 3 technical replicates). h. In vitro characterization of the BT-474 cell targeting ability of ABCs as measured by flow cytometry (25 μg/mL of ABC, 1 h incubation, 5% Cy5.5 labeled ABC with BAR = 1). The x-axis represents the Cy5.5 fluorescence intensity. i. Cytotoxicity assay (MTT) comparing ABC MMAE-HER2 and BPD MMAE-BP after 24 h incubation, showing greater potency for the HER2-targeted ABC. Results are presented as mean ± SEM (n = 3 biological replicates). j. Confocal microscopy image showing BT-474 cell binding and uptake of Cy5.5-HER2 (50 μg/mL, 6 h incubation, 1% Cy5.5 labeled ABC). Magenta is Cy5.5; blue is Hoechst staining of the nucleus. k. Label-free quantitative proteomics for analyzing the targeted interactome of PEG-HER2Ir against an isotype PEG-IgG1Ir ABC on BT474 cells. Three biological replicates were created for each condition. In such constructs, the Ir-containing photocatalyst was conjugated to the antibodies (Trastuzumab or IgG1) via NHS ester-lysine coupling. Then, the PEG-BP was conjugated onto these antibodies to provide PEG-HER2Ir and PEG-IgG1Ir ABCs. Previously reported interactors of HER2 are identified in burgundy with dashed lines indicating statistical cutoff of log2(fold change) > 0.5, −log(P-value) > 1.3. Normalization was performed via median subtraction and a volcano plot was generated using a t-test for statistical significance. Contaminants were filtered manually for image clarity.
Figure 2.
Figure 2.. Pharmacokinetics (PK) and biodistribution (BD) of ABCs.
a. FcRn binding assay comparing HER2-targeted ABCs to Trastuzumab (aHER2) and ADCs T-DM1 and T-DXd. ABC60–1 refers to an ABC with DAR = 60 and BAR = 1. ABC60–2 refers to an ABC with DAR = 60 and BAR = 2. b. Blood PK studies comparing BPD Cy5.5-BP, non-HER2-targeted Cy5.5-IgG1, and Cy5.5-HER2 as assessed by fluorescence imaging of blood samples (n = 3 biological replicates). c. Total percentage of injected dose in blood 72 h post-injection of each construct, as assessed by fluorescence imaging (n = 3 biological replicates). d. Ex vivo images of different organs and tumors of mice bearing subcutaneous BT-474 tumors 72 h post administration of each construct. Only HER2-targeted Cy5.5-HER2 shows selective tumor accumulation over this timescale. e. Quantitative BD results obtained via fluorescence quantification 72 h post administration to mice bearing subcutaneous BT-474 tumors (n = 3 biological replicates). f. Zoomed in BD results for tumor tissue fluorescence signal 72 h post-injection. Results are presented as mean ± SEM (n = 3 biological replicates). Statistical analysis was done using a 2-tailed t-test. For these statistical tests, ** denotes P < 0.01.
Figure 3.
Figure 3.. Efficacy and safety of ABCs incorporating diverse payloads with different potencies in HER2+ BT-474 tumor-bearing mice.
a. Tumor volume, b. body weight, and c. tumor weight measurements after 40 d for mice given MMAE-based constructs (5 mg/kg mAb; 1.7 mg/kg MMAE per dose). Mice were dosed once a week for a total of 4 doses as illustrated via green arrows in panel a. n = 4 mice/group. d. Tumor volume, e. body weight, and f. survival curves for mice given SN-38-based constructs (5 mg/kg mAb or 1.1 mg/kg SN38 per dose). Mice were dosed twice a week with a total of 7 doses (dose schedule is illustrated in Extended Data Fig. 8d). n = 6 mice/group. g. Tumor volume, h. body weight, and i. and tumor weight measurements after 40 d for mice given DOX-based constructs (5 mg/kg mAb or 1.9 mg/kg DOX per dose). Mice were dosed once per week for a total of 4 doses as illustrated by the green arrows in panel g. n = 6 mice/group. Results are presented as mean ± SEM. Statistical analysis was done using a 2-tailed t-test. For these statistical tests, NS denotes non-significant; *, P < 0.05; **, P < 0.01.
Figure 4.
Figure 4.. Efficacy of HER2-targeted ABCs with different payloads and commercial HER2-targeted ADCs T-DM1 and T-DXd in high and low HER2 tumors.
a. Tumor volumes versus time for MMAE, SN-38, and DOX-based ABCs compared to T-DM1 and a non-payload-containing PEG bottlebrush–Trastuzumab conjugate PEG-HER2 in HER2+ subcutaneous BT-474 tumor bearing mice. When tumor volumes reached ~100 mm3, mice were randomized into treatment/control groups (5 mg/kg mAb per dose; mice were dosed on day 0 as illustrated by the green arrow on the x-axis; n = 5 mice/group). b. Tumor volumes after 40 d for all groups. A1, B1, C1, and D1 are the statistical analyses with the control group; A1: P = 0.0075 (**), B1: P = 0.0052 (**), C1: P = 0.0052 (**), D1: P = 0.0062 (**). A2, B2, C2, and D2 are the statistical analyses with the PEG-HER2 group; A2: P = 0.0194 (*), B2: P = 0.0097 (**), C2: P = 0.0099 (**), D2: P = 0.0137 (*). c. Zoomed-in view of tumor volumes for payload-containing ABCs and T-DM1, showing that ABCs display payload-potency-dependent efficacy and improved efficacy for all payloads compared to T-DM1. d. Ex vivo image of tumors from each group at day 40. e. Tumor weight measurement after 40 d for all groups. A1, B1, C1, and D1 are the statistical analyses with the control group; A1: P = 0.0027 (**), B1: P = 0.0016 (**), C1: P = 0.0017 (**), D1: P = 0.0023 (**). A2, B2, C2, and D2 are the statistical analyses with the PEG-HER2 group; A2: P = 0.094 (NS), B2: P = 0.0432 (*), C2: P = 0.0473 (*), D2: P = 0.0757 (NS). f. Zoomed-in view of tumor volumes for payload-containing ABCs and T-DM1, showing that ABCs display payload-potency-dependent efficacy and improved efficacy for all payloads compared to T-DM1. g. Tumor volumes versus times for BT-474 tumor-bearing mice following a single dose of SN38-HER2, non-targeted SN38-IgG1, or T-DXd. Once tumor volumes reached ~175 mm3, mice were randomized into treatment/control groups. Mice were given a single dose (5 mg/kg mAb) of each construct intravenously at day 0 (n = 5 mice/group; control group: n = 4). h. Tumor volumes versus times for NCR nude mice bearing orthotopic, low-HER2-expressing HCC70 tumors following injection of SN38-HER2 or T-DXd (n = 8 mice/group). At tumor volumes of ~100 mm3, mice were randomized into treatment/control groups. Mice were administered each construct intravenously once every 10 days for 3 total doses as indicated by the green arrows. Results are presented as mean ± SEM. Statistical analysis was done using a 2-tailed t-test. For these statistical tests, NS denotes non-significant; *, P < 0.05; **, P < 0.01; ***, P < 0.001.
Figure 5.
Figure 5.. Efficacy and safety of ABCs incorporating the PROTAC payload ARV771 in HER2+ BT-474 tumor-bearing mice.
a. Tumor volume measurement, b. Body weight measurement, c. tumor volumes at day 30, d. Ex vivo images of tumors at day 30, and e. tumor weight measurements for mice bearing subcutaneous BT-474 tumors. Once tumors reached ~100 mm3, mice were randomized into treatment versus control groups. Mice were given each construct intravenously once per week for 3 total doses, as indicated by the green arrows in panel a (n = 5 mice/group). Note that two PROTACs were tested as free drugs: ARV771 and ARV825 for comparison to ABC ARV771-HER2. At the doses given, the free PROTACs and non-targeted controls are not effective while ARV771-HER2 leads to near tumor eradication. Results are presented as mean ± SEM. Statistical analysis was done using a 2-tailed t-test. For these statistical tests, NS denotes non-significant; *, P < 0.05.
Figure 6.
Figure 6.. BD, efficacy and safety of MUC1-targeted ABCs in ovarian cancer (CAOV3) tumor-bearing mice.
a. Ex vivo BD 72 h after administration showing increased fluorescence in tumors of mice given MUC1-targeted Cy5.5-MUC1. b. tumor volume versus time, c. body weight, d. ex vivo tumor volumes at day 60, e. ex vivo images of tumors at day 60, and f. tumor weights for NCR nude mice bearing subcutaneous CAOV3 tumors (n = 6 mice/group). At tumor volumes of ~80 mm3, mice were randomized into treatment/control groups. Mice were given each construct intravenously once per week for 4 total doses as indicated by the green arrows in panel b. Results are presented as mean ± SEM (n = 6 mice/group). Statistical analysis was done using a 2-tailed t-test. For these statistical tests, **** denotes P < 0.0001.

Similar articles

References

    1. Siegel RL, Miller KD, Fuchs HE, Jemal A Cancer statistics, 2022. CA. Cancer J. Clin 72, 7–33 (2022). - PubMed
    1. Wang Z, Li H, Gou L, Li W, Wang Y Antibody–drug conjugates: Recent advances in payloads. Acta Pharm. Sin. B 13, 4025–4059 (2023). - PMC - PubMed
    1. Hobson AD Chapter One - Antibody drug conjugates beyond cytotoxic payloads. Progress in Medicinal Chemistry. 62, 1–59 (2023). - PubMed
    1. Tarantino P, Ricciuti B, Pradhan SM & Tolaney SM Optimizing the safety of antibody-drug conjugates for patients with solid tumours. Nat. Rev. Clin. Oncol 20, 558–576 (2023). - PubMed
    1. Dumontet C, Reichert JM, Senter PD, Lambert JM & Beck A Antibody-drug conjugates come of age in oncology. Nat. Rev. Drug Discov 22, 641–661 (2023). - PubMed

Methods-only references

    1. Trowbridge AD et al. Small molecule photocatalysis enables drug target identification via energy transfer. Proc. Natl Acad. Sci. USA 119, e2208077119 (2022). - PMC - PubMed
    1. Oakley JV et al. Radius measurement via super-resolution microscopy enables the development of a variable radii proximity labeling platform. Proc. Natl. Acad. Sci. USA 119, e2203027119 (2022). - PMC - PubMed
    1. Pan C, Knutson SD, Huth SW, MacMillan DWC μMap proximity labeling in living cells reveals stress granule disassembly mechanism. Nat. Chem. Biol 21, 490–500 (2025). - PMC - PubMed
    1. Demichev V, Messner CB, Vernardis SI, Lilley KS, Ralser M DIA-NN: neural networks and interference correction enable deep proteome coverage in high throughput. Nat. Methods 17, 41–44 (2020). - PMC - PubMed
    1. Demichev V et al. dia-PASEF data analysis using FragPipe and DIA-NN for deep proteomics of low sample amounts. Nat. Commun 13, 3944 (2022). - PMC - PubMed

LinkOut - more resources