. 2025 Oct;17(10):2762-2786.
doi: 10.1038/s44321-025-00303-6. Epub 2025 Sep 8.

Identification of p38 MAPK inhibition as a neuroprotective strategy for combinatorial SMA therapy

Affiliations

Identification of p38 MAPK inhibition as a neuroprotective strategy for combinatorial SMA therapy

Maria J Carlini et al. EMBO Mol Med. 2025 Oct.

Abstract

Spinal muscular atrophy (SMA) is a neurodegenerative disease caused by ubiquitous deficiency in the SMN protein. The identification of disease modifiers is key to understanding pathogenic mechanisms and broadening the range of targets for developing SMA therapies that complement SMN upregulation. Here, we report a cell-based screen that identified inhibitors of p38 mitogen-activated protein kinase (p38 MAPK) as suppressors of proliferation defects induced by SMN deficiency in mouse fibroblasts. We further show that SMN deficiency induces p38 MAPK activation and that pharmacological inhibition of this pathway improves motor function in SMA mice through SMN-independent neuroprotective effects. Using a highly optimized p38 MAPK inhibitor (MW150) and combinatorial treatment in SMA mice, we observed synergistic enhancement of the phenotypic benefit induced by either MW150 or an SMN-inducing drug alone. By promoting motor neuron survival, pharmacological inhibition of p38 MAPK synergizes with SMN induction and enables enhanced synaptic rewiring of motor neurons within sensory-motor spinal circuits. These studies identify the p38 MAPK pathway as a therapeutic target and MW150 as a neuroprotective drug for combination therapy in SMA.

Keywords: Combination Therapy; Neuroprotection; Spinal Muscular Atrophy (SMA); Survival Motor Neuron (SMN); p38 Mitogen-Activated Protein Kinase (p38 MAPK).


Conflict of interest statement

Disclosure and competing interests statement. The authors declare no competing interests.

Figures
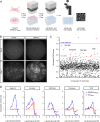
Figure 1
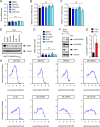
Figure 1. A cell-based chemical screen identifies candidate modifiers of SMN biology.
(A) Schematic of the chemical screen design. NIH3T3-SMN2/SmnRNAi cells were grown for 5 days in the presence of Dox prior to plating in 96-well format plates and addition of compounds from a chemical library. After an additional 5 days in culture in the presence of Dox, cells were fixed and stained with Hoechst, followed by automated whole-well imaging and determination of cell number. Created in BioRender. Pellizzoni, L. (2025) https://BioRender.com/k5m9uz6. (B) Representative whole-well images of Dox-treated NIH3T3-SMN2/SmnRNAi cells cultured in 96-well format in the presence of vehicle (DMSO) or SMN-C3 (500 nM) for 4 h (Day 0) or 5 days (Day 5), followed by fixation and nuclear staining with Hoechst. (C) Graph summarizing the results of the chemical screen. Each point represents the effect of a single compound on the proliferation of NIH3T3-SMN2/SmnRNAi cells at day 5. The mean normalized cell number relative to vehicle-treated cells from three independent biological replicates is shown. The mean of the benchmark compound (SMN-C3) and the hit cutoff are indicated by dotted lines. Primary hits are shown in red, and the four compounds that passed secondary validation are labeled by name. (D) Dose-response analysis of the effects of the indicated compounds on cell proliferation in Dox-treated SMN2/SmnRNAi and SmnRNAi NIH3T3 cells. The graphs show mean and SEM (n = 6 independent biological replicates) of normalized cell number relative to vehicle-treated cells at day 5 for each tested concentration, and non-linear curve fitting. Source data are available online for this figure.
Figure 2
Figure 2. p38 MAPK inhibition promotes proliferation of SMN-deficient NIH3T3 cells.
(A) RT-qPCR analysis of Smn mRNA levels in untreated and Dox-treated NIH3T3-SMN2/SmnRNAi cells cultured for 5 days in the presence of either DMSO or EO1428, Clozapine, DHE and CGP7930 at a concentration of 10 μM. Mean, SEM, and individual values from Dox-treated cells normalized to DMSO-treated cells cultured without Dox are shown (n = 3 independent biological replicates). One-way ANOVA followed by Tukey’s post hoc test. ns not significant. (B) RT-qPCR analysis of total (TOT) SMN2 mRNA levels in the same groups as in (A). Mean, SEM, and individual values from Dox-treated cells normalized to DMSO-treated cells cultured without Dox are shown (n = 3 independent biological replicates). One-way ANOVA followed by Tukey’s post hoc test. ns, not significant. (C) RT-qPCR analysis of full-length (FL) SMN2 mRNA levels in the same groups as in (A). Mean, SEM, and individual values from Dox-treated cells normalized to DMSO-treated cells cultured without Dox are shown (n = 3 independent biological replicates). One-way ANOVA followed by Tukey’s post hoc test. ns not significant. (D) Western blot analysis of SMN expression in the same groups as in (A). β-actin was used as a loading control. (E) Normalized mean, SEM, and individual values of SMN levels in Dox-treated relative to untreated NIH3T3-SMN2/SmnRNAi cells from three independent experiments as in (D). Kruskal–Wallis followed by Dunn’s post hoc test. ns not significant. (F) Western blot analysis of total and phosphorylated p38 MAPK in untreated and Dox-treated NIH3T3-SMN2/SmnRNAi cells. SMN and tubulin were used as controls. (G) Quantification of the levels of phosphorylated p38 MAPK relative to total p38 MAPK in NIH3T3-SMN2/SmnRNAi cells cultured with or without Dox from experiments as in (B). Normalized mean, SEM, and individual values from three independent biological replicates are shown. Two-tailed unpaired t-test. P = 0.031. (H) Dose-response analysis of the effects of the indicated p38 MAPK inhibitors on the proliferation of Dox-treated SMN2/SmnRNAi cells at day 5. The graphs show mean and SEM of normalized cell number relative to vehicle-treated cells at day 5 (n = 6 biological replicates) for each tested concentration, and non-linear curve fitting. Source data are available online for this figure.
Figure 3
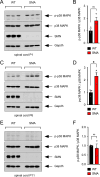
Figure 3. SMN deficiency induces p38 MAPK activation in the spinal cord of SMA mice.
(A) Western blot analysis of total and phosphorylated p38 MAPK in the spinal cord of WT and SMA mice at P1. (B) Quantification of the levels of phosphorylated p38 MAPK relative to total p38 MAPK from the experiment in (A). Normalized mean, SEM, and individual values from three independent biological replicates are shown. Mann–Whitney test. ns, not significant. (C) Western blot analysis of total and phosphorylated p38 MAPK in the spinal cord of WT and SMA mice at P6. (D) Quantification of the levels of phosphorylated p38 MAPK relative to total p38 MAPK from the experiment in (C). Normalized mean, SEM, and individual values from three independent biological replicates are shown. Unpaired t-test. P = 0.0224. (E) Western blot analysis of total and phosphorylated p38 MAPK in the spinal cord of WT and SMA mice at P11. (F) Quantification of the levels of phosphorylated p38 MAPK relative to total p38 MAPK from the experiment in (E). Normalized mean, SEM, and individual values from three independent biological replicates are shown. Welch’s t-test. ns not significant. SMN and Gapdh were used as controls. Source data are available online for this figure.
Figure 4
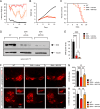
Figure 4. Pharmacological inhibition of p38 MAPK with MW150 improves motor behavior through neuroprotective effects in SMA mice.
(A) Analysis of righting time in untreated WT mice (n = 17) and SMA mice treated daily with vehicle (n = 16) or 5 mg/kg MW150 (n = 14) starting at P0. Data represent mean and SEM. Mixed-effects model ANOVA comparison of righting time between vehicle and MW150-treated SMA mice: P < 0.0001. (B) Analysis of weight gain in the same groups as in (A). Data represent mean and SEM. Mixed-effects model ANOVA comparison of weight gain between vehicle and MW150-treated SMA mice: not significant. (C) Kaplan–Meier analysis of survival in the same groups as in (A). Log-rank (Mantel–Cox) comparison of survival between vehicle and MW150-treated SMA mice: not significant. (D) Western blot analysis of SMN levels in P11 spinal cords from the same experimental groups as in (AC). Tubulin was used as a loading control. (E) Quantification of SMN levels from the experiment in (D). Normalized mean, SEM, and individual values from three independent biological replicates are shown. One-way ANOVA and Tukey’s post hoc test. P < 0.0001 (WT vs SMA + vehicle); P < 0.0001 (WT vs SMA + MW150); ns not significant (SMA + vehicle vs SMA + MW150). (F) ChAT immunostaining of L2 and L5 spinal cords isolated at P11 from uninjected WT mice and SMA mice treated daily with vehicle or MW150 (5 mg/kg) starting at P0. L5 lateral motor column (LMC) and medial motor column (MMC) motor neuron pools are indicated, and magnified views of L5 MMC motor neurons are shown in the insets. Scale bars = 50 µm and 25 µm (insets). (G) Total number of L2 motor neurons in the same experimental groups as in (F). Normalized mean, SEM, and individual values from the following number of mice: WT (n = 5), SMA + vehicle (n = 5), and SMA + MW150 (n = 4). One-way ANOVA with Tukey’s post hoc test. P < 0.0001 (WT vs SMA + vehicle); P = 0.0013 (WT vs SMA + MW150); P = 0.0055 (SMA + vehicle vs SMA + MW150). (H) Total number of L5 MMC motor neurons in the same experimental groups as in (F). Normalized mean, SEM, and individual values from the following number of mice: WT (n = 5), SMA + vehicle (n = 5), and SMA + MW150 (n = 6). One-way ANOVA with Tukey’s post hoc test. P = 0.0046 (WT vs SMA + vehicle); P = 0.0064 (SMA + vehicle vs SMA + MW150). Source data are available online for this figure.
Figure 5
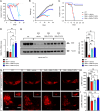
Figure 5. Analysis of delayed treatment of SMA mice with SMN-C3.
(A) Analysis of righting time in untreated WT mice (n = 16) and SMA mice treated daily with vehicle (n = 22) or SMN-C3 (3 mg/kg) starting at P0 (n = 16) and P8 (n = 15). Data represent mean and SEM. Mixed-effects model ANOVA comparison of righting time: SMA + vehicle vs SMA + SMN-C3 (P8), P < 0.0001; SMA+vehicle vs SMA + SMN-C3 (P0), P < 0.0001. SMA + SMN-C3 (P8) vs SMA + SMN-C3 (P0), P < 0.0001. (B) Analysis of weight gain in the same groups as in (A). Data represent mean and SEM. Mixed-effects model ANOVA comparison of weight gain: SMA + vehicle vs SMA + SMN-C3 (P8), not significant; SMA+vehicle vs SMA + SMN-C3 (P0), P < 0.0001; SMA + SMN-C3 (P8) vs SMA + SMN-C3 (P0), P < 0.0001. (C) Kaplan–Meier analysis of survival in the same groups as in (A). Log-rank (Mantel–Cox) comparison of survival: SMA + vehicle vs SMA + SMN-C3 (P8), not significant; SMA + vehicle vs SMA + SMN-C3 (P0), P < 0.0001; SMA + SMN-C3 (P8) vs SMA + SMN-C3 (P0), P < 0.0001. (D) RT-qPCR analysis of the levels of full-length SMN2 mRNA in P11 spinal cords from the same experimental groups as in (A). Mean, SEM, and individual values normalized to WT samples as a control are shown (n = 3 independent biological replicates). One-way ANOVA followed by Tukey’s post hoc test. P = 0.024 (WT vs SMA + SMN-C3(P8)); P = 0.0071 (WT vs SMA + SMN-C3(P0)); P = 0.014 (SMA + vehicle vs SMA + SMN-C3(P8)); P = 0.0043 (SMA + vehicle vs SMA + SMN-C3(P0)). (E) Western blot analysis of SMN levels in P11 spinal cords from the same experimental groups as in (AC). Tubulin was used as a loading control. (F) Quantification of SMN levels from the experiment in (E). Normalized mean, SEM, and individual values from three independent biological replicates are shown. One-way ANOVA followed by Tukey’s post hoc test. P < 0.0001 (WT vs SMA + vehicle); P = 0.0003 (WT vs SMA + SMN-C3(P8)); P = 0.0015 (WT vs SMA + SMN-C3(P0)); P = 0.002 (SMA + vehicle vs SMA + SMN-C3(P8)); P = 0.0004 (SMA + vehicle vs SMA + SMN-C3(P0)). (G) ChAT immunostaining of L2 and L5 spinal cords isolated at P11 from uninjected WT mice and SMA mice treated daily with vehicle or SMN-C3 (3 mg/kg) starting at P0 or P8. L5 LMC and MMC motor neuron pools are indicated, and magnified views of L5 MMC motor neurons are shown in the insets. Scale bars = 50 and 25 µm (insets). (H) Total number of L2 motor neurons in the same experimental groups as in (G). Normalized mean, SEM, and individual values from the following number of mice: WT (n = 5), SMA + vehicle (n = 5), SMA + SMN-C3 (P0) (n = 5), and SMA + SMN-C3 (P8) (n = 4). One-way ANOVA with Tukey’s post hoc test. P < 0.0001 (WT vs SMA + vehicle); P = 0.0005 (WT vs SMA + SMN-C3(P8)); P = 0.0038 (WT vs SMA + SMN-C3(P0)); P = 0.0391 (SMA + vehicle vs SMA + SMN-C3(P0)); ns not significant (SMA + vehicle vs SMA + SMN-C3(P8)). (I) Total number of L5 MMC motor neurons in the same experimental groups as in (G). Normalized mean, SEM, and individual values from the following number of mice: WT (n = 6), SMA + vehicle (n = 6), SMA + SMN-C3 (P0) (n = 6), and SMA + SMN-C3 (P8) (n = 6). One-way ANOVA with Tukey’s post hoc test. P < 0.0001 (WT vs SMA + vehicle); P = 0.0025 (SMA + vehicle vs SMA + SMN-C3(P0)); ns not significant (SMA + vehicle vs SMA + SMN-C3(P8)). Source data are available online for this figure.
Figure 6
Figure 6. Phenotypic analysis of combinatorial treatment of SMA mice with MW150 and SMN-C3.
(A) Schematic of the experimental design for delayed SMN-C3 treatment alone and combinatorial treatment with both SMN-C3 and MW150. SMA mice received either daily treatment with vehicle (delayed SMN-C3) or 5 mg/kg MW150 starting at P0 (combinatorial treatment). Daily administration of 3 mg/kg SMN-C3 initiated at P8. (B) Analysis of righting time in SMA mice treated daily with delayed SMN-C3 (n = 15) or the combinatorial treatment (n = 15). Data represent mean and SEM. Mixed-effects model ANOVA comparison of righting time between groups: P = 0.0002. (C) Analysis of weight gain in the same groups as in (A). Data represent mean and SEM. Mixed-effects model ANOVA comparison of weight gain between groups: P = 0.0003. (D) Kaplan–Meier analysis of survival in the same groups as in (A). Log-rank (Mantel–Cox) comparison of survival between groups: P = 0.0062. The datasets for the delayed SMN-C3 treatment group are the same as in Fig. 5. Source data are available online for this figure.
Figure 7
Figure 7. MW150 treatment promotes partial improvement of NMJs but not central synapses by delayed SMN induction at early times.
(A) NMJ staining with bungarotoxin (BTX, red), synaptophysin (Syp, green), and neurofilament (NF-M, blue) of QL muscles isolated at P11 from uninjected WT mice and SMA mice treated with vehicle, MW150, early (P0) and delayed (P8) SMN-C3 or with combinatorial therapy. Scale bar = 25 µm. (B) Percentage of fully denervated NMJs in the QL muscle from the same experimental groups as in (A). Normalized mean, SEM, and individual values from the following number of mice: WT (n = 8), SMA + vehicle (n = 8), SMA + MW150 (P0) (n = 4), SMA + SMN-C3 (P0) (n = 6), SMA + SMN-C3 (P8) (n = 5), and SMA + SMN-C3 (P8)/MW150 (P0) (n = 5). One-way ANOVA with Tukey’s post hoc test. P < 0.0001 (WT vs SMA + vehicle); P < 0.0001 (SMA + vehicle vs SMA + SMN-C3(P0)); P < 0.0001 (SMA + vehicle vs SMA + MW150(P0) + SMN-C3(P8)); P < 0.0001 (SMA + SMN-C3(P8) vs SMA + MW150(P0) + SMN-C3(P8)); P = 0.0016 (SMA + SMN-C3(P0) vs SMA + MW150(P0) + SMN-C3(P8)); P = 0.0004 (SMA + MW150(P0) vs SMA + MW150(P0) + SMN-C3(P8)); ns not significant. (C) Immunostaining of VGluT1+ synapses (gray) and ChAT+ motor neurons (blue) of L2 spinal cords isolated at P11 from the same experimental groups as in (A). Scale bar = 10 µm. (D) Number of VGluT1+ synapses on the somata of L2 motor neurons from the same experimental groups as in (A). Normalized mean, SEM, and individual values from the following number of mice: WT (n = 4), SMA+vehicle (n = 4), SMA + MW150 (P0) (n = 4), SMA + SMN-C3 (P0) (n = 4), SMA + SMN-C3 (P8) (n = 4), and SMA + SMN-C3 (P8)/MW150 (P0) (n = 4). One-way ANOVA with Tukey’s post hoc test. P < 0.0001 (WT vs SMA+vehicle); P = 0.0102 (SMA + vehicle vs SMA + SMN-C3(P0)); P = 0.0295 (SMA + SMN-C3(P0) vs SMA + MW150(P0) + SMN-C3(P8)); ns not significant. Source data are available online for this figure.
Figure 8
Figure 8. MW150 treatment promotes restoration of NMJs and central synapses by delayed SMN induction at later times.
(A) NMJ staining with bungarotoxin (BTX, red), synaptophysin (Syp, green), and neurofilament (NF-M, blue) of QL muscles isolated at P21 from uninjected WT mice, SMA mice injected daily with SMN-C3 (3 mg/kg) starting at P0, and SMA mice injected with SMN-C3 (3 mg/kg) at P8 in combination with MW150 (5 mg/kg) starting at P0. Scale bar = 25 µm. (B) Percentage of fully innervated NMJs in the QL muscle from the same experimental groups as in (A). Normalized mean, SEM, and individual values from the following number of mice: WT (n = 4), SMA + SMN-C3 (P0) (n = 4), and SMA + SMN-C3 (P8)/MW150 (P0) (n = 4). Kruskal–Wallis followed by Dunn’s post hoc test. ns not significant. (C) Immunostaining of VGluT1+ synapses (gray) and ChAT+ motor neurons (blue) of L2 spinal cords isolated at P21 from the same experimental groups as in (A). Scale bar = 25 µm. (D) Number of VGluT1+ synapses on the somata of L2 motor neurons from the same experimental groups as in (A). Normalized mean, SEM, and individual values from the following number of mice: WT (n = 4), SMA + SMN-C3 (P0) (n = 4), and SMA + SMN-C3 (P8)/MW150 (P0) (n = 4). One-way ANOVA with Tukey’s post hoc test. ns not significant. Source data are available online for this figure.
Figure EV1
Figure EV1. Analysis of MW150 biodistribution in plasma and brain of SMA mice.
(AC) MW150 concentration in plasma (A) and brain (B) and brain-to-plasma ratio (C) 3 h after a single IP injection of the indicated doses of MW150 in SMA mice at P10. Mean, SEM, and individual values from independent biological replicates (mice) for MW150 doses of 2.5 mg/kg (n = 5), 5 mg/kg (n = 5), 10 mg/kg (n = 5), and 20 mg/kg (n = 4) are shown. Source data are available online for this figure.
Figure EV2
Figure EV2. MW150 treatment does not improve the SMA phenotype in Smn2B/− mice.
(A) Body weight of control Smn2B/+ (n = 32) mice and Smn2B/− SMA mice either untreated (n = 31) or treated daily with MW150 (5 mg/kg) from P1 onward (n = 12). Data represent mean and SEM. Mixed-effects model ANOVA comparison of weight gain between Smn2B/- and Smn2B/- + MW150 mice: not significant. (B) Righting time from the same experimental groups shown in (A). Data represent mean and SEM. Mixed-effects model ANOVA comparison of righting time between Smn2B/- and Smn2B/- + MW150 mice: not significant. (C) Time to fall in the hindlimb suspension test from the same experimental groups shown in (A). Data represent mean and SEM. Mixed-effects model ANOVA comparison of hindlimb suspension test between Smn2B/- and Smn2B/- + MW150 mice: not significant. (D) Kaplan–Meier survival curves from the same experimental groups as in (A). Log-rank (Mantel–Cox) comparison of survival between Smn2B/- and Smn2B/- + MW150 mice: not significant. The data for untreated Smn2B/+ and Smn2B/- mice are from a previously published study (Carlini et al, 2022). Source data are available online for this figure.
Figure EV3
Figure EV3. MW150 does not increase SMN expression beyond the levels induced by delayed treatment with SMN-C3 in the spinal cord of SMA mice.
(A) Western blot analysis of SMN levels in P11 spinal cords from WT mice and SMA mice treated daily with vehicle or MW150 (5 mg/kg) starting at P0 and SMN-C3 (3 mg/kg) starting at P8 as indicated. Tubulin was used as loading control. (B) Quantification of SMN levels from the experiment in (A). Normalized mean, SEM, and individual values from three independent biological replicates are shown. One-way ANOVA and Tukey’s post hoc test. P < 0.0001 (WT vs SMA+vehicle); P = 0.0002 (WT vs SMA + SMN-C3(P8) + vehicle(P0)); P = 0.0003 (WT vs SMA + SMN-C3(P8) + MW150(P0)); P = 0.0019 (SMA+vehicle vs SMA + SMN-C3(P8)+vehicle(P0)); P = 0.0009 (SMA + vehicle vs SMA + SMN-C3(P8) + MW150(P0)); ns not significant (SMA + SMN-C3(P8) + vehicle(P0) vs SMA + SMN-C3(P8) + MW150(P0)). Source data are available online for this figure.
Figure EV4
Figure EV4. Analysis of motor neuron survival in combinatorially treated adult SMA mice.
(A) ChAT immunostaining of L2 and L5 spinal cords isolated at P21 from uninjected WT mice and SMA mice injected daily with SMN-C3 (3 mg/kg) starting at P0 or injected with SMN-C3 (3 mg/kg) at P8 in combination with MW150 (5 mg/kg) starting at P0. L5 LMC and MMC motor neuron pools are indicated, and magnified views of L5 MMC motor neurons are shown in the insets. Scale bars = 50 and 25 µm (insets). (B) Total number of L2 motor neurons in the same experimental groups as in (A). Normalized mean, SEM, and individual values from three mice per experimental group are shown. One-way ANOVA with Tukey’s post hoc test. P = 0.0259 (WT vs SMA + SMN-C3(P0); ns, not significant. (C) Total number of L5 MMC motor neurons in the same experimental groups as in (A). Normalized mean, SEM, and individual values from three mice per experimental group are shown. One-way ANOVA with Tukey’s post hoc test. ns, not significant. Source data are available online for this figure.

Update of

References

    1. Aikio M, Odeh HM, Wobst HJ, Lee BL, Chan Ú, Mauna JC, Mack KL, Class B, Ollerhead TA, Ford AF et al (2025) Opposing roles of p38α-mediated phosphorylation and PRMT1-mediated arginine methylation in driving TDP-43 proteinopathy. Cell Rep 44:115386 - PMC - PubMed
    1. Baranello G, Darras BT, Day JW, Deconinck N, Klein A, Masson R, Mercuri E, Rose K, El-Khairi M, Gerber M et al (2021) Risdiplam in type 1 spinal muscular atrophy. N Engl J Med 384:915–923 - PubMed
    1. Bertini E, Dessaud E, Mercuri E, Muntoni F, Kirschner J, Reid C, Lusakowska A, Comi GP, Cuisset JM, Abitbol JL et al (2017) Safety and efficacy of olesoxime in patients with type 2 or non-ambulatory type 3 spinal muscular atrophy: a randomised, double-blind, placebo-controlled phase 2 trial. Lancet Neurol 16:513–522 - PubMed
    1. Buettner JM, Sime Longang JK, Gerstner F, Apel KS, Blanco-Redondo B, Sowoidnich L, Janzen E, Langenhan T, Wirth B, Simon CM (2021) Central synaptopathy is the most conserved feature of motor circuit pathology across spinal muscular atrophy mouse models. iScience 24:103376 - PMC - PubMed
    1. Carlini MJ, Triplett MK, Pellizzoni L (2022) Neuromuscular denervation and deafferentation but not motor neuron death are disease features in the Smn2B/- mouse model of SMA. PLoS ONE 17:e0267990 - PMC - PubMed

MeSH terms

Substances