. 2025 Oct;26(10):1821-1835.
doi: 10.1038/s41590-025-02258-9. Epub 2025 Sep 9.

Divergent cytokine and transcriptional signatures control functional T follicular helper cell heterogeneity

Affiliations

Divergent cytokine and transcriptional signatures control functional T follicular helper cell heterogeneity

Lennard Dalit et al. Nat Immunol. 2025 Oct.

Abstract

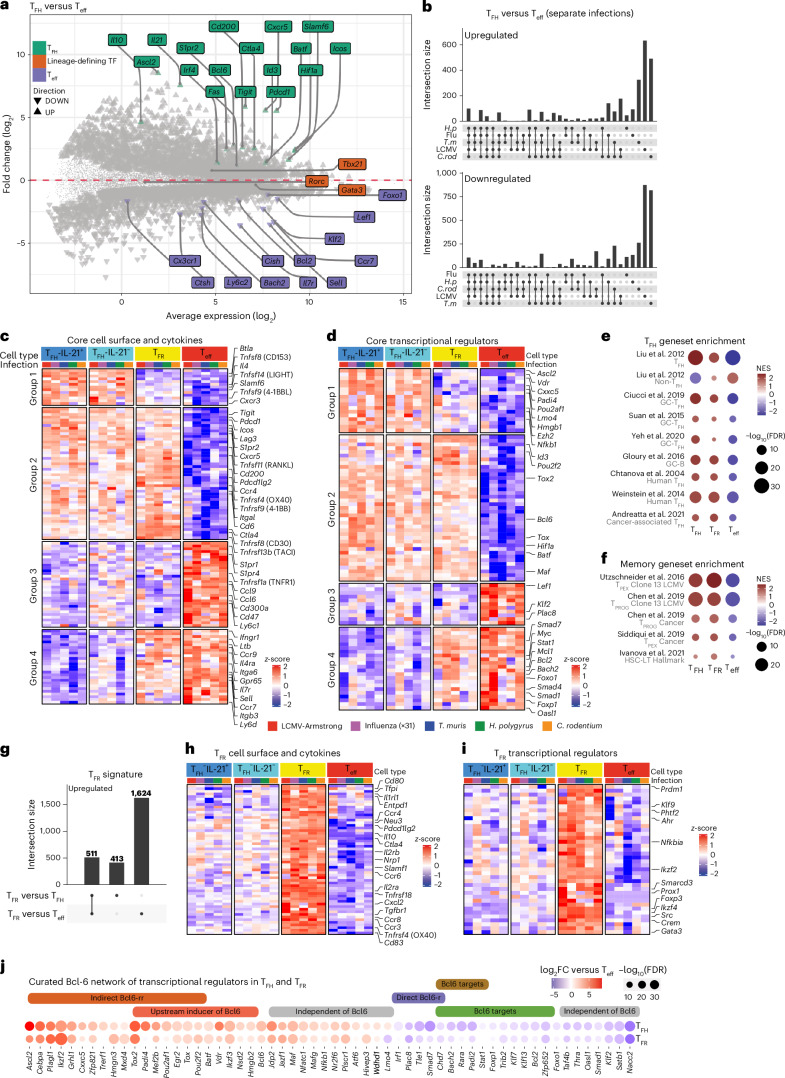
CD4+ T follicular helper (TFH) cells support tailored B cell responses against multiple classes of pathogens. To reveal how diverse TFH phenotypes are established, we profiled mouse TFH cells in response to viral, helminth and bacterial infection. We identified a core TFH signature that is distinct from CD4+ T follicular regulatory and effector cells and identified pathogen-specific transcriptional modules that shape TFH function. Cytokine-transcriptional TFH programming demonstrated that type I interferon and TGFβ signaling direct individual TFH phenotypes to instruct B cell output. Cytokine-directed TFH transcriptional phenotypes are shared within human germinal centers, but distinct TFH phenotypes dominate between donors and following immune challenge or in antibody-mediated disease. Finally, we identified new cell surface markers that align with distinct TFH phenotypes. Thus, we provide a comprehensive resource of TFH diversity in humans and mice to enable immune monitoring during infection and disease and to inform the development of context-specific vaccines.


Conflict of interest statement

Competing interests: No authors declare competing interests.

Figures

Fig. 1
Fig. 1. Functionally heterogeneous TFH phenotypes are induced by diverse pathogen infections.
ai, Analysis of draining lymph node cells from wild-type (ac,h,i) and ZsGreen_T-bet reporter (dg) mice infected with the indicated pathogens at the early peak GC response (LCMV day 12, influenza day 10, T.muris day 21, H.polygyrus day 12 and C.rodentium day 12). Representative plots of CD4+CD44+Ly6C+CD162+ Teff cells and CD4+CD44+CXCR5+PD-1+Ly6CCD162 TFH cells with histograms displaying Bcl-6 expression (a). Frequencies of TFH cells in CD4+CD44+ gate (b) and the ratio of TFH:Teff cells (LCMV n = 8, influenza n = 8, T.muris n = 6, H.polygyrus n = 9, C.rodentium n = 10 mice per group) (c). Representative plots of ZsGreen_T-bet reporter expression (TFH cells are blue, Teff cells are red) (d). ZsGreen_T-bet reporter+ frequency and gMFI of CD4+CD44+CXCR5+PD-1+Ly6CCD162 TFH cells (LCMV n = 8, influenza n = 8, T.muris n = 6, H.polygyrus n = 10, C.rodentium n = 7 mice per group) (e). Immunofluorescence staining of draining lymph node GCs. Red arrows indicate ZsGreen_T-bet reporter+ TFH cells. Yellow, CD4; blue, IgD; magenta, GL7; green, ZsGreen_T-bet reporter. Scale bar, 200 μm (f). Correlation of ZsGreen_T-bet reporter expression with the Teff:TFH cell ratio across infections (g). Frequency of TFH cells that produced IFNγ, IL-4 or IL-17A (h). IFNγ+ TFH1, IL-4+ TFH2, and IL-17+ TFH17 cells are included in the entire TFH population (i). The inner slice displays cytokine coexpression. The outer ring (green) indicates the proportion of ZsGreen_T-bet+ TFH cells expressed. The data are from 6–10 mice per group and are presented as the mean ± s.e.m. Statistical tests included one-way analysis of variance (ANOVA) for multiple comparisons and Pearson correlation with two-tailed P values. ****P < 0.0001 or otherwise indicated. Source Data
Fig. 2
Fig. 2. Diverse pathogen infection tailors B cell responses.
ad, Analysis of draining lymph node cells (ac) and serum (d) from wild-type (a,b) and ZsGreen_T-bet (c) reporter mice infected with the indicated pathogens at the early peak GC response. Analysis of B220+IgDloCD95+CD38 GC B cells (a) and B220+IgDloCD95CD38+ MBCs (LCMV n = 8; influenza n = 8; T.muris n = 6; H. polygyrus n = 9; and C.rodentium n = 8 mice per group) (b). Correlation of the frequency of MBC with the ratio of Teff:TFH cells and ZsGreen_T-bet reporter expression gMFI across infections (c). Serum IgG isotype concentration (d). The data are from 6–10 mice per group and are presented as the mean ± s.e.m. Statistical tests included one-way ANOVA for multiple comparisons and Pearson correlation with two-tailed P values. ****P < 0.0001 or otherwise indicated. Source Data
Fig. 3
Fig. 3. Identification of conserved TFH and TFR signatures.
aj, Bulk RNA-seq of sorted CD4+CD44+PD-1+CXCR5+FoxP3-RFPIL-21–GFP+ TFH, CD4+CD44+PD-1+CXCR5+FoxP3-RFPIL-21–GFP TFH, CD4+CD44+PD-1+CXCR5+FoxP3-RFP+IL-21–GFP+ TFR, and CD4+CD44+PD-1CXCR5FoxP3-RFPIL-21–GFP Teff cells from the draining lymph nodes of the mice infected with pathogens described in Fig. 1. MA plot visualizing the log fold change (FC) in the mean expression of genes expressed differentially between the TFH and Teff populations for the five infections (a). UpSet plot showing intersections of genes differentially expressed between the TFH and Teff populations for each infection (b). Common DE genes across three or more infections were used to derive the core TFH signature. False discovery rate (FDR) < 0.05. Heatmap of core TFH signature genes (row-based z scores of normalized log2 counts per million) for cytokine and cell surface receptor genes (c) and transcriptional regulator genes (d). GSEA of differentially expressed genes in TFH (TFH versus Teff comparison), TFR (TFR versus Teff), and Teff cells (Teff versus TFH) for all infections (e,f). NES of TFH, non-TFH, GC TFH, GC B, human TFH and cancer-associated TFH cell programs (e) and precursors of exhausted (TPEX), exhausted progenitor (TPROG) and long-term hematopoietic stem cell (HSC-LT) gene programs in the TFH, TFR and Teff populations (f). The NES score represents the enrichment of genes (sets) relative to each comparison, correcting for multiple testing. UpSet plot of the TFR signature showing intersections of upregulated genes expressed differentially between the TFR versus TFH cell contrast population and the TFR versus Teff cell contrast population for five infections (g). FDR < 0.05. Heatmap of TFR signature genes shared across contrasts (TFR versus TFH and TFR versus Teff) (row-based z score of normalized log2 counts per million) for cytokine and cell surface receptor genes (h) and transcriptional regulator genes (i). Bubble plot of Bcl-6 network transcriptional regulator genes in the TFH core showing log2FC differences in the TFH (TFH versus Teff contrast) and TFR (TFR versus Teff contrast) populations (j). The size of the bubble represents the −log10(FDR), and the color indicates the log2FC compared to Teff cells. The colored bar indicates genes present in the TFH core and Bcl-6 gene sets from Extended Data Fig. 5g. Novel genes proposed to be independent of the Bcl-6 network are indicated with gray bars. The data represent independent samples of 2–3 per cell type per infection. Source Data
Fig. 4
Fig. 4. Identification of pathogen-specific TFH phenotypes.
ag, Bulk RNA-seq of sorted CD4+CD44+PD-1+CXCR5+FoxP3-RFPIL-21–GFP+ TFH, CD4+CD44+PD-1+CXCR5+FoxP3-RFPIL-21–GFP TFH cells from the draining lymph nodes of mice infected with the indicated pathogens (as in Fig. 1). MDS plot of CD4+CD44+PD-1+CXCR5+FoxP3-RFPIL-21–GFP+ TFH transcriptomes showing the separation of samples by infection type along dims 1 and 2 (a). Genes expressed differentially for TFH (single infection vs. all other infections) and Teff cells (single infection versus all other infections) (FDR < 0.05) (b). Orange, common pathogen-specific DE genes in both TFH and Teff cells; blue, pathogen-specific signatures unique to TFH cells; red, pathogen-specific signatures unique to Teff cells. Heatmaps of pathogen-specific TFH signature genes (average row-based z score of normalized log2 counts per million) for selected cytokine and cell surface receptor genes (c) and transcriptional regulator genes (d). Cytokine pathway genes from Mouse Genome Informatic (MGI) database gene sets indicated in colored circles. IFN (red), TNF (purple), IL-1 (pink), TGFβ (blue), IL-4 (green), IL-6 (yellow) and IL-17 (orange). Heatmap of pathogen-specific TFH signature genes (average row-based z score of normalized log2 counts per million) for selected signature-defining cytokines and chemokines for each infection (e) and lineage-defining transcription factors (f). GSEA of pathogen-specific signatures via MGI MSigDB ‘Hallmark’ gene sets for cytokine signaling and response (g). Bubble size represents the -log10(FDR), and color indicates the NES. The data represent independent samples of 2–3 per cell type per infection. h, Analysis of draining lymph node CD4+CD44+CXCR5+PD-1+Ly6CCD162 TFH cells from wild-type mice infected with indicated pathogens (as in Fig. 1) displaying gMFI of pathogen-specific TFH signature marker (LCMV n = 7; T.muris n = 5; and C.rodentium n = 7 mice per group). Data show experiments of 5–7 mice per group and mean ± s.e.m. Statistical tests were one-way ANOVA of multiple comparisons and Pearson correlation with two-tailed P values. ****P < 0.0001 or otherwise indicated. Source Data
Fig. 5
Fig. 5. Pathogen-specific TFH phenotypes are directed by distinct cytokine signaling pathways.
ad, Analysis of draining lymph nodes from Tgfbr2-LckCre and LckCre control mice infected with influenza A virus in intact mice (a,c,d) and 50:50 bone marrow chimera mice (b). CXCR3+ TFH1, CXCR3CCR6 TFH2, and CCR6+ TFH17 cells within CD4+CD44+CXCR5+PD-1+Ly6CCD162 TFH cells are displayed as parts of the whole population (a,b). Frequency within TFH population, and representative histograms of CXCR3 and CCR6 expression on TFH cells (n = 9–10 mice per group) (a). The inner slice of the pie chart displays CXCR3+CCR6+ coexpression. Wild-type and Tgfbr2-LckCre cells were identified by congenic marker expression (b). Frequency of CXCR3+ TFH1, CXCR3CCR6 TFH2, and CCR6+ TFH17 cells and frequency of IFNγ+ TFH1 cells within CD4+CD44+CXCR5+PD-1+Ly6CCD162 TFH cells (n = 10 mice per group). The inner slice of the pie chart displays CXCR3+CCR6+ coexpression. IgG1 or IgG2c class switched B220+IgDloCD95+ GC B cells and CD86CXCR4+ dark zone (DZ) or CD86+CXCR4 light zone (LZ) B cells on B220+IgDloCD95+ GC B cells (n = 7–10 mice per group) (c). Serum IgG isotype concentration (d). eh Draining lymph node analysis of Ifnar−/− and Ifnar +/+ control mice infected with LCMV in intact mice (e,g,h) and 50:50 bone marrow chimera mice (f). CXCR3+ TFH1, CXCR3CCR6 TFH2, and CCR6+ TFH17 cells within CD4+CD44+CXCR5+PD-1+Ly6CCD162 TFH cells are displayed as parts of the whole population (e,f). Frequency within TFH population, and representative histograms of CXCR3 and CCR6 expression on TFH cells (n = 7 mice per group) (e). The inner slice of the pie chart displays CXCR3+CCR6+ coexpression. Wild-type and Ifnar−/− cells were identified by congenic marker expression (f). Frequency of CXCR3+ TFH1, CXCR3CCR6 TFH2, and CCR6+ TFH17 cells and frequency of IFNγ+ TFH1 cells within CD4+CD44+CXCR5+PD-1+Ly6CCD162 TFH cells (n = 8 mice per group). The inner slice of the pie chart displays CXCR3+CCR6+ coexpression. IgG1 or IgG2c class switched B220+IgDloCD95+ GC B cells and CD86CXCR4+ DZ or CD86+CXCR4 LZ B cells from B220+IgDloCD95+ GC B cells (n = 7 mice per group) (g). Serum IgG isotype concentration (h). The data are from 7–10 mice per group and are presented as the mean ± s.e.m. Statistical tests were a two-tailed unpaired Student’s t-test for the intact system and a two-tailed paired Student’s t-test for the bone marrow chimera model. ****P < 0.0001 or otherwise indicated. Source Data
Fig. 6
Fig. 6. Cytokine-guided TFH phenotypes are evident in human lymphoid tissue.
ae, scRNA-seq of sorted CD3+CD4+CD45RACD45RO+CXCR5+CD27+ human tonsillar TFH cells from three healthy adult donors. UMAP dimensional reduction of data depicting 11 clusters on the basis of Louvain clustering via the Jaccard similarity index (k = 9) (a). Overlay of the mean ranked scores of each pathogen-specific signature onto UMAP clusters (b). Mean of the ‘TotalScore’ from the singscore: simpleScore function collated for each cluster. Pathogen-specific upregulated signature genes used. Rank scores of pathogen-specific signatures for each pseudosample on the basis of cluster and individual donors (c). Influenza A versus LCMV (left); LCMV versus T.muris (middle); influenza A versus H.polygyrus (right). Heatmap of the mean rank scores of pathogen-specific signatures for each cluster (row-based z score of the mean rank score) (d). GSEA-vissE analysis for the comparison of C7 versus C8 (e). Top gene sets of selected clusters as bar plots of DE gene counts with corresponding gene statistics (FDR as color shade) from the DE analysis. GSEA was performed via the Hallmarks c2 (‘CP:REACTOME’, ‘CP:PID’, ‘CP:BIOCARTA’,‘CP:KEGG’) and c5 (‘GO:BP’,‘GO:MF’) collections from the MSigDB using a two-tailed approach correcting for multiple testing with the FDR adjusted to P ≤ 0.05. f, Ranked score of pathogen-specific signatures in human dataset TFH cells from donors in SARS-CoV-2 vaccine (n = 5), influenza vaccine (n = 1), malaria infection (adult n = 3, child n = 3), peanut allergy (n = 3), asthma (n = 4) and autoimmune contexts (healthy donor n = 6, systemic lupus erythematosus n = 8). Ranked scores normalized to the first time point for signatures. Data are presented as mean ± s.e.m. g, Visium spatial tonsil data displaying a ranked score of pathogen-specific signatures onto GCs highlighted by the core TFH cell signature. h, Xenium spatial human lymph node data displaying a ranked score of pathogen-specific signatures in TFH cells and GCs highlighted by the core TFH cell signature. Source Data
Fig. 7
Fig. 7. Cell surface proteins identify distinct human tonsillar TFH and cTFH phenotypes.
ae, Flow cytometry analysis of CD3+CD4+CD45RACD45RO+CXCR5+ TFH cells from five PBMC and six tonsil healthy adult donors. t-distributed stochastic neighbor embedding (t-SNE) and heatmap expression of TFH cell markers of PD-1, CXCR3, CCR6 and CCR4 (a). TFH cell populations identified by PD-1 and CD57 with expression of the TFH cell markers CXCR5, ICOS, OX40 and CCR4 on each population (b). Histograms of PD-1, CD57, CD69 and CD82 expression on TFH cells (c). Histograms of CD127, CD99, CD71 and CD151 expression on TFH cells (d). TFH populations separated into quadrants (Q1–Q4) based on expression of CD99 and CD151 markers (e). f, scCITEseq surface protein expression (log counts) of sorted CD3+CD4+CD45RACD45RO+CXCR5+CD27+ human tonsillar TFH cells from three healthy adult donors (as in ae) of cluster-identifying markers overlaid onto the scRNA-seq UMAP. g, TFH cell surface and activation markers in CD3+CD4+CD45RACD45RO+CXCR5+ human TFH cells from matched tonsil, adenoid tissue and PBMC from five healthy juvenile donors. h,i, SARS-CoV-2 Spike tetramer+ CD3+CD4+CD45RACXCR5+ cTFH cells from SARS-CoV-2 infected donors (h) at time of infection (11 of 11 donors; n = 11) and 6 months convalescence (10 of 11 donors; n = 10) and nine COVID-19 mRNA vaccinated donors (n = 9) (i) at 7 days post-vaccine and 3 months post-vaccine. Frequency of Spike tetramer+PD-1+ TFH cells, gMFI expression for CXCR3 and CCR6, and frequencies and dot plots of CD151/CD99 quadrant-separated TFH cell populations. Data show experiments of 8–11 samples per group. Statistical test was a two-tailed paired Student’s t-test. P values are indicated. Source Data
Extended Data Fig. 1
Extended Data Fig. 1. Induction of TFH response following diverse infection compared to steady state homeostasis.
a, Gating strategy to identify CD4+CD44+CXCR5+PD-1+Ly6CCD162 TFH and CD4+CD44+Ly6C+CD162+ TEFF cells and Bcl-6 expression. b, Timecourse analysis of draining lymph node GC cells from wild-type mice infected with indicated pathogens displaying frequencies and counts of CD4+CD44+CXCR5+PD-1+Ly6CCD162 TFH cells (closed circle) and B220+IgDloCD95+ GC B cells (open circle) (LCMV n = 3, influenza n = 4, H. polygyrus n = 4, C. rodentium n = 3 mice per group). T.muris data in. c, Steady state analysis of indicated lymph nodes from uninfected wild-type mice. CD4+CD44+ cell counts, frequency of CD4+CD44+CXCR5+PD-1+Ly6CCD162 TFH cells and frequency of TFH cells produced IFNγ, IL-4, and IL-17 (n = 10 mice per group). d,e Analysis of draining lymph node cells from (d) wild-type and (e) ZsGreen_T-bet reporter mice infected with indicated pathogens at early peak GC response. (d) Total lymphocyte counts, CD4+CD44+ cell counts and frequency of CD4+CD44+ cells of live cells (LCMV n = 8, influenza n = 8, T. muris n = 6, H. polygyrus n = 9, C. rodentium n = 11 mice per group). (e) ZsGreen_T-bet reporter+ frequency and gMFI of CD4+CD44+Ly6C+CD162+ TEFF cells (LCMV n = 8, influenza n = 8, T. muris n = 6, H. polygyrus n = 10, C. rodentium n = 7 mice per group). Data show experiments of 6–10 mice per group and mean ± SEM. Statistical tests: one-way ANOVA of multiple comparisons. **** P values are <0.0001 or otherwise indicated. Source Data
Extended Data Fig. 2
Extended Data Fig. 2. Conserved GC morphology in draining lymph nodes following infection with diverse pathogens.
Immunofluorescent staining of draining lymph node of infected ZsGreen_T-bet reporter mice. Boxes indicate zoom of GC shown in Fig. 1f. Data are representative of 2–3 mice per group. Yellow: CD4, blue: IgD, magenta. Scale bar consistent for all images, 200μm. Source Data
Extended Data Fig. 3
Extended Data Fig. 3. Heterogenous TFH phenotypes display diverse cytokine profiles, similar to that of TEFF and systemic cytokine milieu.
a–d Analysis of (a–c) draining lymph node cells and (d) serum from (a,b,d) wild-type and (c) IFNγ-GFPx4C13R reporter mice infected with indicated pathogens at early peak GC response. (a) Representative plots of CD4+CD44+CXCR5+PD-1+Ly6CCD162 TFH cell IFNγ, IL-4, and IL-17 cytokine production. (b) Frequency of CD4+CD44+Ly6C+CD162+ TEFF cell produced IFNg, IL-4, IL-17A. (c) IFNγ-GFPx4C13R reporter expression in CD4+CD44+CXCR5+PD-1+Ly6CCD162 TFH cells following T. muris infection. Representative plots, frequency of cytokine reporter with TFH population and displayed as parts of whole TFH population. Inner slice displays cytokine coexpression. (d) Serum cytokine concentration (pg/mL) in serum (n = 10 mice per group). Cytokines displayed as parts of total cytokines analyzed. Data show experiments of 7–10 mice per group and mean ± SEM. Statistical tests: one-way ANOVA of multiple comparisons. **** P values are <0.0001 or otherwise indicated. Source Data
Extended Data Fig. 4
Extended Data Fig. 4. Pathogen-induced TFH phenotypes correlate tailored B cell responses.
a, Gating strategy to identify GC and MBC populations. b, Analysis of B220+IgDloCD95+CD38 GC B cells from ZsGreen_T-bet reporter mice infected with indicated pathogens at early peak GC response. (b) Correlation of frequency of GC B to the ratio of TEFF/TFH cells and to ZsGreen_T-bet reporter expression gMFI across infections. Data show experiments of 6–10 mice per group. Statistical tests: Pearson correlation of two-tailed P value. Source Data
Extended Data Fig. 5
Extended Data Fig. 5. Pathogen-specific transcriptional programs separate by cell type and infection and establishment of TFH and TFR core signatures.
RNA-seq of CD4+CD44+PD-1+CXCR5+FoxP3-RFPIL-21–GFP+ TFH, CD4+CD44+PD-1+CXCR5+FoxP3-RFPIL-21–GFP TFH, CD4+CD44+PD-1+CXCR5+FoxP3-RFP+IL-21–GFP+ TFR, and CD4+CD44+PD-1CXCR5FoxP3-RFPIL-21–GFP TEFF cells from draining lymph nodes of wild-type mice infected with indicated pathogens at early peak GC response. a, Gating strategy of sorted populations. b, Principal Component Analysis (PCA) plots of sorted IL-21+ TFH, IL-21 TFH, TFR, and TEFF cell transcriptomes stratified by either (top) cell type or (bottom) infection type. Data show independent samples of 2–3 per cell type per infection. c, Analysis of draining lymph node cells from wild-type mice infected with indicated pathogens. gMFI of upregulated (CD200 and BTLA) and downregulated (CCR7) core TFH signature markers for CD4+CD44+CXCR5+PD-1+Ly6CCD162 TFH cells. Data show experiments of 5–7 mice per group and mean ± SEM. d, UpSet plot of TFR signature showing intersections of downregulated genes expressed differentially between TFR vs. TFH contrast and TFR vs. TEFF contrast for five infections. False discovery rate (FDR) < 0.05. e,f, MA plot visualizing log fold change against the mean expression of genes expressed differentially between (e) TFR and TFH cells and (f) TFR and TEFF cells for five infections. g, GSEA of differentially expressed genes in TFH (TFH vs. TEFF contrast) and TFR cells (TFR vs. TEFF contrast) combined for five infections. Barcode and ES plots displaying enrichment of genes (ES and NES) upregulated in core TFH signature (TFH Core Up), TFH genes, genes indirectly regulated by Bcl-6 through repressor-of-repressor circuits (Indirect Bcl-6-rr), genes directly repressed by Bcl-6 (Direct Bcl-6-r), and Bcl-6 target genes (Bcl-6 targets) in TFH cells (TFH vs. TEFF) contrast,,,,. Statistical tests: one-way ANOVA of multiple comparisons and Pearson correlation with two-tailed P value. **** P values are <0.0001 or otherwise indicated. Source Data
Extended Data Fig. 6
Extended Data Fig. 6. IL-21+ TFH and IL-21 TFH cells are transcriptionally similar across diverse infections.
a, UpSet plot displaying intersects of genes expressed differentially between IL-21+ TFH and IL-21 TFH cells from separate infections in bulk RNA-seq analysis of CD4+CD44+PD-1+CXCR5+FoxP3-RFPIL-21–GFP+ TFH and CD4+CD44+PD-1+CXCR5+ FoxP3-RFPIL-21–GFP TFH cells as in Fig. 3. Three genes intersecting across 4 infections indicated with arrow. b-g, Analysis of CD4+CD44+PD-1+CXCR5+CD162 TFH cells and CD4+CD44+CD162+ TEFF cells from draining lymph nodes from wild-type mice infected with indicated pathogens, LCMV or influenza A at early peak GC response. (b) Gating strategy to identify TEFF, IL-21 TFH, and IL-21+ TFH cells. (c) Representative plots and histograms of CD62L, CD127, and Ly6C staining on IL-21 TFH, IL-21+ TFH cells and TEFF cells in LCMV infection. (d-g) Frequency and gMFI of CD62L+, CD127+, and Ly6C+ on (d,f) IL-21 TFH, IL-21+ TFH cells, frequency of total TFH population (e,g) TFH and TEFF, frequency of CD4+CD44+ population. (d-e) in LCMV infection (n = 8 mice per group), (f-g) in influenza A infection (n = 6 mice per group). Data show experiments of 4–6 mice per group and mean ± SEM. Statistical tests: Two-tailed unpaired Student’s t test. **** P values are <0.0001 or otherwise indicated. Source Data
Extended Data Fig. 7
Extended Data Fig. 7. Pathogen-induced cytokine signaling influence TFH and TEFF bifurcation, TFH subpopulations, and TFH cells capacity to direct B cell and antibody output.
a, Gating strategy to identify CD4+CD44+CXCR5+PD-1+Ly6CCD162 TFH1, TFH2, TFH17, and TFH17.1 phenotypes based on expression of CXCR3 and CCR6 chemokine receptors. b-k, Analysis of draining lymph nodes from (b,c) wild-type, (d) Tgfbr2-LckCre and LckCre mice, (f) Ifnar−/− and Ifnar+/+ mice, (e,h,j,k) wild-type and Tgfbr2-LckCre 50:50 bone marrow chimeras, or (g-i,k) wild-type and Ifnar−/− 50:50 bone marrow chimera mice infected with (b,d,e,h,i,k) influenza or (c,f,g,h,j,k) LCMV. (b,c) gMFI expression of IFNg, IL-4, and IL-17 in TFH1 (CXCR3+CCR6), TFH2 (CXCR3CCR6), TFH17 (CXCR3CCR6+) and TFH17.1 (CXCR3+CCR6+) populations (influenza n = 10, LCMV n = 6 mice per group). (d,f) TFH and TEFF cell counts, TFH and TEFF cell frequencies, and TFH/TEFF cell ratio (influenza n = 9-10, LCMV n = 7 mice per group). (e,g) TFH and TEFF cell frequencies and TFH/TEFF cell ratio (influenza n = 10, LCMV n = 8 mice per group). (h) Comparison of effect of Tgfbr2-LckCre and Ifnar −/− on TFH frequency in chimeras. (i-j) Frequency of TFH1, TFH2, TFH17 and TFH17.1 cells within TFH population in chimeric mice (influenza n = 8, LCMV n = 7 mice per group). (k) Comparison of effect of Tgfbr2-LckCre and Ifnar −/− on TFH1, TFH2 and TFH17 cell frequency in influenza and LCMV infection in chimeras (Tgfbr2-LckCre influenza n = 10, Tgfbr2-LckCre LCMV n = 7, Ifnar −/− influenza n = 8, Ifnar −/− LCMV n = 8 mice per group). l, Gating strategy to identify IgG1 and IgG2 class switched GC B cells, and dark zone (DZ) and light zone (LZ) GC B cells. Data show experiments of 6–10 mice per group and mean ± SEM. Statistical tests: Two-tailed unpaired Student’s t test for intact system; two-tailed paired Student’s t test for bone marrow chimera model. **** P values are <0.0001 or otherwise indicated. Source Data
Extended Data Fig. 8
Extended Data Fig. 8. Human lymphoid tissue TFH phenotypes identified by core and pathogen-specific TFH signatures.
a, Gating strategy to sort CD3+CD4+CD45RACD45RO+CXCR5+CD27+ human tonsillar TFH cells from three healthy adult donors for paired scRNA-seq and CITE-seq. b, Overlay of mean ranked scores of core TFH and TEFF core signatures onto UMAP clusters. Mean of the ‘TotalScore’ from singscore::simpleScore function collated for each cluster. c, Distribution of TFH cells across 11 clusters by donor. d, Proportion of pathogen-specific TFH signatures overlapping with human cluster genes expressed differentially (one cluster vs. all other clusters). e, Overlay of mean ranked scores of each TEFF cell pathogen-specific signature onto UMAP clusters. Mean of the ‘TotalScore’ from singscore::simpleScore function collated for each cluster. TEFF cell pathogen-specific upregulated signature genes used. f, Gene set Enrichment and vissE analyses for the comparison Cluster 1 vs. Cluster 2. Top gene sets clusters of interest shown as barplot of DE gene counts with corresponding gene statistics (FDR as color shade) from the DE analysis. GSEA was performed using Hallmarks c2 (‘CP:REACTOME’, ‘CP:PID’, ‘CP:BIOCARTA’,‘CP:KEGG’) and c5 (‘GO:BP’,‘GO:MF’) collections from the MsigDB using a two-tailed approach correcting for multiple testing with false discovery rate (FDR) adjusted p ≤ 0.05. g, Ranked score of pathogen-specific signatures onto human dataset TFH cells from donors in SARS-CoV-2 vaccine (n = 5), influenza vaccine (n = 1), malaria infection (adult n = 3, child n = 3), peanut allergy (n = 3), asthma (n = 4) and autoimmune contexts (healthy donor n = 6, systemic lupus erythematosus n = 8). Data are presented as mean values ± SEMs. h, Visium spatial tonsil data displaying ranked score of core TFH signature. i, Xenium spatial human lymph node data displaying ranked score of core TFH signature. j, Visium spatial tonsil data displaying ranked score of pathogen-specific signatures onto germinal centers highlighted by core TFH signature. Source Data
Extended Data Fig. 9
Extended Data Fig. 9. Novel markers identify distinct human TFH subpopulations across tonsil and PBMC.
a–c, scCITEseq surface protein expression of sorted CD3+CD4+CD45RACD45RO+CXCR5+CD27+ human tonsillar TFH cells from three healthy adult donors (as in Fig. 7). scCITEseq surface protein expression (log counts) of (a) T cell identity markers, (b) chemokine receptors, and (c) cluster-identifying markers, overlaid onto scRNA-seq UMAP. d-h, CD3+CD4+CD45RACD45RO+CXCR5+ human TFH cells from five PBMC samples and six tonsil samples from healthy adult donors. (d), Gating strategy to identify TFH cells in human tonsil, adenoid, and PBMCs with PD-1+ expression in tonsil and PBMCs displayed in dot plots. (e) TFH surface marker frequency in tonsil CD57+ or CD57 TFH cells (n = 6 samples per group). (f) CD151/CD99 TFH populations (Q1-Q4) in TFH cells distinguished by CD57 and PD-1 from tonsil (n = 6 tonsils per group) and PBMCs (n = 5 PBMCs per group). (g) CXCR3, CCR6, and CCR4 expression in CD57/PD-1 and CD151/CD99 TFH populations with key to identify TFH populations distinguished by CD57 and PD-1, and TFH populations (Q1-Q4) distinguished by CD151 and CD99. (h) gMFI expression of TFH markers (PD-1, ICOS, OX40), chemokine receptor markers (CXCR3, CCR6, CCR4), and novel markers (CD127, CD99, CD71, CD151, CD43, CD69) with (+) and without (-) 4 hr PMA and ionomycin stimulation. Data show experiments of 5 PBMC samples per group and 6 tonsil samples per group and mean ± SEM. Statistical tests: one-way ANOVA of multiple comparisons. **** P values are <0.0001 or otherwise indicated. Source Data
Extended Data Fig. 10
Extended Data Fig. 10. Novel markers identify distinct human TFH subpopulations in spike tetramer-specific PBMCs of SARS-CoV-2 infected and mRNA vaccinated donors.
a, CD3+CD4+CD45RACD45RO+CXCR5+ TFH cells from six tonsil samples (n = 6) from healthy adult donors displaying TFH surface marker frequencies in TFH populations (Q1-Q4) distinguished by CD151 and CD99. b, Gating strategy to identify SARS-CoV-2 spike tetramer+ cTFH cells. c,d Spike tetramer+ cells in (c) SARS-CoV-2 infection (11/11 donors; n = 11) or 6 months convalescence (10/11 donors; n = 10), or (d) nine COVID-19 mRNA vaccinated donors (n = 9) at 7 days post-vaccine and 3 months post-vaccine. Frequency Spike tetramer+ CD3+CD4+CD45RA T cells and CD3+CD4+CD45RACXCR5+ TFH cells. Data show experiments of 8-11 samples per group. Statistical test: Two-tailed paired Student’s t test. **** P values are <0.0001 or otherwise indicated. Source Data

References

    1. O’Shea, J. J. & Paul, W. E. Mechanisms underlying lineage commitment and plasticity of helper CD4+ T cells. Science327, 1098–1102 (2010). - PMC - PubMed
    1. Medzhitov, R. Recognition of microorganisms and activation of the immune response. Nature449, 819–826 (2007). - PubMed
    1. Iwasaki, A. & Medzhitov, R. Toll-like receptor control of the adaptive immune responses. Nat. Immunol.5, 987–995 (2004). - PubMed
    1. Keck, S. et al. Antigen affinity and antigen dose exert distinct influences on CD4 T-cell differentiation. Proc. Natl Acad. Sci. USA111, 14852–14857 (2014). - PMC - PubMed
    1. Pepper, M. et al. Different routes of bacterial infection induce long-lived TH1 memory cells and short-lived TH17 cells. Nat. Immunol.11, 83–89 (2010). - PMC - PubMed

LinkOut - more resources