

Feasibility of mapping cross-country population coronavirus disease 2019 metrics in a federated design: learnings from a HealthData@EU Pilot use case
- PMID: 40926481
- PMCID: PMC12420901
- DOI: 10.1093/eurpub/ckaf017
Feasibility of mapping cross-country population coronavirus disease 2019 metrics in a federated design: learnings from a HealthData@EU Pilot use case
Abstract
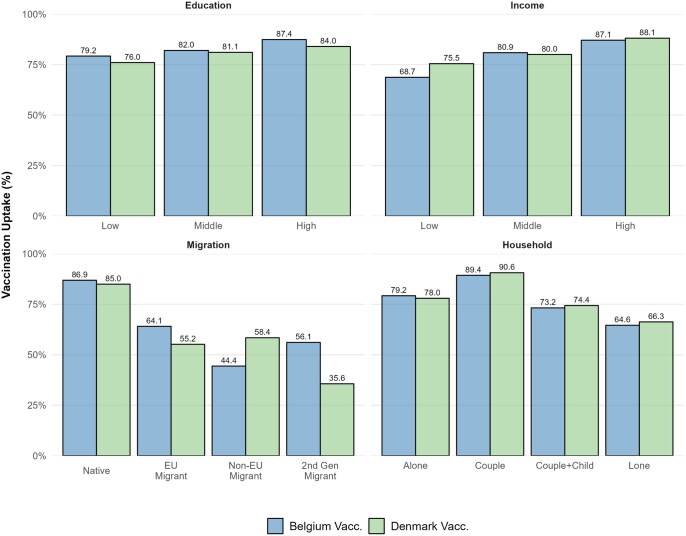
The European Health Data Space aims to transform health data management across the EU, supporting both primary and secondary uses of health data while ensuring trust through General Data Protection Regulation compliance. As part of the HealthData@EU Pilot, this study investigates coronavirus disease 2019 (COVID-19) testing, vaccination, and hospitalization metrics across six European countries, with a focus on socioeconomic disparities and challenges in cross-border data access and standardization. This observational, retrospective cohort study used a federated analysis framework across Belgium, Croatia, Denmark, Finland, and France. Data were linked from administrative, social, health, and care records within each country's trusted research environment. A Common Data Model (CDM)-guided data harmonization, enabling nodes to perform independent analyses and share aggregated results. Key data processes (discovery, access, preparation, and analysis) were decentralized, with significant variability in data access procedures, security protocols, and available resources among nodes. The study revealed substantial differences in COVID-19 testing, vaccination, and hospitalization rates across countries. Denmark exhibited notably higher testing and infection rates. However, the study encountered key challenges: complex data access procedures, fragmented and incomplete socioeconomic data, and the need for extensive harmonization. Learnings from this pilot underscore the importance of streamlined, cross-country data access and standardization processes, which the European Health Data Space (EHDS) framework aims to address. The pilot demonstrates the feasibility of federated health data analysis across multiple countries while highlighting limitations in data access and interoperability. The EHDS framework offers a promising path to overcome these barriers, supporting efficient and standardized cross-border health research in the EU.
© The Author(s) 2025. Published by Oxford University Press on behalf of the European Public Health Association.
Figures


References
-
- European Commission. European Health Data Space (EHDS). 2024. https://health.ec.europa.eu/ehealth-digital-health-and-care/european-hea... (31 October 2024, date last accessed).
-
- European Union. General Data Protection Regulation (GDPR). Regulation (EU) 2016/679. 2016. https://eur-lex.europa.eu/eli/reg/2016/679/oj (31 October 2024, date last accessed).
-
- European Union. Data Governance Act. Regulation (EU) 2022/868. 2022. https://eur-lex.europa.eu/legal-content/EN/TXT/?uri=CELEX%3A32022R0868 (31 October 2024, date last accessed).
-
- European Union. Data Act. Proposal for a Regulation on Harmonised Rules on Fair Access to and Use of Data. 2024. https://eur-lex.europa.eu/legal-content/EN/TXT/?uri=CELEX%3A32023R2854 (31 October 2024, date last accessed).
-
- HealthData@EU Pilot Project. HealthData@EU Pilot. 2024. https://ehds2pilot.eu/ (31 October 2024, date last accessed).
Publication types
MeSH terms
Grants and funding
LinkOut - more resources
Full Text Sources
Medical
Research Materials
Miscellaneous
