. 2025 Aug 25:6:1594753.
doi: 10.3389/fresc.2025.1594753. eCollection 2025.

Machine learning predicts improvement of functional outcomes in spinal cord injury patients after inpatient rehabilitation

Affiliations

Machine learning predicts improvement of functional outcomes in spinal cord injury patients after inpatient rehabilitation

Mohammad Rasoolinejad et al. Front Rehabil Sci. .

Abstract

Introduction: Spinal cord injury (SCI) presents a significant burden to patients, families, and the healthcare system. The ability to accurately predict functional outcomes for SCI patients is essential for optimizing rehabilitation strategies, guiding patient and family decision making, and improving patient care.

Methods: We conducted a retrospective analysis of 589 SCI patients admitted to a single acute rehabilitation facility and used the dataset to train advanced machine learning algorithms to predict patients' rehabilitation outcomes. The primary outcome was the Functional Independence Measure (FIM) score at discharge, reflecting the level of independence achieved by patients after comprehensive inpatient rehabilitation.

Results: Tree-based algorithms, particularly Random Forest (RF) and XGBoost, significantly outperformed traditional statistical models and Generalized Linear Models (GLMs) in predicting discharge FIM scores. The RF model exhibited the highest predictive accuracy, with an R-squared value of 0.90 and a Mean Squared Error (MSE) of 0.29 on the training dataset, while achieving 0.52 R-squared and 1.37 MSE on the test dataset. The XGBoost model also demonstrated strong performance, with an R-squared value of 0.74 and an MSE of 0.75 on the training dataset, and 0.51 R-squared with 1.39 MSE on the test dataset. Our analysis identified key predictors of rehabilitation outcomes, including the initial FIM scores and specific demographic factors such as level of injury and prehospital living settings. The study also highlighted the superior ability of tree-based models to capture the complex, non-linear relationships between variables that impact recovery in SCI patients.

Discussion: This research underscores the potential of machine learning models to enhance the accuracy of outcome predictions in SCI rehabilitation. The findings support the integration of these advanced predictive tools in clinical settings to better guide decision making for patients and families, tailor rehabilitation plans, allocate resources efficiently, and ultimately improve patient outcomes.

Keywords: acute rehabilitation; computational modelling; functional outcomes; machine learning; spinal cord injury (SCI).


Conflict of interest statement

The authors declare that the research was conducted in the absence of any commercial or financial relationships that could be construed as a potential conflict of interest. The author(s) declared that they were an editorial board member of Frontiers, at the time of submission. This had no impact on the peer review process and the final decision.

Figures

Figure 1
Figure 1
Pearson correlation map showing the correlations between all variables. A positive correlation coefficient (yellow) indicates a positive linear relationship, while a negative correlation coefficient (dark blue) indicates a negative linear correlation.
Figure 2
Figure 2
T-test bar plots of FIM scores with pre-rehab scores shown in yellow and post-rehab scores shown in blue. All metrics showed a statistically significant improvement after rehab. ***p < 0.001.
Figure 3
Figure 3
PCA scatter plots and variable contributions. The scatter plots (A) visualize individuals color-coded by their discharge FIM scores. Higher scores are shown with more yellow colors. The bar plots (B) display the contributions of variables to the first and second principal components, and the radar plot (C) illustrates the overall variable contributions with arrows color-coded by their contribution values.
Figure 4
Figure 4
Model performance measured by R-squared and MSE. (A) Bar plots with error bars of the R-squared of the train and test sets of models. (B) Bar plots with error bars of the Mean Squared Error (MSE) of the train and test sets of models. The highest R-squared value and the lowest MSE value is noted in the RF group, suggestive of a highly accurate model.
Figure 5
Figure 5
Heatmap of test R-squared for eleven models and eighteen dependent variables. The fill of the heatmap represents the test R-squared value of the given model and dependent variable. The density map on the upper left showed that R-squared values skewed to the left and mostly clustered between 0 and 1. Higher values (shown in yellow) represent higher R-squared values and by extension better model performance.
Figure 6
Figure 6
Feature identification using GLM models and dendrogram algorithm. (A) Coefficient of independent variables in three GLM models ranked by dendrogram algorithm. (B) Frequencies of coefficients being chosen (non-zero) in the three GLM models. On a scale of 0–1, 1 (bright yellow) indicates the variable is selected 100% of the time (n = 90).
Figure 7
Figure 7
Feature identification using GLM models organized by variable categories. (A) Coefficients of independent variables in relation to rehab outcomes, with yellow representing positive outcome predictions and dark green representing negative predictions. Range = −1.28 to 0.6. (B) Frequencies of coefficients being chosen (non-zero) in the three GLM models. On a scale of 0–1, 1 (bright yellow) indicates the variable is selected 100% of the time (n = 90).
Figure 8
Figure 8
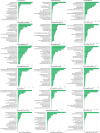
SHAP summary plots for the random forest model across 16 of the 18 FIM prediction domains. Each plot shows the features ranked by their mean absolute SHAP value, indicating their overall importance for the model's predictions for that specific outcome. The features listed at the top of each plot are the most impactful for that prediction.

Similar articles

References

    1. Jain NB, Ayers GD, Peterson EN, Harris MB, Morse L, Connor O, et al. Traumatic spinal cord injury in the United States, 1993–2012. JAMA. (2015) 313(22):2236–43. 10.1001/jama.2015.6250 - DOI - PMC - PubMed
    1. Merritt CH, Taylor MA, Yelton CJ, Ray SK. Economic impact of traumatic spinal cord injuries in the United States. Neuroimmunol Neuroinflamm. (2019) 6:9. 10.20517/2347-8659.2019.15 - DOI - PMC - PubMed
    1. Mashola MK, Mothabeng DJ. Associations between health behaviour, secondary health conditions and quality of life in people with spinal cord injury. Afr J Disabil. (2019) 8:463. 10.4102/ajod.v8i0.463 - DOI - PMC - PubMed
    1. Ahuja CS, Wilson JR, Nori S, Kotter MRN, Druschel C, Curt A, et al. Traumatic spinal cord injury. Nat Rev Dis Primers. (2017) 3:17018. 10.1038/nrdp.2017.18 - DOI - PubMed
    1. Saltychev M, Lahdesmaki J, Jokinen P, Laimi K. Pre- and postintervention factor structure of functional independence measure in patients with spinal cord injury. Rehabil Res Pract. (2017) 2017:6938718. 10.1155/2017/6938718 - DOI - PMC - PubMed

LinkOut - more resources