. 2025 Sep 12;11(37):eadw1702.
doi: 10.1126/sciadv.adw1702. Epub 2025 Sep 10.

CD8+HLA-DR+CD27+ T cells define a population of naturally occurring regulatory precursors in humans

Affiliations

CD8+HLA-DR+CD27+ T cells define a population of naturally occurring regulatory precursors in humans

Huidong Guo et al. Sci Adv. .

Abstract

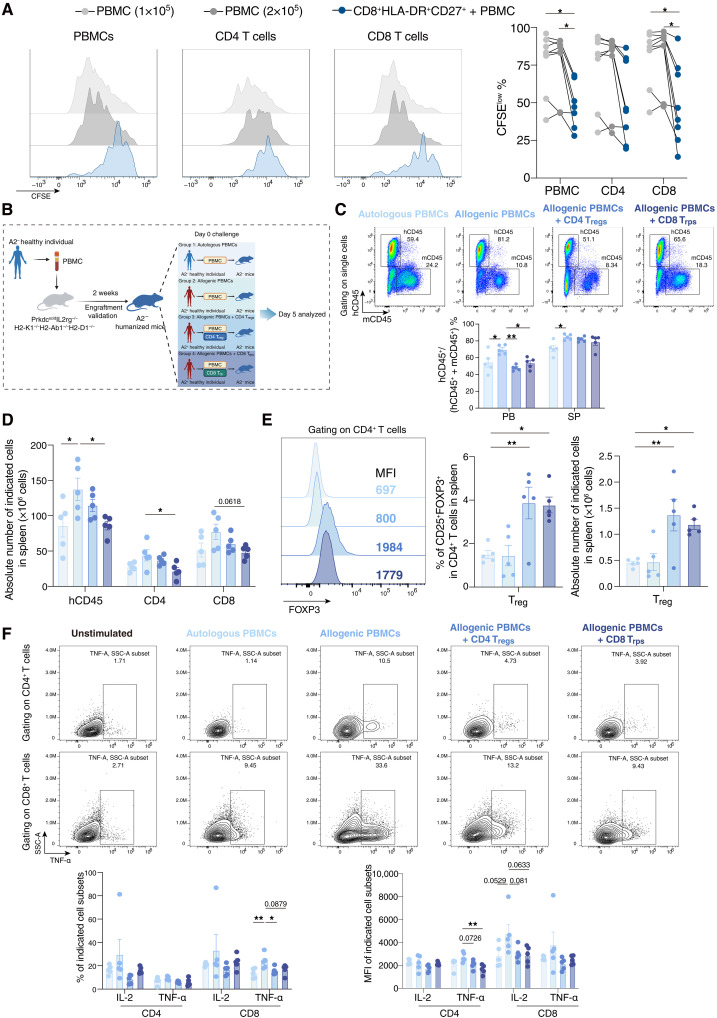
Regulatory Treg cells are essential for immune homeostasis. While CD4 Treg cells are well characterized, CD8 Treg cells remain less understood and are primarily observed in pathological or experimental contexts. Here, we identify a naturally occurring CD8 regulatory precursor Trp cell at the steady state, defined by a CD8+HLA-DR+CD27+ phenotype and a transcriptome resembling CD4 Treg cells. Multiomics analyses reveal activation of TCF7 and costimulatory and co-inhibitory molecules in CD8 Trp cells. CD8 Trp cells suppress T cell expansion in vitro and in vivo. In a humanized xenogeneic graft-versus-host disease (GVHD) model, they dampen T cell activation, alleviate GVHD pathology, and prolong survival without impairing antileukemia activity. Mechanistically, CD8 Trp cells promote immune regulation by inducing FOXP3 expression in both CD4 Treg cells and themselves. Their expansion also correlates with immune homeostasis restoration post-allogeneic stem cell transplantation. These findings establish CD8 Trp cells as a naturally occurring regulatory precursor population that promotes transplantation tolerance.


Figures

Fig. 1.
Fig. 1.. Immunophenotype characterization of CD8+ regulatory precursor cells in the homeostatic state.
(A) Schematic illustration of the experimental workflow. Comprehensive immunological analysis is performed on PBMCs obtained from healthy individuals (n = 10) and homeostatic recipients following Haplo-SCT (n = 12) or MSDT (n = 9). (B) Flow cytometry analysis of CD8+ T cell subsets including Tnaive (Tn), Tcm, Tem, and Temra cell distribution within the CD8+HLA-DR+ and CD8+HLA-DR populations from the healthy individual group, Haplo-SCT recipient group, and MSDT recipient group. (C) Flow cytometry analysis of CD8+ T cell subsets including Tnaive, Tcm, Tem, and Temra cell distribution within the CD8+CD27+ and CD8+CD27 populations from the healthy individual group, Haplo-SCT recipient group, and MSDT recipient group. (D) Distribution of CD8+ T cell subsets including Tnaive, Tcm, Tem, and Temra cells within the four quadrants extinguished by HLA-DR and CD27 in CD8+ T cells. Representative graph from the Haplo-SCT recipient group. (E) UMAP visualization of spectrum flow cytometry–detected CD3+ T cells from the healthy individual group, Haplo-SCT recipient group, and MSDT recipient group. (F) UMAP visualization of spectrum flow cytometry–detected CD8+ T cells from the healthy individual group, Haplo-SCT recipient group, and MSDT recipient group. (G and H) Heatmaps of the expression level of indicated markers in CD8+ T cells from the healthy individual group, Haplo-SCT recipient group, and MSDT recipient group. Unpaired t test for comparison between two groups. Error bars represent the means ± SEM. **P < 0.01, ***P < 0.001, ****P < 0.0001.
Fig. 2.
Fig. 2.. Protein and transcriptomic expression patterns of CD8+HLA-DR+CD27+ T cells.
(A and B) Representative histogram (A) and summary of median fluorescence intensity (MFI) (B) showing protein expression levels for the indicated markers of HLA-DR+CD27+, HLA-DRCD27+, HLA-DRCD27, and HLA-DR+CD27 within CD8+ T cells from the healthy individual group (n = 10), Haplo-SCT recipient group (n = 12), and MSDT recipient group (n = 9). (C) Heatmap of protein levels of CD8+HLA-DR+CD27+ and CD8+HLA-DRCD27 T cells from the indicated groups. (D) Principal components analysis (PCA) of classic CD8+ T cell subsets, including Tnaive, Tcm, Tem, and Temra cells, along with the CD8+HLA-DR+CD27+ and CD8+HLA-DRCD27 subsets. (E) Volcano plot showing the differentially expressed genes (DEGs) between CD8+HLA-DR+CD27+ T cells and CD8 Tnaive cells. (F) The top 50 CD8 Trp cell signature genes, identified from single-cell data in our previous study, were extracted, and their enrichment scores across different groups were calculated using the GSVA package. (G) Heatmap showing the expression levels of selected genes across different groups. (H) Gene enrichment in CD8+HLA-DR+CD27+ T cells and CD4 Treg cells relative to CD8 and CD4 Tnaive cells, respectively. (I) Transcripts per million (TPM) of the indicated genes across different groups. CD8 Trp, CD8+HLA-DR+CD27+; CD8 Tnaive, CD8+CCR7+CD45RA+; CD8 Tcm, CD8+CCR7+CD45RA; CD8 Tem, CD8+CCR7CD45RA; CD8 Temra, CD8+CCR7CD45RA+; CD4 Treg, CD4+CD25+CD127low; CD4 Tnaive, CD4+CD25lowCCR7+CD45RA+. A one-way ANOVA was applied for comparisons among four groups. For the RNA-seq data of sorted T cell subsets from healthy individuals, classical subsets were sorted from four donors, and CD8+HLA-DR+CD27+ and CD8+HLA-DRCD27 subsets were sorted from five donors. *P < 0.05, **P < 0.01, ***P < 0.001, ****P < 0.0001.
Fig. 3.
Fig. 3.. CD8 Trp cells suppress T cell proliferation and activation in vitro and in vivo.
(A) Proliferation analysis of PBMCs with or without coculture with CD8+HLA-DR+CD27+ T cells (n = 8). Combined data from two independent experiments. (B) Schematic illustration of the experimental workflow for in vivo MLR. Tregs, Treg cells; Trps, Trp cells. (C) Representative flow cytometry graph and statistical analysis of hCD45+ cell engraftment in humanized mice from the peripheral blood (PB) and spleen (SP). (D) Absolute number of hCD45+ cells in the spleen of humanized mice. (E) Representative flow cytometry graph showing FOXP3 expression in CD4+ T cells and statistical analysis of the proportion and absolute number of CD4 Treg cells in the spleen of humanized mice from the indicated groups. (F) Representative flow cytometry graph and statistical analysis of cytokine secretion levels in CD4+ or CD8+ T cells of humanized mice from the indicated groups. A paired t test was applied for comparison between two groups, and a one-way ANOVA was applied for comparisons among four groups. Each group included five mice. The data shown represent one experiment of three independent experiments. Symbols indicate individual mice, and error bars represent the means ± SEM. *P < 0.05, **P < 0.01.
Fig. 4.
Fig. 4.. CD8 Trp cells inhibit GVHD damage in humanized xenogeneic GVHD models.
(A) Schematic illustration of the experimental workflow for the humanized xenogeneic GVHD (x-GVHD) model. (B) Survival curve, weight changes, and GVHD scores of humanized x-GVHD models. Twenty-two mice for group 1, 22 mice for group 2, and 19 mice for group 3. Median survival: group 1, 21 days; group 2, 30 days; group 3, 31 days. Combined data from three independent experiments. (C) Representative flow cytometry graph and statistical analysis of hCD45+ cell engraftment in x-GVHD mice from the peripheral blood (PB) and spleen (SP). (D) Representative flow cytometry graph and statistical analysis of CD4 Treg cells in x-GVHD mice from the indicated groups. (E) Representative flow cytometry graph and statistical analysis of activation markers expression levels in CD4+ and CD8+ T cells in x-GVHD mice from the indicated groups. (F) Representative flow cytometry graph and statistical analysis of cytokine secretion levels in CD4+ and CD8+ T cells in x-GVHD mice from the indicated groups. (G) and (H) Tumor growth was monitored using bioluminescence imaging (BLI) on the dates indicated. (I) Survival curve of humanized x-GVHD and GVL models. Group 1: THP-1 alone, median survival of 41 days; group 2: PBMCs + THP-1, median survival of 33 days; group 3: PBMCs + THP-1 + CD4 Treg cells, median survival of 39 days; group 4: PBMCs + THP-1 + CD8 Trp cells, median survival of 42 days. Each group included five mice. Unless otherwise indicated, the data shown are representative of one of three independent experiments. For the comparison of recipient survival among groups, the log-rank test was used to determine statistical significance. A one-way ANOVA was applied for comparisons among three groups. Symbols indicate individual mice, and error bars represent the means ± SEM. *P < 0.05, **P < 0.01, ***P < 0.001, ****P < 0.0001.
Fig. 5.
Fig. 5.. CD8 Trp cells enrich precursors of CD8+FOXP3+ T cells.
(A) Representative flow cytometry graph and statistical analysis of FOXP3 expression levels in CD4+ and CD8+ T cells from x-GVHD mice across the indicated groups. Thirteen mice for group 1, 14 mice for group 2, and 15 mice for group 3. Combined data from three independent experiments. (B) FOXP3 expression levels in CD4 Treg cells with or without coculture with CD8 Trp cells (n = 4). (C) FOXP3 expression levels in CD4 Tcon cells stimulated with either IgG or HLA-DR agonist antibody (n = 5, P = 0.0099, paired t test). (D) Representative flow cytometry graph and statistical analysis of FOXP3 expression levels in the specific groups under the steady state and TGF-β stimulation. (E) Proliferation analysis of HLA-A02:01–positive PBMCs with or without coculture with HLA-A02:01–negative CD8+HLA-DR+CD27+ T cells (n = 8). Combined data from two independent experiments. (F) Representative flow cytometry graph of FOXP3 expression levels in the indicated groups. (G) Statistical analysis of FOXP3 expression levels in the indicated groups (n = 4). (H) Statistical analysis of FOXP3 expression levels in CD8 Trp cells before and after coculture with PBMCs (n = 4). (I) Expression levels of CD4 Treg cell signature proteins, including FOXP3, CD25, CTLA-4, and HELIOS, in long-term in vitro cultures of CD4 Treg cells and CD8 Trp cells (n = 5). d, days. (J) TGF-β levels in supernatants from the indicated groups during long-term in vitro cultures (n = 5). (K) Relative levels of 5-methylcytosine (5mC) DNA methylation measured by qMSP (n = 3). A paired/unpaired t test for comparison between two groups, and a one-way ANOVA was applied for comparisons among three groups. Symbols indicate individual samples, and error bars represent the means ± SEM. Unless otherwise noted, the data shown represent one of two or three independent experiments. *P < 0.05, **P < 0.01, ***P < 0.001.
Fig. 6.
Fig. 6.. Epigenomic signatures of CD8 Trp cells.
(A) Volcano plots showing genes proximal to differential accessible regions in CD8 Trp cells compared to CD8 DN T cells. (B) Volcano plots showing genes proximal to differential accessible regions in CD4 Treg cells compared to CD4 Tcon cells. (C) Overlap between DEGs and different accessibility-proximal genes in CD8 Trp cells compared to CD8 DN T cells. (D) Integrated analysis of RNA-seq and ATAC-seq data. DEGs and DA peak-proximal genes in CD8 Trp cells compared to CD8 DN T cells. (E) Enriched transcription factor motifs in the differential accessible peaks of CD8 Trp cells compared to CD8 DN T cells are shown. (F) WashU browser views show the gene expression level (RNA-seq) and chromatin accessibility (ATAC-seq) of specific genes in the indicated groups. n = 5. CD8 Trp, CD8+HLA-DR+CD27+; CD8 DN, CD8+HLA-DRCD27; CD8 Tnaive, CD8+CCR7+CD45RA+; CD8 Tcm, CD8+CCR7+CD45RA; CD8 Tem, CD8+CCR7CD45RA; CD8 Temra, CD8+CCR7CD45RA+.
Fig. 7.
Fig. 7.. Proportion and signature of CD8 Trp cells in healthy individuals, homeostatic recipients, and cGVHD recipients following allo-HSCT.
(A) Representative flow cytometry graph of CD8 Trp cells in healthy individuals, homeostatic recipients, and cGVHD recipients following allo-HSCT. (B) Statistical analysis of the proportion of HLA-DR+CD27+ in CD8+ T cells from healthy individuals (n = 10), homeostatic recipients (n = 21), and cGVHD recipients (n = 12) following allo-HSCT. (C) Distribution of classical T cell subsets in CD8+HLA-DR+CD27+ T cells across different groups. (D) Expression level of signature genes in CD8+HLA-DR+CD27+ T cells across different groups. CD8 Tnaive, CD8+CCR7+CD45RA+; CD8 Tcm, CD8+CCR7+CD45RA; CD8 Tem, CD8+CCR7CD45RA; CD8 Temra, CD8+CCR7CD45RA+. A one-way ANOVA was applied for comparisons among three groups. Symbols indicate individual participants, and error bars represent the means ± SEM. *P < 0.05, **P < 0.01, ***P < 0.001.

References

    1. Sakaguchi S., Yamaguchi T., Nomura T., Ono M., Regulatory T cells and immune tolerance. Cell 133, 775–787 (2008). - PubMed
    1. Bezie S., Anegon I., Guillonneau C., Advances on CD8+ Treg cells and their potential in transplantation. Transplantation 102, 1467–1478 (2018). - PubMed
    1. Niederlova V., Tsyklauri O., Chadimova T., Stepanek O., CD8+ Tregs revisited: A heterogeneous population with different phenotypes and properties. Eur. J. Immunol. 51, 512–530 (2021). - PubMed
    1. Koh C. H., Lee S., Kwak M., Kim B. S., Chung Y., CD8 T-cell subsets: Heterogeneity, functions, and therapeutic potential. Exp. Mol. Med. 55, 2287–2299 (2023). - PMC - PubMed
    1. Fontenot J. D., Rasmussen J. P., Williams L. M., Dooley J. L., Farr A. G., Rudensky A. Y., Regulatory T cell lineage specification by the forkhead transcription factor foxp3. Immunity 22, 329–341 (2005). - PubMed

MeSH terms

Substances