. 2025 Sep 12;11(37):eadx2666.
doi: 10.1126/sciadv.adx2666. Epub 2025 Sep 10.

Acute REM sleep deprivation alleviated depression-like behavior mediated by inhibiting VIP neurons in the mPFC

Affiliations

Acute REM sleep deprivation alleviated depression-like behavior mediated by inhibiting VIP neurons in the mPFC

Yuxuan Zhu et al. Sci Adv. .

Abstract

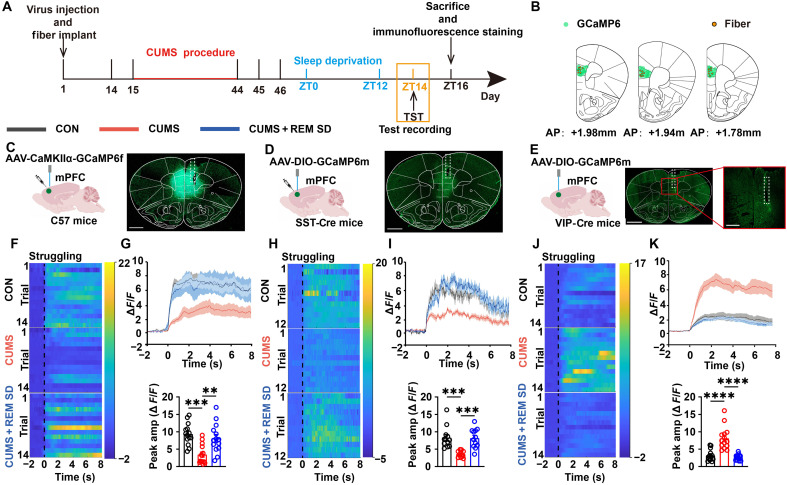
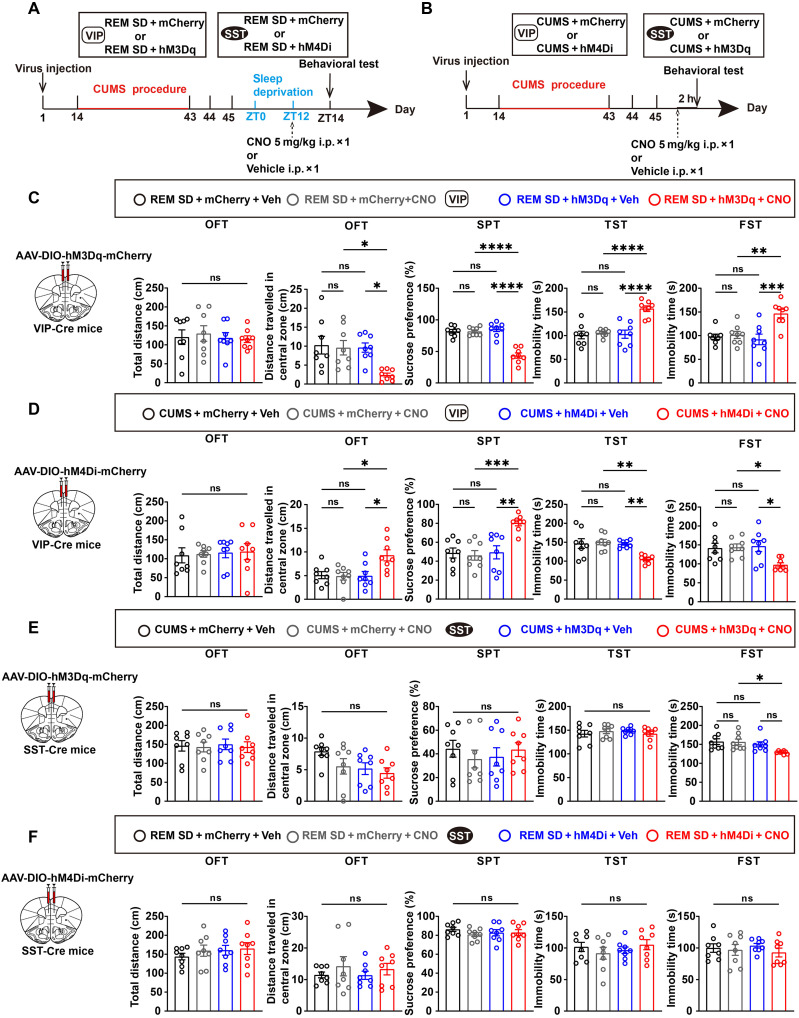
Acute sleep deprivation (SD) rapidly alleviates depression, addressing a critical gap in mood disorder treatment. Rapid eye movement SD (REM SD) modulates the excitability of vasoactive intestinal peptide (VIP) neurons, influencing the synaptic plasticity of pyramidal neurons. However, the precise mechanism remains undefined. To investigate this, we used a modified multiple platform method (MMPM) to induce 12 hours of REM SD, specifically targeting VIP neurons in the medial prefrontal cortex (mPFC). Our results show that REM SD mitigated depression by suppressing VIP neurons activity, which directly increased the excitability of pyramidal neurons and, consequently, promoted synaptic plasticity recovery. In addition, the knockdown of VPAC2 on mPFC pyramidal neurons revealed that VPAC2-mediated AC/cAMP/PKA signaling pathway in these neurons is essential for REM SD to mitigate depression-like behavior. These findings suggest that VIP neurons directly regulate pyramidal neurons and are crucial in alleviating depression by REM SD.


Figures

Fig. 1.
Fig. 1.. Twelve-hour acute REM SD alleviated depression-like behavior.
(A) Schematic of experimental approach and timeline. (B) Left: Summary data of the distance traveled in OFT. n = 8 mice (CON) and n = 7 mice (CUMS and REM SD). Right: Summary data of the distance traveled in the central zone. n = 8 mice (CON) and n = 7 mice (CUMS and REM SD). (C) Top: Schematic of the conditions for SPT. Bottom: Summary data of the percentage of sucrose preference by volume consumed in SPT. n = 8 mice (CON) and n = 7 mice (CUMS and REM SD). (D) Top: Schematics of the conditions for TST. Bottom: Summary data of the immobility time (s) in TST. n = 7 mice (CON and CUMS) and n = 8 mice (REM SD). (E) Top: Schematics of the conditions for FST. Bottom: Summary data of the immobility time (s) in FST. n = 7 mice (CON and CUMS) and n = 8 mice (REM SD). (F) Left: Representative trajectory map patterns of moving paths of mice in OFT. Middle: Representative heatmap patterns of moving paths of mice in OFT. Right: Representative activity map patterns of moving paths of mice in OFT. Data are presented as means ± SEM. *P < 0.05 and ****P < 0.0001; one-way analysis of variance (ANOVA) with Tukey’s post hoc test. ns, not significant.
Fig. 2.
Fig. 2.. Recovery of synaptic plasticity following REM SD.
(A) Schematics of the timeline of behavioral test and Golgi staining. (B) Top: Representative images of neuron tracing plots and Sholl analysis. Bottom: Quantification of dendritic intersection in the mPFC. n = 12 neurons from four mice (CON) and n = 10 neurons from four mice (CUMS and REM SD). (C) Summary of all intersections of a single neuron from (B). (D) Left: Representative Golgi staining showing dendritic branches in the mPFC. Scale bars, 50 μm. Right: Representative images of secondary dendritic spines in the mPFC. Scale bars, 2 μm. (E) Top: Schematics of the dendritic spine types. Bottom: Quantification of total dendritic spine density in mPFC. n = 26 dendrites from four mice (CON and CUMS) and n = 27 dendrites from four mice (REM SD). (F to H) Quantification of the ratio of spine type in the mPFC dendritic spine: mushroom (F), stubby (G), thin (H). n = 26 dendrites from four mice (CON and CUMS) and n = 27 dendrites from four mice (REM SD). (I) Representative Western blots images. (J) Quantification of GluA1, p-GluA1, GluA2, and p-GluA2 levels expressed as the ratio of the CON groups. n = 4 mice per group for GluA1, GluA2, and p-GluA2. n = 3 mice per group for p-GluA1. (K) Representative field excitatory postsynaptic potentials (fEPSPs) in different groups. The black trace represents fEPSP before theta burst stimulation (TBS) stimulation. The red trace represents fEPSP after TBS stimulation. Scale bars, 1 mV, 30 ms. (L) Time course of changes in fEPSPs slopes under different treatments. n = 4 mice per group. (B) Data are presented as means ± SEM, two-way ANOVA with Bonferroni’s post hoc test. [(C) to (K)] Data are presented as means ± SEM, one-way ANOVA with Tukey’s post hoc test. *P < 0.05, **P < 0.01, ***P < 0.001, and ****P < 0.0001.
Fig. 3.
Fig. 3.. Different types of mPFC neurons were recruited during struggling in the TST.
(A) Schematics of TST timeline and immunofluorescence staining. (B) Fiber placement in coronal brain sections registered to the common coordinate framework, one to two sections for each animal. (C) Viral injection schematic (left) and representative GCaMP6f expression image in the mPFC were taken from C57 mice. Scale bar, 1 mm. (D and E) Viral injections schematic (left) and representative GCaMP6m-expression image in the mPFC was taken from SST-Cre mice (D) or VIP-Cre mice (E). Scale bars, 1 mm [(D) and (E), left]. Scale bar, 500 μm ([(E), right]. (F, H, and J) Heatmaps of ΔF/F illustrating the Ca2+ signals in mPFC pyramidal, SST, and VIP neurons during the struggling events when C57 mice (F), SST-Cre mice (H), or VIP-Cre mice (J) occurred in TST. Time 0 represents the time at which the struggling events occurred during TST. n = 14 trials from seven mice per group [(F) and (J)]. n = 12 trials from six mice per group (H). (G, I, and K) Top: Peri-event plots of ΔF/F Ca2+ signals in mPFC pyramidal (G), SST (I), and VIP (K) neurons during the struggling events in TST. The solid line and the shaded regions are the means ± SEM. n = 14 trials from seven mice per group [(G) and (K)]. n = 12 trials from six mice per group (I). Bottom: Compared the peak amplitude of the Ca2+ signals of mPFC pyramidal (G), SST (I), and VIP (K) neurons when the struggling events occurred during TST. Data are presented as means ± SEM. **P < 0.01, ***P < 0.001, and ****P < 0.0001; one-way ANOVA with Tukey’s post hoc test.
Fig. 4.
Fig. 4.. Chemogenetic inhibition of VIP neurons prevents depression-like phenotypes.
(A and B) Experimental design for hM3Dq-DREADD or hM4Di-DREADD validation after REM SD (A) or CUMS (B). (C and D) Left: Schematic of the bilateral viral transduction in VIP-Cre mice. Veh, vehicle. Right: Summary data of animal behaviors in OFT, SPT, TST, and FST. n = 8 mice per group. (E and F) Left: Schematic of the bilateral viral transduction in SST-Cre mice. Right: Summary data of animal behaviors in OFT, SPT, TST, and FST. n = 8 mice per group. Data are presented as means ± SEM. *P < 0.05, **P < 0.01, ***P < 0.001, and ****P < 0.0001; one-way ANOVA with Tukey’s post hoc test.
Fig. 5.
Fig. 5.. In the TST and OFT, chemogenetic manipulation of VIP neurons affects glutamate signaling.
(A) Left and middle: Viral injections schematic. Right: Climbing behavior schematic in OFT. (B and C) Schematics of TST or OFT timeline. (D and F) Heatmaps of ΔF/F illustrate glutamate release in the mPFC following chemogenetic inhibition (D) and activation (F) of VIP neurons during the struggling events in TST. Time 0 represents the time at which the struggling events occurred. n = 10 trials from four mice per group. (E and G) Top: Peri-event plots of ΔF/F glutamate levels change from mPFC neurons after chemogenetic inhibition (E) and activation (G) of mPFC VIP neurons during the struggling events in TST. The solid line and the shaded regions are the means ± SEM. Bottom: Compare the peak amplitude of the glutamate levels when the struggling events occurred in VIP-Cre mice. n = 10 trials from four mice per group. (H and J) Heatmaps of ΔF/F illustrate glutamate release in the mPFC following chemogenetic inhibition (H) and activation (J) of VIP neurons during the climbing events in OFT. Time 0 represents the time at which the climbing events occurred. n = 10 trials from four mice per group. (I and K) Top: Peri-event plots of ΔF/F glutamate levels change from mPFC neurons after chemogenetic inhibition (I) and chemogenetic activation (K) of mPFC VIP neurons during the climbing events in OFT. The solid line and the shaded regions are the means ± SEM. Bottom: Compare the peak amplitude of the glutamate levels when the climbing events occurred in VIP-Cre mice. n = 10 trials from four mice per group. Data are presented as means ± SEM. *P < 0.05, **P < 0.01, and ****P < 0.0001; unpaired t test.
Fig. 6.
Fig. 6.. VIP neurons modulate VPAC2 receptors located on pyramidal neurons, the major targets of REM SD for alleviating depression.
(A) Left: Representative Western blots images. Right: Quantification of the VPAC1 and VPAC2 levels expressed as a ratio of CON group. n = 4 mice per group. (B) Left: Schematic of the bilateral viral transduction in C57 mice. Right: Representative images of the knockdown of VPAC2 in pyramidal neurons. Scale bars, 50 μm. (C and D) Left: Representative Western blots images. Right: Quantification of the p-GluA1, p-GluA2, VPAC2, AC, and PKA levels expressed as a ratio of CON group. n = 5 mice per group (p-GluA1). n = 6 mice per group (VPAC2, p-GluA2, AC, and PKA). (E and F) Summary data of animal behaviors in OFT, SPT, TST, and FST. n = 8 mice per group. (G and H) Top: Representative secondary dendritic spines from mPFC in each group of mice. Scale bars, 2 μm. Bottom: Quantification of total dendritic spine density and the ratio of spine type in the mPFC dendritic spine: mushroom, stubby, and thin. n = 10 dendrites from four mice per group. Data are presented as means ± SEM. *P < 0.05, **P < 0.01, ***P < 0.001, and ****P < 0.0001; unpaired t test. KD, knockdown.

Similar articles

References

    1. Karageorgiou V., Casanova F., O’Loughlin J., Green H., McKinley T. J., Bowden J., Tyrrell J., Body mass index and inflammation in depression and treatment-resistant depression: A Mendelian randomisation study. BMC Med. 21, 355 (2023). - PMC - PubMed
    1. Abdin E., Chong S. A., Vaingankar J. A., Shafie S., Verma S., Luo N., Tan K. B., James L., Heng D., Subramaniam M., Impact of mental disorders and chronic physical conditions on quality-adjusted life years in Singapore. Sci. Rep. 10, 2695 (2020). - PMC - PubMed
    1. Li X., Zhang H., Wu K., Fan B., Guo L., Liao Y., McIntyre R. S., Wang W., Liu Y., Shi J., Chen Y., Shen M., Wang H., Li L., Han X., Lu C., Impact of painful physical symptoms on first-episode major depressive disorder in adults with subthreshold depressive symptoms: A prospective cohort study. Gen. Hosp. Psychiatry 86, 1–9 (2024). - PubMed
    1. Duman R. S., Aghajanian G. K., Sanacora G., Krystal J. H., Synaptic plasticity and depression: New insights from stress and rapid-acting antidepressants. Nat. Med. 22, 238–249 (2016). - PMC - PubMed
    1. Van Loh B. M., Yaw A. M., Breuer J. A., Jackson B., Nguyen D., Jang K., Ramos F., Ho E. V., Cui L. J., Gillette D. L. M., Sempere L. F., Gorman M. R., Tonsfeldt K. J., Mellon P. L., Hoffmann H. M., The transcription factor VAX1 in VIP neurons of the suprachiasmatic nucleus impacts circadian rhythm generation, depressive-like behavior, and the reproductive axis in a sex-specific manner in mice. Front. Endocrinol. 14, 1269672 (2023). - PMC - PubMed

MeSH terms

Substances

LinkOut - more resources