. 2025 Oct:86:103854.
doi: 10.1016/j.redox.2025.103854. Epub 2025 Sep 4.

Cytoskeletal disruption-induced calcium dysregulation drives cell death in anti-IgLON5 disease

Affiliations

Cytoskeletal disruption-induced calcium dysregulation drives cell death in anti-IgLON5 disease

Lisanne Korn et al. Redox Biol. 2025 Oct.

Abstract

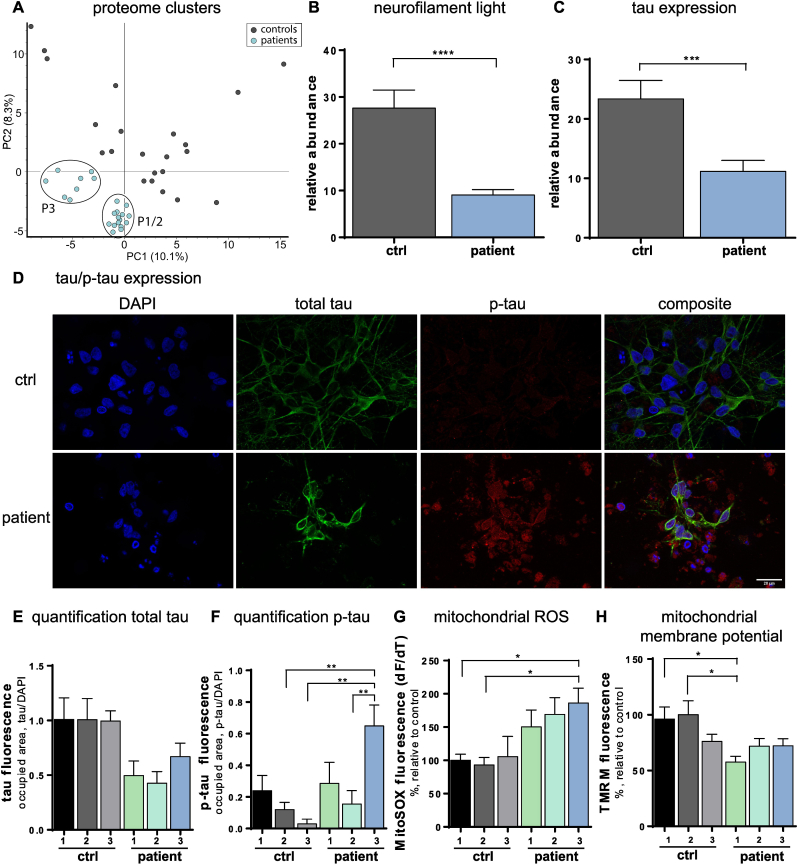
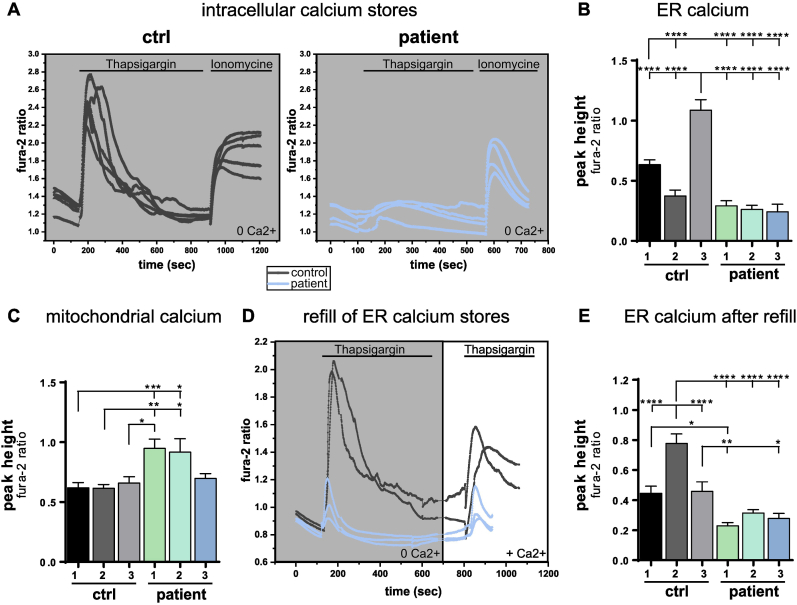
Anti-IgLON5 disease is an autoimmune encephalitis with more chronic presentation including memory decline, sleep disorder, bulbar symptoms and movement disorder. Post-mortem brains of patients with anti-IgLON5 disease show neurodegeneration with tau deposition sparking interest in this 'acquired tauopathy' as a disease model for neurodegeneration, yet mechanisms of neurodegeneration remain unknown. Using a reductionist human iPSC-derived neuron-antibody model, we applied proteomics approach, electrophysiology and live cell imaging. iNeurons treated with anti-IgLON5 IgG presented with cytoskeletal disruption along with tau depositions, which correlated with endophenotypes. Accompanying calcium dysregulation was driven by impaired ER refill and mitochondrial dysfunction leading to cell death. Analogous cytoskeletal disruption is also reflected in the serum of treatment naïve patients using OLink proteomics. These findings provide insight into anti-IgLON5 disease pathology and pinpoint downstream signalling events of direct antibody-neuron interactions, which involve novel targets such as cytoskeletal disruption along with calcium dysregulation.

Keywords: AIE; Calcium dysregulation; Cytoskeletal disruption; Disease phenotype; IgLON5.


Conflict of interest statement

Declaration of competing interest Nothing to report.

Figures

Image 1
Graphical abstract
Fig. 1
Fig. 1
Antibody-induced neurodegeneration after 7 days of IgG incubation. (A) From day (D) 0 to D10, the forward programming protocol for generating cortical neurons from NPCs is applied and phase contrast images of NPCs (D0) and cortical neurons (D10 after induction) are shown. After 3 weeks of neuron maturation, IgG fraction is isolated from serum/plasma from IgLON5 patients and controls and incubated with the healthy induced neurons (iNeurons) for 7 days. At 28 days after inducing differentiation, experiments were performed. (B) Immunocytochemical staining of human IgG binding to the plasma membrane of iPSC-derived neurons incubated with IgLON5 anti-IgLON5 IgG. (C) MEA analysis measuring network activity after incubating iNeurons with IgG fractions of controls versus IgLON5 patients. (D) Exemplary traces of spontaneous activity of iNeurons either treated with control IgG or anti-IgLON5 IgG recorded via patch clamp. (E) Representative traces of calcium imaging with fura-2 of control and anti-IgLON5 IgG treated neurons after physiological glutamate stimulation (5 μM). (F) Peak amplitude of glutamate evoked calcium signal in anti-IgLON5 IgG compared to control IgG treated neurons. (G) Cell death assay with Hoechst (all cells) and propidium iodide (PI, dead cells) on neurons incubated with IgG fraction. Cell death was calculated by PI+/Hoechst + cells in percent.
Fig. 2
Fig. 2
Mitochondrial dysfunction and cytoskeletal disruption in anti-IgLON5 IgG treated iNeurons. (A) Principal component analysis (PCA) shows significantly regulated proteins clustering together from anti-IgLON5 IgG treated iNeurons. (B, C) Quantification of proteome analysis shows the relative abundance of neurofilament light chain (B) and tau (C) in iNeurons incubated with either anti-IgLON5 IgG or control IgG. (D) Immunocytochemical staining of total tau (green), p-tau (red) and DAPI (blue). (E, F) Quantification of immunocytochemical stainings of total tau (E) and p-tau (F) measured as the occupied area normalised to DAPI. (G) Rate of mitochondrial ROS production measured with MitoSOX. (H) Mitochondrial membrane potential evaluated with tetramethylrhodamine (TMRM) fluorescence intensity.
Fig. 3
Fig. 3
ER calcium mishandling in anti-IgLON5 IgG treated iNeurons. (A) Representative traces of intracellular calcium released from ER (thapsigargin) and mainly mitochondria (ionomycine) measured with fura-2 in a calcium-free environment. (B–C) Quantification of peak amplitude of ER calcium (released by thapsigargin) (B) and mitochondrial calcium (released by ionomycin) (C). (D) Representative traces of intracellular calcium released from ER (thapsigargin) in a calcium-free environment followed by adding extracellular calcium and finally releasing the refilled ER calcium again with thapsigargin. (E) Quantification of refilled ER calcium peak amplitude.
Fig. 4
Fig. 4
OLink proteomics in blood of IgLON5 patients compared to healthy controls. (A) Serum protein level analysis. Serum samples from 8 IgLON5 and 12 age-matched healthy individuals (HD) were investigated by OLink using proximity extension assay with next-generation sequencing (PEA-NGS). Proteins related to the GO-terms GO0015630 microtubule cytoskeleton and GO0046907 intracellular transport were selected and investigated by sparse partial least squares discriminant analysis (sPLS-DA) for their potential to separate both groups. The 10 best separating parameters for the first two axes were selected and their contribution was plotted. (B) The proteins most consistently separating both groups, IgLON5 patients and healthy donors (HD), were combined in a composite score. Therefore, normalised protein expression (NPX) levels were linearised and proteins increased in IgLON5 patients (CHMP1A) were divided by decreased ones (EZR, ITGB1BP1, PDCD5). Receiver operating characteristic (ROC) analysis identified a cut-off of 1.1 separating IgLON5 patients from HD with an AUC of 100 % (specificity 100 %, sensitivity 100 %). Statistical analysis was performed by Mann-Whitney test, ∗∗∗∗p < 0.0001.

References

    1. Ryding M., Mikkelsen A.W., Nissen M.S., Nilsson A.C., Blaabjerg M. Pathophysiological effects of autoantibodies in autoimmune encephalitides. Cells. 2023;13(1) doi: 10.3390/cells13010015. - DOI - PMC - PubMed
    1. Vanaveski T., Singh K., Narvik J., Eskla K.-L., Visnapuu T., Heinla I., Jayaram M., Innos J., Lilleväli K., Philips M.-A., Vasar E. Promoter-specific expression and genomic structure of IgLON family genes in mouse. Front. Neurosci. 2017;11:38. doi: 10.3389/fnins.2017.00038. - DOI - PMC - PubMed
    1. Ranaivoson F.M., Turk L.S., Ozgul S., Kakehi S., Daake S. von, Lopez N., Trobiani L., Jaco A. de, Denissova N., Demeler B., Özkan E., Montelione G.T., Comoletti D. A proteomic screen of neuronal cell-surface molecules reveals IgLONs as structurally conserved interaction modules at the synapse. Structure (London, England : 1993) 2019;27(6):893–906.e9. doi: 10.1016/j.str.2019.03.004. - DOI - PMC - PubMed
    1. Trewin B.P., Freeman I., Ramanathan S., Irani S.R. Immunotherapy in autoimmune encephalitis. Curr. Opin. Neurol. 2022;35(3):399–414. doi: 10.1097/WCO.0000000000001048. - DOI - PubMed
    1. Sabater L., Planagumà J., Dalmau J., Graus F. Cellular investigations with human antibodies associated with the anti-IgLON5 syndrome. J. Neuroinflammation. 2016;13(1):226. doi: 10.1186/s12974-016-0689-1. - DOI - PMC - PubMed

LinkOut - more resources