. 2025 Sep 10;16(1):8215.
doi: 10.1038/s41467-025-62710-0.

Modulating the PPARγ pathway upregulates NECTIN4 and enhances chimeric antigen receptor (CAR) T cell therapy in bladder cancer

Affiliations

Modulating the PPARγ pathway upregulates NECTIN4 and enhances chimeric antigen receptor (CAR) T cell therapy in bladder cancer

Kevin Chang et al. Nat Commun. .

Abstract

With the approval of the antibody-drug conjugate enfortumab vedotin (EV), NECTIN4 has emerged as a bona fide therapeutic target in urothelial carcinoma (UC). Here, we report the development of a NECTIN4-directed chimeric antigen receptor (CAR) T cell, which exhibits reactivity across cells expressing a range of endogenous NECTIN4, with enhanced activity in high expressors. We demonstrate that the PPARγ pathway, critical for luminal differentiation, transcriptionally controls NECTIN4, and that the PPARγ agonist rosiglitazone primes and augments NECTIN4 expression, thereby increasing sensitivity to NECTIN4-CAR T cell-mediated killing. NECTIN4-CAR T cells have potent anti-tumor activity even against EV resistant cells, which largely retain NECTIN4 expression, including in a post-EV biopsy cohort. Our results elucidate a therapeutically actionable mechanism that UC cells use to control NECTIN4 expression and suggest therapeutic approaches that leverage PPARγ agonists for rational combinations with NECTIN4-targeting agents in UC, as well as future potential treatment options for EV-refractory patients.


Conflict of interest statement

Competing interests: D. Solit has consulted/received honoraria from Rain Pharmaceuticals, Pfizer, Fog Pharma, PaigeAI, BridgeBio, Scorpion Therapeutics, FORE Therapeutics, Function Oncology, Pyramid, Elsie Biotechnologies, Inc, and Meliora Therapeutics, Inc, all of which are outside the submitted work. H. Al Ahmadie has consulted for AstraZeneca and Paige.AI, all of which are outside the submitted work. J. Rosenberg served in a consulting or advisory role for Aktis, Astellas, AstraZeneca, Bayer, Boehringer Ingelheim, Bristol-Myers Squibb, Century Therapeutics, EMD Serono, Gilead, Century Therapeutics, Lilly Oncology, Pfizer, Roche/Genentech, Merck, Samsung Bioepis, Tyra Bioscience, and Seattle Genetics; has received research support from Astellas, AstraZeneca, Seattle Genetics, Genentech/Roche, Acrivon, and Lilly Oncology, all of which are outside the submitted work. C.K. Ding has consulted for Intuitive and reports research funding from Bristrol Myers Squibb, all of which are outside the submitted work. S.P. Porten reports research funding from Photocure and Kdx, honoraria from Fergene and CG Oncology, and serves on the steering committee or advisory board for Janssen and Vesica Health, all of which are outside the submitted work, all of which are outside the submitted work. T.W. Friedlander reports research funding from Seagen/Pfizer and Roche/Genetech, and has served in a consulting role for Astellas, Merck, Seagen/Pfizer, Gilead, Bicycle Therapeutics, Atkis Oncology, Bristol Meyers Squibb, and Abbvie, all of which are outside the submitted work. V.S. Koshkin has served in a consulting or advisory role for Astellas, Bicycle Therapeutics, Janssen, EMD Serono, Loxo Oncology, MSD, Seagen/Pfizer; has received institutional research funding from Endocyte/Novartis, Curium, Nektar, Gilead, Taiho, Merck and Seagen/Pfizer; and individual research funding from Eli Lilly, all of which are outside the submitted work. F.Y. Feng reported personal fees from Bluestar Genomics, Astellas, Foundation Medicine, Exact Sciences, Tempus, POINT Biopharma, Janssen, Bayer, Myovant, Roivant, SerImmune, Bristol Meyers Squibb, Novartis, and personal fees from POINT Biopharma and other support from Artera, prior to his death, all of which are outside the submitted work. J.K. Lee holds equity in, is on the scientific advisory board of, and receives research funding from PromiCell Therapeutics, outside the submitted work. He is an inventor on International Patent Application No. PCT/US2023/074229 related to NECTIN4 chimeric antigen receptor T cell therapy. A.P. Wiita reports being an equity holder in Indapta Therapeutics and speaker honoraria from Sanofi and AstraZeneca, all of which are outside the submitted work. J. Chou reports consulting fees from Exai Bio and Bicycle Therapeutics outside the submitted work. K. Chang and J. Chou have filed a provisional patent through the University of California Office of Technology and Management based on this work. All other authors report no disclosures.

Figures
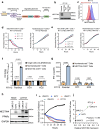
Fig. 1
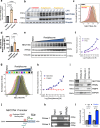
Fig. 1. Development of second-generation CD28 chimeric antigen receptors (CARs) targeting NECTIN4 for CAR T cell therapy.
a Schematic of the lentiviral NECTIN4-CAR construct: signal peptide, Myc tag, scFv targeting NECTIN4, CAR T backbone construct containing an IgG4Fc(EQ) spacer, the CD28 transmembrane domain and the CD28 costimulatory domain with CD3ζ intracellular signaling domain, T2A self-cleavage peptide, GFP transduction marker. scFv single-chain variable fragment, VL variable light chain, VH variable heavy chain, tm transmembrane, GFP green fluorescent protein. Created with BioRender. Chang, K. (2025) https://BioRender.com/k3j6fgi. b Western blot analysis of NECTIN4 expression in whole cell lysates of RT112 parental cells and NECTIN4 knockout (KO) cells. This was repeated n = 3 independent times with similar results. c NECTIN4 surface staining in RT112 parental cells and NECTIN4 knockout (KO) cells. d, e Growth curves of (d) RT112 and (e) NECTIN4 KO target cells with fluorescently labeled nuclei (NucLightRed, NLR) co-cultured with NECTIN4-CAR T cells (left) or non-transduced (NTD) T cells (right) at indicated effector-to-target (E:T) cell ratios. f A kill index [1/area under the curve (AUC)] was calculated as a time-dependent measure of killing efficacy against the indicated tumor target cells at an E:T ratio of 1:2. n = 3 biological replicates. g IFNγ quantification by ELISA from co-cultures of NECTIN4-CAR or NTD T cells with the indicated RT112 cell lines in (b) at a 1:2 ratio at 24 h. n = 3 biological replicates. h Western blots demonstrating NECTIN4 protein expression across luminal and basal human urothelial carcinoma cell lines. This was repeated n = 3 independent times with similar results. i Growth curves of indicated cell lines co-cultured with NECTIN4-CAR T cells at an E:T ratio of 1:1. A representative experiment of n = 3 biologically independent experiments performed in technical triplicates is shown, and error bars represent mean ± SEM. j Scatter plot showing the NECTIN4-CAR T kill index against target cell lines in (h) versus respective expression of NECTIN4. Pearson’s correlation is shown for NECTIN4 expression versus kill index (r = 0.96, P = 0.0097, two-tailed). For panels (d-g) n  =  3 biological replicates per conditions were used and data are presented as mean ± SEM. For panels (b,h), GAPDH was used as a protein loading control. For panels (f) and (g), two-way ANOVA with Sidak’s multiple comparison test was used. Source data are provided as a Source Data file.
Fig. 2
Fig. 2. PPARγ-mediated modulation of NECTIN4 expression.
a NECTIN4 mRNA levels in RT112 cells treated with 1μM rosiglitazone and T0070907 (T007) for 72 h. Data are presented as mean ± SEM, n = 6 for DMSO and rosiglitazone, n = 4 for T0070907, all biological replicates. b Western blot for NECTIN4 and HPGD in RT112 cells treated with T0070907, rosiglitazone, and pioglitazone at indicated concentrations for 72 h. This was repeated n = 3 independent times with similar results. c, d NECTIN4 surface staining (c) and quantification of median fluorescence intensify (MFI) (d) in RT112 cells treated with 1μM rosiglitazone and T0070907 for 72 h. Data are presented as mean ± SEM, n = 4 for DMSO and T0070907, n = 5 for rosiglitazone, all biological replicates. e Western blot for NECTIN4 and HPGD in RT112 cells treated with rosiglitazone for 72 h across a dose series (starting at 1 μM on the right most lane with serial 2-fold dilutions to the left). This was repeated n = 3 independent times with similar results. f Dose response curves of total NECTIN4 and HPGD protein expression after 72 h rosiglitazone treatment in RT112 cells. Data are presented as mean values. g NECTIN4 surface staining in RT112 cells treated with rosiglitazone for 72 h across a dose series. Dose series starts at 1μM with serial 2-fold dilutions. h Dose response curves of surface NECTIN4 and TROP2 expression for rosiglitazone in RT112 cells after 72 h. Data are presented as mean ± SEM, n = 2 biological replicates. i Western blots for NECTIN4, PPARγ and FABP4 in RT112 cells expressing sgRNAs against GAL4 (control), NECTIN4, and two unique PPARG guides. This was repeated n = 3 independent times with similar results. j Schematic of select predicted PPARG binding sites (labeled 1 and 2) on the NECTIN4 promoter region (500 to −2k) by FIMO using transcription binding motif matrices JASPAR 2018. Created with BioRender. Chang (2025) https://BioRender.com/k3j6fgi. k Chromatin from RT112 cells was precipitated using antibodies against PPARG or IgG. Primers targeting putative PPARG binding motifs 1 and 2 from (j) were used for PCR and the PCR product was visualized by gel electrophoresis. l Quantitative analysis of ChIP-qPCR experiments. Results are represented as fold-enrichment relative to IgG control. Data are presented as mean ± SEM, n = 3 biological replicates. For panels (a) and (d), ordinary one-way ANOVA with Sidak’s multiple comparison was used. For panel (l), two-sided, unpaired Student’s t test was used for each primer set. Vinculin shown as a loading control for panels (b) and (e) and GAPDH for panel (i). Source data are provided as a Source Data file.
Fig. 3
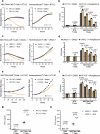
Fig. 3. Rosiglitazone pretreatment enhances sensitivity to NECTIN4-CAR T cells in multiple UC cell lines.
Representative growth curves of (a) RT112, (c) UMUC-1, and (e) HT1197 cells pretreated for 72 h with DMSO vehicle (black) or 1uM rosiglitazone (gold) and co-cultured with (left) NECTIN4-CAR T cells or (right) NTD T cells at indicated E:T cell ratios. Kill indices for NECTIN4-CAR and NTD T cells against (b) RT112, (d) UMUC-1, and (f) HT1197 cells pretreated for 72 h with DMSO vehicle (black) or 1uM rosiglitazone (gold) across various E:T ratios are shown. For panels a-f, data are presented as mean ± SEM, n = 3 biological replicates for all groups in (b, d, f). For panels (b, d, f), two-way ANOVA with Sidak’s multiple comparison was used. g,h FN-γ quantification by ELISA from co-cultures of NECTIN4-CAR or NTD T cells with RT112 (g) or UMUC-1 (h) cells pretreated for 72 h with DMSO control (black) or 1 μM rosiglitazone (gold) at an E:T ratio of 1:1 at 24 h. Data are presented as mean ± SEM, n= 3 biological replicates per condition. For panels (g, h), two-way ANOVA with Sidak’s multiple comparison was used, and data are presented as mean ± SEM, n = 4 biological replicates for all groups. Source data are provided as a Source Data file. Created with BioRender. Chang (2025) https://BioRender.com/k3j6fgi.
Fig. 4
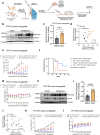
Fig. 4. Systemic rosiglitazone treatment primes tumor NECTIN4 expression and enhances anti-tumor activity of NECTIN4-CAR T cell therapy in vivo.
a Schematic of in vivo studies investigating the combination of rosiglitazone plus NECTIN4-CAR T cell therapy. Created with BioRender. Chang (2025) https://BioRender.com/k3j6fgi. Briefly, xenograft models were established by subcutaneous injection of indicated UC cells into NOD/scid/gamma (NSG) mice. When tumors reached approximately 50–100mm3, mice were randomized to receive daily rosiglitazone (20 mg/kg) or vehicle for 5 days, followed by a single injection of 2.5–5 × 10⁶ NECTIN4-CAR or NTD T cells via IV injection. Some tumors were collected immediately following rosiglitazone or vehicle administration for analysis. b, c Representative western blot (b) and quantification (c) for NECTIN4 and HPGD in RT112 tumor xenografts from mice treated with either rosiglitazone (gold) or vehicle (black) for 5 days. Data are presented as mean ± SEM, n = 7 vehicle and n = 10 rosiglitazone, all biological replicates. Vinculin shown as a loading control. This was repeated n = 3 independent times with similar results. d Scatterplot showing NECTIN4 versus HPGD expression from western blot analysis of tumors in (b). Pearson’s correlation is shown for NECTIN4 expression versus HPGD expression (r = 0.58, P = 0.01, two-tailed). Data from n = 2 independent cohorts of n = 4–5 mice each. e–f Tumor growth (e) and Kaplan–Meier survival curves (f) of RT112 subcutaneous xenografts. Mice were treated for 5 days with either vehicle or rosiglitazone followed by an IV injection of NECTIN4-CAR or NTD T cells. n = 5 mice in each NTD T cell group and n = 7 mice in each NECTIN4-CAR T cell group. For panel (e), ** indicates p = 0.0058 at day 21, *** indicates p =  0.002, p = 0.008, p = 0.001 at days 25, 28, 31, respectively, and **** indicates p < 0.0001 at day 34, for Vehicle + NECTIN4-CAR T (red) vs Rosi + NECTIN4-CAR T (blue). Error bars represent SEM. ns not significant, NTD non-transduced. For panel (f), the log-rank test was used. g Body weights of each group of mice in (e) over time. Data are presented as mean ± SEM. h, i Representative western blot for NECTIN4 and HPGD in HT1197 tumor xenografts from mice treated with either rosiglitazone or vehicle for 5 days. Quantification of NECTIN4 is shown in (i). Data are presented as mean ± SEM, n = 9 biological replicates in each group. (j) Scatterplot showing NECTIN4 versus HPGD expression from western blot analysis. Pearson’s correlation is shown for NECTIN4 expression versus HPGD expression (r = 0.50, P = 0.04, two-tailed). Data from n = 2 biologically independent cohorts of n = 4–5 mice each. k, l Tumor growth curves (k) and body weights of each group (l) of HT1197 tumor xenografts treated with vehicle or rosiglitazone followed by single IV injection of NECTIN4-CAR T cells or NTD T cells. The number of mice in each group is shown in parentheses: n = 5 mice (Vehicle+NTD), n = 7 mice (Rosi+NTD), n = 9 mice (Vehicle+NECTIN4-CAR T and Rosi+NECTIN4-CAR T). *** indicates p =  0.004 at day 82 for Vehicle + NTD vs Rosi + NTD and ** indicates p =  0.0068 at day 82 and * indicates p = 0.0167 at day 75 for Vehicle+NECTIN4-CAR T (red) vs Rosi+NECTIN4-CAR T (blue). Data are presented as mean ± SEM. For panels (c,i), two-sided, unpaired Student’s t test was used. For panels (e, g, k, l), mixed effects model with Sidak’s multiple comparison test was used. Source data are provided as a Source Data file.
Fig. 5
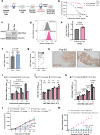
Fig. 5. NECTIN4-CAR T cell therapy demonstrates efficacy in vitro and in vivo against a preclinical model of enfortumab vedotin (EV) resistance.
a Schematic of parental RT112 cells undergoing cycles of treatment with enfortumab vedotin (EV) at escalating doses to 25 μg/ml, yielding EV resistant cells (“RT112-EV Res.”). Created with BioRender. Chang (2025) https://BioRender.com/k3j6fgi. b EV dose-response curves for RT112-Parental and RT112-EV Res. following 9 days of treatment with EV, showing EV IC50 for RT112-parental (2.4 μg/ml) and RT112-EV Res. (25.1 μg/ml). c Western blot for NECTIN4 in RT112-parental and RT112-EV Res. cell lysates. Vinculin shown as a loading control. This was repeated n = 3 independent times with similar results. d, e Representative flow cytometry (d) and quantification of surface NECTIN4 MFI (e) in RT112-parental and RT112-EV Res. cells. Data are presented as mean MFI ± SEM, n = 4 biological replicates, and two-sided, unpaired Student’s t test was used. f, g H-scores for surface NECTIN4 IHC on matched samples taken from a cohort of n = 17 UC patients who underwent pre-EV and post-EV biopsies. Data are presented as mean ± SEM in (f), and a two-sided, paired Student’s t test was used. h Example of NECTIN4 stain on a paired biopsy taken pre-EV (H-score=160) and post-EV (H-score=300). Scale bar denotes 1 mm. Kill indices of (i) EV, (j) NECTIN4-CAR-1 T cells and (k) enfortumab-derived NECTIN4-CAR-2 T cells against RT112-parental (black) and RT112-EV Res. (pink) cells. Error bars represent SEM, n = 3 biological replicates for each group. (l) Tumor growth curves of RT112-parental and RT112-EVRes. tumor xenografts treated with a single dose of EV (4 mg/kg) or vehicle. RT112-parental (n = 10 mice vehicle, black), RT112-EV Res. (n = 10 mice vehicle, pink), RT112-parental + EV (n = 4 mice, purple), RT112-EV Res. + EV (n = 5 mice, teal). Data are presented as mean ± SEM. p values comparig RT112-parental vehicle (black) vs EV (purple) are shown for indicated time points. m Tumor growth curves of RT112-EVRes. tumor xenografts in NSG mice treated with a single dose of 5 × 10⁶ NECTIN4-CAR or NTD T cells. n = 5 mice (NTD T cells, pink), n = 3 mice (NECTIN4-CAR T cells, teal). Data are presented as mean ± SEM. p values at days 24, 27 and 31 are shown. For panel (b), a nonlinear regression model was used to compare the dose-response curves by the extra sum-of-squares F test. For panel (g), a paired, two-tailed Student’s t test was used. For panels (i–k), two-way ANOVA with Sidak’s multiple comparison test was used. For panels (l, m), a mixed effects model with Sidak’s multiple comparison test was used. Source data are provided as a Source Data file.

References

    1. Siegel, R. L., Giaquinto, A. N. & Jemal, A. Cancer statistics, 2024. CA: A Cancer J. Clin.74, 12–49 (2024).
    1. Chu, C. E. et al. Heterogeneity in NECTIN4 expression across molecular subtypes of urothelial cancer mediates sensitivity to enfortumab vedotin. Clin. Cancer Res.27, 5123–5130 (2021). - PMC - PubMed
    1. Koshkin, V. S. et al. Efficacy of enfortumab vedotin in advanced urothelial cancer: Analysis from the Urothelial Cancer Network to Investigate Therapeutic Experiences (UNITE) study. Cancer128, 1194–1205 (2022). - PubMed
    1. Rosenberg, J. E. et al. Pivotal trial of enfortumab vedotin in urothelial carcinoma after platinum and anti-programmed death 1/programmed death ligand 1 therapy. J. Clin. Oncol.37, 2592–2600 (2019). - PMC - PubMed
    1. Yu, E. Y. et al. Enfortumab vedotin after PD-1 or PD-L1 inhibitors in cisplatin-ineligible patients with advanced urothelial carcinoma (EV-201): a multicentre, single-arm, phase 2 trial. Lancet Oncol.22, 872–882 (2021). - PubMed

MeSH terms

LinkOut - more resources