. 2025 Sep 11;10(1):296.
doi: 10.1038/s41392-025-02380-y.

Loss-of-function variations in solute carrier family 38 member 6 are associated with essential tremor

Affiliations

Loss-of-function variations in solute carrier family 38 member 6 are associated with essential tremor

Zhangqi Yuan et al. Signal Transduct Target Ther. .

Abstract

Essential tremor (ET) is a common neurological disease that is characterized by 4-12 Hz kinetic tremors of the upper limbs and high genetic heterogeneity. Although numerous candidate genes and loci have been reported, the etiology of ET remains unclear. A novel ET-related gene was initially identified in a five-generation family via whole-exome sequencing, and other variants were identified in 772 familial ET probands and 640 sporadic individuals via whole-genome sequencing. Among 71 (9.18%) Chinese families and 47 (7.34%) sporadic individuals with ET, we identified 15 types of protein-altering variants in solute carrier family 38 member 6 (SLC38A6), which encodes sodium-coupled neutral amino acid transporter 6 (SNAT6) and is inherited in an autosomal dominant pattern. Over-expression of mutant SNAT6 for the three most common human mutations (p.Y108F, p.M281T and p.G318S) significantly impaired L-arginine (L-Arg) uptake in HeLa cells. The homozygous Slc38a6 deletion mice (Slc38a6-/-) exhibited reduced L-Arg uptake in their cerebellar neurons, tremor, and cerebellar pathology. Slice electrophysiology revealed reduced neuronal Purkinje cell (PC) excitability and elevated inhibitory synaptic transmission in Slc38a6-/- mice, in line with elevated "hairy" basket coverage around the PC soma. Furthermore, heterozygous Slc38a6 deletion (Slc38a6+/-) and PC-specific Slc38a6 deletion (Slc38a6PC-/-) mice also displayed tremor and PC abnormalities similar to those found in Slc38a6-/- mice. These PCs displayed mitochondrial abnormalities and elevated ferroptosis markers (ACSL4, TFRC and Fe ions). In conclusion, we identified variants in SLC38A6 that contribute ~8.35% to ET, generated mouse models displaying tremor, and delineated cerebellar cellular abnormalities and potential mechanisms underlying ET etiology.


Conflict of interest statement

Competing interests: The authors declare no competing interests.

Figures
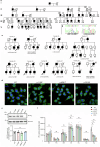
Fig. 1
Fig. 1
Identification of the SLC38A6 gene in ET family 1 and the localization, expression level and amino acid transport function of SNAT6. a Pedigree of family 1 and the genotypes of the family members. Squares and circles represent males and females, respectively. The filled and blank symbols indicate affected subjects with ET and asymptomatic subjects, respectively. The arrow denotes the proband of family 1. The symbol with a question mark (?) represents an undefined individual, and the arrow indicates the proband. Asterisks (*) indicate the affected individuals chosen for whole-exome sequencing. The genotyping results of the two variants in the SLC38A6 gene are shown for all the available family members. The variants c.842 T > C/p. M281T, and c.952 G > A/p. G318S are denoted with ‘C’ and ‘A’, respectively. ‘+’ indicates the reference allele. IV:2 and IV:14 carry heterozygous variants (c.842 T > C/p.M281T; c.952 G > A/p.G318S) in the SLC38A6 gene but exhibit no clinical manifestations, suggesting the possibility of incomplete penetrance. IV:12 does not carry the heterozygous variants in the SLC38A6 gene and presents only with postural tremors in both upper limbs. The TETRAS I score is 0, and the TETRAS II score is 4, suggesting a possible phenocopy. b Sanger sequencing results of the two variants of SLC38A6 identified in Family 1. Variant loci are indicated with arrows. c Cosegregation of the SLC38A6 genotype with the clinical phenotype in some families. d Representative immunofluorescence images of HeLa cells transfected with Flag-tagged SNAT6-WT and three variants (p.Y108F, p.M281T and p.G318S) and immunostained with anti-Flag (green: anti-Flag; blue: DAPI). e Quantification of the results of the Western blot analysis of Flag-tagged SNAT6-WT and three variants in HeLa cells. f Uptake of radiolabeled amino acids in HeLa cells overexpressing SNAT6-WT or three variants was measured in counts per minute (cpm) via scintillation counting. The data are presented as the means ± SEMs. Statistical tests: two-way ANOVA followed by Sidak’s multiple comparisons test (e), (f). Scale bar: 50 μm (d)
Fig. 2
Fig. 2
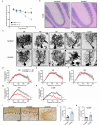
Soma, axonal and dendritic alterations of PCs in Slc38a6-/- mice. a Quantification of the PC linear density of Slc38a6+/+ and Slc38a6-/- mice at 2, 4, 6, 9, and 12.5 months (n = 6 mice per group). b Representative H&E-stained sagittal cerebellar sections of Slc38a6+/+ and Slc38a6-/- mice at 12.5 months. c Golgi-stained PC dendrites in 2-, 4-, 6-, 9-, and 12.5-month-old Slc38a6+/+ and Slc38a6-/- mice. dh Age-matched comparisons of dendrites of Slc38a6+/+ and Slc38a6-/- mice at 2 (d), 4 (e), 6 (f), 9 (g), and 12.5 (h) months were performed via Sholl analysis (n = 20 stained PCs from 4 mice for each group). i Representative PC axons stained with calbindin-D28K. Abnormal alterations of PC axons in Slc38a6-/- mice at 12.5 months. Left, normal PC axons in Slc38a6+/+ mice at 12.5 months; middle, two torpedoes (arrowheads) and branched axons (arrows); right, thickened axonal profiles (arrows). j Comparison of torpedoes between Slc38a6+/+ and Slc38a6-/- mice at 12.5 months (n = 5 mice per group). k Comparison of thickened axonal profiles between Slc38a6+/+ and Slc38a6-/- mice at 12.5 months (n = 5 mice per group). The data are presented as the means ± SEMs. Statistical tests: two-way ANOVA followed by Sidak’s multiple comparison tests (a), (d‒h) and the Mann‒Whitney test (j), (k). Scale bars: 50 μm (b); 20 μm (c); 50 μm (i)
Fig. 3
Fig. 3
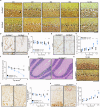
Cerebellar neuronal alterations in Slc38a6-/- mice and Slc38a6PC-/- mice. a Representative ‘hairy baskets’ of Bielschowsky silver-stained sections from Slc38a6+/+ and Slc38a6-/- mice at 2, 4, 6, 9, and 12.5 months. b Representative CF‒PC synapses in the molecular layer of 12.5-month-old Slc38a6+/+ and Slc38a6-/- mice labeled with vGluT2. The rectangular areas are shown below at a higher magnification. c Quantitative statistics of the CF synaptic density in Slc38a6+/+ and Slc38a6-/- mice at 2, 4, 6, 9, and 12.5 months (n = 6 mice per group). d Representative CF‒PC synapses in the outer 20% of the molecular layer labeled with vGluT2 in 12.5-month-old Slc38a6+/+ and Slc38a6-/- mice. The dotted line indicates the boundary of the outer 20% and inner 80% of the molecular layer. Red arrows indicate the CF-PC synapses extending into the PF territory. e Quantitative statistics of CF‒PC synapses in the outer 20% of the molecular layer in Slc38a6+/+ and Slc38a6-/- mice at 2, 4, 6, 9, and 12.5 months (n = 6 mice per group). f Quantification of the PC linear density of control and Slc38a6PC-/- mice at 2, 4, 6, 9 and 12.5 months (n = 4 mice per group). g Representative sagittal sections of control and Slc38a6PC-/- mice at 12.5 months were stained with H&E. h Representative ‘hairy baskets’ of Bielschowsky silver-stained sections of control and Slc38a6PC-/- mice at 12.5 months. i Representative image of abnormal CF‒PC synapses in the molecular layer from 12.5-month-old control and Slc38a6PC-/- mice labeled with vGluT2. j Quantification of CF synaptic density in control and Slc38a6PC-/- mice at 2, 4, 6, 9 and 12.5 months (n = 3 mice per group). k Quantitative statistics of CF‒PC synapses in the outer 20% of the molecular layer in control and Slc38a6PC-/- mice at 2, 4, 6, 9, and 12.5 months (n = 3 mice per group). The dotted line indicates the boundary of the outer 20% and inner 80% of the molecular layer. Red arrows indicate the CF-PC synapses extending into the PF territory. l Quantification of CF‒PC synapses in the outer 20% of the molecular layer in control and Slc38a6PC-/- mice at 2, 4, 6, 9 and 12.5 months (n = 3 mice per group). The data are presented as the means ± SEMs. Statistical tests: two-way ANOVA followed by Sidak’s multiple comparison tests (c), (e), (f), (j), (l). Scale bars: 20 μm (a), (b), (d), (i), (k); 200 μm (g); 100 μm (h)
Fig. 4
Fig. 4
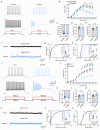
Abnormal functions of PCs in Slc38a6-/- mice and Slc38a6PC-/- mice. a Representative APs of Slc38a6+/+ and Slc38a6-/- PCs evoked by current steps of 200 pA and 600 pA. b Number of APs induced by the current steps in Slc38a6+/+ (n = 19, black) and Slc38a6-/- (n = 15, blue) PCs. c–e Summary of the threshold (c), amplitude (d) and half-width (e) of the APs in Slc38a6+/+ and Slc38a6-/- PCs. f Representative sIPSC traces in Slc38a6+/+ and Slc38a6-/- mice. NBQX is an AMPA receptor antagonist. D-APV is an NMDA receptor antagonist. g Cumulative distribution of interevent intervals and summary graphs of sIPSC frequency (inset) in Slc38a6+/+ (n = 17, black) and Slc38a6-/- (n = 16, blue) PCs. h Same as panel (g) but for sIPSC amplitude. i Representative APs of control and Slc38a6PC-/- PCs evoked by current steps of 200 pA and 600 pA. j Number of APs induced by the current steps in control (n = 17, black) and Slc38a6PC-/- (n = 20, blue) PCs. k‒m Summary of the threshold (k), amplitude (l) and half-width (m) of the APs in control and Slc38a6PC-/- PCs. n Representative sIPSC traces in control and Slc38a6PC-/- mice. NBQX is an AMPA receptor antagonist. D-APV is an NMDA receptor antagonist. o Cumulative distribution of interevent intervals and summary graphs of sIPSC frequency (inset) in control (n = 21, black) and Slc38a6PC-/- (n = 17, blue) PCs. p Same as panel (o) but for sIPSC amplitude. Note that sIPSC frequency was increased in Slc38a6PC-/- PCs and that there was no change in sIPSC amplitude. The data are presented as the means ± SEMs. Statistical tests: two-way ANOVA followed by Sidak’s multiple comparison tests (b), (j); two-tailed unpaired Student’s t test (ce), (km); Kolmogorov‒Smirnov test; Inner of (g), (h), (o), (p)
Fig. 5
Fig. 5
Proteomics and cerebellar ferroptosis analysis in 2-month-old Slc38a6+/+ and Slc38a6-/- mice. a Volcano plot showing up- and downregulated proteins in 2-month-old Slc38a6+/+ and Slc38a6-/- mice. Red indicates upregulated proteins, and green indicates downregulated proteins. b‒c KEGG enrichment (b) and GO enrichment (c) analyses of DEPs in Slc38a6+/+ and Slc38a6-/- mice. The size of the dot indicates the number of proteins for each term, and the color indicates -log10 Padj for the KEGG and GO analyses. MF, Molecular Function; CC, Cellular Component; BP, Biological Process. d Expression levels of ACSL4 were measured in Slc38a6+/+ and Slc38a6-/- cerebellums. e Representative images of TFRC immunostaining in Slc38a6+/+ and Slc38a6-/- mouse cerebellums. f Same as panel (d) but for TFRC. g Representative Perls’ Prussian blue staining of Slc38a6+/+ and Slc38a6-/- cerebellums. h Cellular iron levels in the Slc38a6+/+ and Slc38a6-/- cerebellums. i Expression levels of ATF3 were measured in Slc38a6+/+ and Slc38a6-/- cerebellums. The data are presented as the means ± SEMs. Statistical tests: two-tailed unpaired Student’s t test (d), (f), (h), (i). Scale bars: 50 μm (e), (g)
Fig. 6
Fig. 6
A working model for variants of SLC38A6 causing ET. Loss-of-function variants of SLC38A6 (encoding SNAT6) lead to arginine homeostasis alterations that result in ferroptosis, which in turn induces mitochondrial abnormalities and electrophysiological dysfunction in PCs. It affects the morphology of PCs, such as soma loss and heterotopia, thickened axons, recurrent axonal collaterals and torpedoes, reduced dendritic complexity, reduced CFPC synaptic density, and increased basket cell “hairy” axons as well as the function of PCs, leading to ET

References

    1. Clark, L. N. & Louis, E. D. Essential tremor. Handb. Clin. Neurol.147, 229–239 (2018). - PMC - PubMed
    1. Paulson, G. W. Benign essential tremor: features that aid in diagnosis. Postgrad. Med.71, 105–107 (1982). - PubMed
    1. Louis, E. D. & McCreary, M. How common is essential tremor? Update on the worldwide prevalence of essential tremor. Tremor. OtherHyperkinet. Mov. (N. Y.)11, 28 (2021). - PMC - PubMed
    1. Jiménez-Jiménez, F. J., Alonso-Navarro, H., García-Martín, E. & Agúndez, J. A. The relationship between Parkinson’s disease and essential tremor: review of clinical, epidemiologic, genetic, neuroimaging and neuropathological data, and data on the presence of cardinal signs of parkinsonism in essential tremor. Tremor. Other Hyperkinet. Mov. (N. Y.)2, tre-02-75–409-3 (2012). - PMC - PubMed
    1. Younger, E. et al. Mapping essential tremor to a common brain network using functional connectivity analysis. Neurology101, e1483–e1494 (2023). - PMC - PubMed

LinkOut - more resources