. 2025 Sep 10;16(1):8049.
doi: 10.1038/s41467-025-63251-2.

Dysregulated RNA splicing impairs regeneration in alcohol-associated liver disease

Affiliations

Dysregulated RNA splicing impairs regeneration in alcohol-associated liver disease

Ullas V Chembazhi et al. Nat Commun. .

Abstract

Individuals with progressive liver failure risk dying without liver transplantation. However, our understanding of why regenerative responses are disrupted in failing livers is limited. Here, we perform multiomic profiling of healthy and diseased human livers using bulk and single-nucleus RNA- and ATAC-seq. We report that in alcohol-associated liver disease, alterations in the hepatic immune milieu prevent hepatocytes from transitioning to proliferative progenitors. We also find differences in RNA binding protein expression, particularly of the ESRP, PTBP, and SR families, leading to misregulation of developmentally controlled RNA splicing. Our data pinpoint ESRP2 as a disease-sensitive splicing factor and support a causal role for its deficiency in the pathogenesis of severe alcoholic hepatitis. Notably, splicing defects in Tcf4 and Slk, two ESPR2 targets, alter their nuclear localization and activities, disrupting WNT and Hippo signaling pathways that are critical for normal liver regeneration. We further demonstrate that changes in stromal cell populations enrich failing livers with TGF-β, which suppresses the ESRP2-driven epithelial splicing program and replaces functional parenchyma with quasi-progenitor-like cells lacking liver-specific functions. Taken together, these findings indicate that misspliced RNAs are effective biomarkers for alcohol-associated liver disease, and targeting them could improve recovery in affected individuals.


Conflict of interest statement

Competing interests: The authors declare no competing interests.

Figures
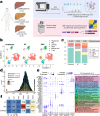
Fig. 1
Fig. 1. Multiomic profiling of human alcohol-associated liver diseases.
a Schematic summarizing single nuclear isolation from human liver samples and transcriptomics using multiomic and deep sequencing approaches. (Created in BioRender. Das, D. (2025) https://BioRender.com/mskjuhf). b rnaUMAP showing distinct cell populations identified from multiomic profiling at single-cell resolution from over 27,000 liver nuclei from 15 individuals (n = 5 each). c Distribution of various liver cells in unaffected and alcohol-associated liver disease (ALD) patients. AC and SAH showed an increased number of non-hepatocyte (NPC) cells. Non-directional Chi-squared test was performed cell numbers showed a p-value < 0.0001, indicating statistically significant change in cell populations depending on conditions. d Distribution of porto-central coordinate ηi values in unaffected liver, AC, and SAH conditions. The histogram shows the frequency of cells at different ηi values for each condition, followed by p-value from using two-sided Kolmogorov–Smirnov (K–S) test, which shows significant differences (p < 0.05) between unaffected and diseased distributions. e Cell type-specific changes in gene expression associated with ALD (examples shown in dot plot, left) and corresponding gene ontology analysis demonstrating affected processes (right). f Average Transcript per million (TPM) values of key pro-inflammatory cytokines as quantified from bulk RNA-seq. Correspoding Average TPM values are shown within each box of the heatmap. SAH severe alcohol-associated hepatitis, AC alcohol-associated cirrhosis.
Fig. 2
Fig. 2. Altered immune milieu in ALD promotes a quasi-progenitor state of hepatocytes.
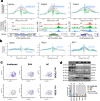
a (top) Genome-wide Tn5 insertion enrichment plots around motifs for critical transcription factors regulating mature hepatocyte states—HNF4α, CEBPα, and FOXA2—showing their decreased activity in SAH and AC patients. (bottom) Genome accessibility around their respective chromatin loci is shown below each plot. b Genome-wide Tn5 insertion enrichment plots around motifs for critical transcription factors regulating fetal-like hepatocyte states—SOX9, RELA, and E2F1—showing their unchanged activity in ALD patients. Chromatin accessibility from snATAC-seq was assessed through Seurat and Signac pipelines (see “Methods”). c Feature plots showing expression levels of FOXA2 and SOX9 TFs from snRNA-seq. d Western blot images (above) and corresponding quantitations (below) showing expression levels of TF proteins from human liver lysates (n = 3 liver samples per condition). In (d, BOTTOM), individual data points report biological replicates, and centers and error bars represent mean and Standard deviation, respectively. Blots in (d, TOP) are a representative image of 3 individual western blot trials. Two-way ANOVA statistical test used in (f). * 0.01< p < 0.1, ** 0.001< p < 0.01. SAH severe alcohol-associated hepatitis, AC alcohol-associated cirrhosis.
Fig. 3
Fig. 3. Altered expression levels of RNA binding proteins in SAH and AC induce unique alternative splicing changes.
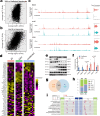
Scatter plot showing a correlation between gene expression and gene accessibility in a SAH vs unaffected hepatocytes and b Hepatocytes vs Kupffer cells, indicating that gene accessibility changes strikingly correlate with cell type-specific gene expression changes but not with pathogenic cell-state transitions. c Examples of concordance and discordance between gene accessibility and expression between SAH and unaffected hepatocytes. d Heatmap showing expression of top enriched RBPs across unaffected, SAH, and AC patients. e Western blot images and f corresponding quantification demonstrating protein expression levels of various developmentally regulated RBPs from human livers (n = 4 biological replicates). g Venn diagram showing the intersection of misregulated alternative splicing events in SAH and AC. h Distribution of alternative splicing events in SAH and AC patients. i Distribution of RNA binding motifs for developmentally regulated alternative splicing factors around AS events. In (f), individual data points report biological replicates, and centers and error bars represent mean and Standard deviation, respectively. Blots in (e) are a representative image of 3 individual western blot trials. Two-way ANOVA statistical test used in (f). In (i), Fisher’s exact test was used with correction for False discovery rate and a cutoff of q < 0.05. SAH severe alcohol-associated hepatitis, AC alcohol-associated cirrhosis.
Fig. 4
Fig. 4. Mis-regulation of alternative splicing causes functional defects in SAH liver proteome.
a Distribution of exons misregulated in SAH patients across gene body and their breakup into transcript regions. b Effect of misregulated exons on ORF of encoded transcript. c Pie chart showing the fraction of alternative spliced genes that encode proteins with known secreted isoforms. d Venn diagram showing the intersection of alternative spliced genes in SAH patients with known secreted and membrane-bound isoforms. e Heatmap showing numbers of predicted alternative splicing induced functional defects in protein products from SAH and AC patients. f RT-PCR based splice assays validating alternative splicing changes in SAH patients. RT-PCR assays for alternative exons were repeated atleast twice and representative results are presented. SAH severe alcohol-associated hepatitis, AC alcohol-associated cirrhosis.
Fig. 5
Fig. 5. Decreased inclusion of NLS-encoding exon disrupts nuclear localization and function of SLK and TCF4.
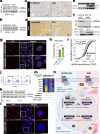
RT-PCR-based splicing assay demonstrating decreased inclusion of a 93 bp exon of SLK and b 73 bp exon of TCF4 in SAH patients, both of which encode NLS sequence. IHC images from human patient samples demonstrating nuclear localization of c SLK, and d TCF4 is disrupted in SAH patient hepatocytes, immunostaining results are representative from 4 biological replicates in each condition. e Western blot analysis from human liver lysates demonstrating increased phosphorylation of Polo-like kinase (PLK) in SAH patients (n = 4 biological replicates). f RT-PCR-based splicing assay (top) demonstrating exclusion of the 93 bp exon in SLK transcript upon ASO treatment and western blotting (bottom) showing increased phosphorylation of PLK1 in AML12 cells after ASO treatment. Presented data is representative of 3 independent trials, but individual lanes represent technical replicates from a given trial. g Immunofluorescence staining showing decreased nuclear localization of SLK protein in AML12 cells upon ASO-induced exclusion of 93 bp exon in SLK transcript. h quantitation from MTT assay showing increased proliferation in AML12 cells treated with ASO against 93 bp exon of SLK. Data points reflect technical replicates (n = 4) for each condition, centers and error bars represent mean and Standard deviation, respectively. Presented data is representative of 3 independent trials. Student t-test was used to assess significance. ***p < 0.001. i Cumulative plot showing decreased expression of TCF4 target genes in AH patients. Kolmogorov–Smirnov (K–S) test was used to assess statistical significance, with p-value presented in top left for each comparison. j Chromvar plots showing decreased TCF4 activity in SAH hepatocytes in our scATAC-seq dataset. k RT-PCR-based splicing assay showing increased exclusion of the 73 bp exon in Tcf4 transcript upon ASO treatment in AML12 cells. Differences in PSI values are shown as mean ± SD below image. l Immunofluorescence staining showing decreased nuclear localization of TCF4 protein in AML12 cells upon ASO-induced exclusion of 73 bp exon in TCF4 transcript. Presented images are representative of 3 independent trials. m Heatmap showing qRT-PCR-based expression levels of WNT downstream target genes in AML12 cells treated with control ASO, CHIR99021 and/or Tcf4_73-targeting ASO. n Schematic demonstrating how missplicing in TCF4 and SLK leads to altered WNT signaling and proliferation program in SAH patients. Note that the inclusion of the 73 bp exon of TCF4 changes the reading frame for the downstream exon. (Created in BioRender. Das, D. (2025) https://BioRender.com/q3o6yv5). All RT-PCR assays for alternative exons were repeated atleast twice and representative results are presented. Scale bar in images for (g) and (l) reflect 5 μm. ASO anti-sense oligonucleotide.
Fig. 6
Fig. 6. Loss of ESRP2 exacerbates SAH pathology by disrupting developmentally regulated alternative splicing programs.
The inclusion of the NLS-containing a 93 bp Slk exon and b 73 bp Tcf4 exon decreases significantly in ESRP2 KO mice. The green and blue tracks represent RNA-sequencing coverages from WT C57BL/6J and ESRP2 KO mouse hepatocytes on the UCSC genome browser, respectively. eCLIP tags for ESRP2 are shown in black in the panel above RNA-seq tracks to demonstrate ESRP2 binding to the upstream introns. c Schematic showing extended NIAAA diet schedule on mice (20D + 2B). Mice were fed ad libitum Lieber-DeCarli ethanol liquid diet for 20 days along with two oral gavages of ethanol (5 g kg−1)—one each at day 10 and day 20. d ALT levels and qRT-PCR-based quantitation of TNF-α, Esrp2, CD133, and Hnf4a genes. Data points reflect biological replicates, centers and error bars represent mean and Standard deviation, respectively. Student t-test, and 2-way ANOVA was used to assess significance for ALT and gene expression, respectively. *p < 0.05. e Histological characterization of WT and ESRP2 KO mice after 20D + 2B diet. (n = 5 biological replicate). f Gel-based RT-PCR assay showing ESRP2 depletion leads to SAH-like transitions in alternative splicing profiles in 20D + 2B mice liver (n = 3 biological replicate). Differences in PSI values are shown as mean ± SD below each image. Scale bar in images for (e) reflect 100 μm.
Fig. 7
Fig. 7. TGF-β signaling in SAH livers is a key determinant of hepatocyte identities.
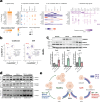
a NicheNet-based cell interaction analysis summarizing (from left to right) 1. Key ligands that regulate hepatocyte identities in SAH livers, 2. Expression levels of ligands in different NPC cell types (Ligand producing “senders”) in SAH livers, 3. Log fold changes (LFC) in their expression levels in SAH livers compared to unaffected livers, and 4.NicheNet-based prediction of a ligand’s potential to regulate key hepatocyte target genes. TGF-β1 and HGF ligands showed the highest correlation to the gene set defining hepatocyte maturity. b Feature plot illustrating increased expression levels of TGF-β1 specifically in the NPC populations from SAH patients. c Western blot and RT-qPCR analyses showing ESRP2 reduction upon TGF-β1 treatment (5 ng/mL in DMEM/F-12 complete media for 36 h) and restoration upon addition of TGF-βR I/II inhibitor LY2109761 (50 μM for 48 h). TGF-β1 treatment increases steady-state mRNA levels of EMT-transcription factors Snai1 and Cdh2, which return to baseline after inhibitor addition. Phospho-Smad3 expression confirms TGF-β pathway activation, and its subsequent reduction upon inhibitor treatment confirms inhibitor efficacy. Data points reflect technical replicates (n = 3) for each condition, centers and error bars represent mean and Standard deviation, respectively. Presented data is representative of 3 independent trials. Pairwise Welch t-test was used to assess significance. *p < 0.05, **p < 0.01, ****p < 0.0001. d RT-PCR analysis of ESRP2 splicing targets (Slk, Slain2, and Tcf4) demonstrates significant exon skipping (93, 78, and 73 bp, respectively) following TGF-β treatment. These levels return to baseline upon the addition of the TGF-β inhibitor. Exon lengths are shown beside the gene name, and the differences in PSI values are shown as mean ± standard deviation below each image. e Schematic showing a proposed model of the combinatory roles of cytokines and Wnt signaling in regulating cellular transitions in hepatocytes after injury, which is severely misregulated in SAH due to misspliced downstream Wnt mediators. (Created in BioRender. Das, D. (2025) https://BioRender.com/3lchxkt).

Update of

References

    1. Devarbhavi, H. et al. Global burden of liver disease: 2023 update. J. Hepatol.79, 516–537 (2023). - PubMed
    1. Patel, P. V. & Flamm, S. L. Alcohol-related liver disease including new developments. Clin. Liver Dis.27, 157–172 (2023). - PubMed
    1. Jung, Y. et al. Accumulation of hedgehog-responsive progenitors parallels alcoholic liver disease severity in mice and humans. Gastroenterology134, 1532–1543 (2008). - PMC - PubMed
    1. Dubuquoy, L. et al. Progenitor cell expansion and impaired hepatocyte regeneration in explanted livers from alcoholic hepatitis. Gut64, 1949–1960 (2015). - PMC - PubMed
    1. Aravinthan, A. et al. Hepatocyte expression of the senescence marker p21 is linked to fibrosis and an adverse liver-related outcome in alcohol-related liver disease. PLoS ONE8, e72904 (2013). - PMC - PubMed

Substances

LinkOut - more resources