. 2025 Dec;39(12):2881-2894.
doi: 10.1038/s41375-025-02739-8. Epub 2025 Sep 10.

A three-dimensional ex vivo model recapitulates in vivo features and drug resistance phenotypes in childhood acute lymphoblastic leukemia

Affiliations

A three-dimensional ex vivo model recapitulates in vivo features and drug resistance phenotypes in childhood acute lymphoblastic leukemia

Magdalini Kanari et al. Leukemia. 2025 Dec.

Abstract

Acute lymphoblastic leukemia (ALL) preferentially localizes in the bone marrow (BM) and displays recurrent patterns of medullary and extra-medullary involvement. Leukemic cells exploit their niche for propagation and survive selective pressure by chemotherapy in the BM microenvironment, suggesting the existence of protective mechanisms. Here, we established a three-dimensional (3D) BM mimic with human mesenchymal stromal cells and endothelial cells that resemble vasculature-like structures to explore the interdependence of leukemic cells with their microenvironment. This model recapitulates recurrent topologic differences between B-cell and T-cell precursor ALL, whereby B-ALL interacts more closely with the mesenchymal compartment. Migration versatility was found to be associated with subtype, consistent with increased motility observed in T-ALL in vivo. Single-cell RNA signatures revealed similarities to profiles from in vivo patient derived xenografts, suggesting relevant states ex vivo. Furthermore, enhanced migration, adherence and cell cycle heterogeneity was visualized in our co-culture model. Finally, drug response experiments in this 3D model confirm clinically relevant sensitivity and resistance patterns that reflect specific disease phenotypes and may provide a broader dynamic range for drug response testing.


Conflict of interest statement

Competing interests: Ectica Technologies AG, in which B.R.S. and M.E. have ownership and interests, provided the hydrogel-based cell culture plate used in this study as an in-kind contribution. The remaining others declare no conflict of interest.

Figures
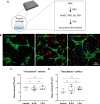
Fig. 1
Fig. 1. Description of the 3D vasculature-like model for leukemic PDXs.
A Experimental set-up. The 3DProSeed® Hydrogel Well Plate was used for the establishment of the ex vivo model. Primary MSCs are cultured for 24 h, followed by the addition of HUVECs, MSCs and ALL PDXs. B Representative confocal fluorescence images of the co-cultures in maximum intensity projections using confocal z-stacks (z-step: 10 μm) showing MSCs (blue), HUVECs (green), and ALL cells (red). C, D A vasculature-like network is detected in a similar manner in all 11 conditions tested (MSC-HUVEC controls, 10 PDXs co-cultures with MSC and HUVECS). Depicted are the (C) mean volume and (D) mean surface of the HUVECs (“vasculature”) in triplicates. Controls were quantified in triplicates in three separate experiments (statistical analysis: unpaired t test, significant p value < 0.05).
Fig. 2
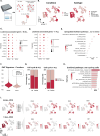
Fig. 2. ALL PDX cells exhibit distinct phenotypes upon immediate interaction with microenvironment cells.
A Maximum intensity projections of confocal z-stacks (z-step: 7.8 μm) showing the immediate formation of multicellular clusters consisting of MSCs (blue), HUVECs (green) and ALL cells (red) at 0 h, 6 h and 12 h upon seeding. The leukemic cells follow the clustering behavior of MSCs and HUVECs towards the network formation (12 h, 5 min interval). The corresponding bar plots show decreased ALL cell-to-cell distances, quantified as the minimum 3D distances between two leukemic cells (3D single-cell analysis, bin center = 5). B, C Motility analysis of segmented ALL single cells: (B) speed (C) displacement (bin center = 2, statistical analysis: Kolmogorov-Smirnov unpaired t tests with p < 0.0001). D, E Image-based single-cell segmentation and quantification of the vertical positioning (z-axis) of ALL cells, normalization based on the median position of each timepoint. Data obtained by 30-h live cell imaging with a 5 min interval. Depicted is the Δ in median z-position from timepoint 0 to 30 based on the normalized data (and actual values in μm), as well as the standard deviation (SD) at 0 (T0) and 30 (T30) hours. F 3D segmentation of all cell types at 72 h enables proximity analysis of ALL cells relative to MSCs or HUVECS, dH: minimum ALL distance to HUVEC, dM: minimum ALL distance to MSC. G Percentage of ALL cells located within <10 μm of MSC and HUVEC (statistical analysis: paired Wilcoxon signed rank test with p < 0.05, n = 3 per condition, 10 different PDXs as biological replicates). H, I Topological analysis of ALL cells stratified by molecular subtype. H B-ALL PDXs are significantly closer to MSCs than T-ALL PDXs, while (I) no subtype-dependent difference is observed in proximity to HUVECs (unpaired t-test with Welch’s correction, p < 0.05; n = 3 per condition).
Fig. 3
Fig. 3. MSC multi-lineage differentiation in 3D resembles in vivo and human data.
A UMAP projections showing MSC population overlap based on the culturing condition; left: two controls, i.e. MSC and MSC ( + HUVEC), right: MSC ( + HUVEC + ALL), PDX1-PDX6 indicating the six different ALL PDXs). B Feature plots depicting the expression of CXCL12 (top) and PDGFRA (bottom) across the MSC populations. C Identification of multi-lineage MSC subpopulations based on established lineage-specific gene signatures, projected in UMAP, upon coculturing in 3D. D Proportional distribution of MSC subtypes across conditions, with the increased population percentages in white. Arrows indicating increase or decrease upon co-culture. E GSEA dot plot showing the top 10 enriched pathways in MSCs from the MSC( + HUVEC) and MSC( + HUVEC + ALL) to the MSC control comparison.
Fig. 4
Fig. 4. Endothelial cells re-organize the microenvironment in the leukemic conditions.
A UMAP projections showing HUVEC population overlap based on the culturing condition; left: two controls, i.e. HUVEC and HUVEC ( + MSC), right: HUVEC ( + MSC + ALL, PDX1-PDX6 indicating the six different ALL PDXs). B Dot plot depicting the expression of representative marker genes used to identify transcriptionally distinct HUVEC subpopulations. C UMAP projection with the corresponding HUVEC subpopulations. D Stacked bar plot depicting the relative abundance of each HUVEC subpopulation per condition. E GSEA dot plot showing degradation of the ECM amongst the top 5 pathways enriched in the HUVECs cultured in MSC-HUVEC-ALL co-cultures.
Fig. 5
Fig. 5. Comparison of leukemic gene expression from 3D co-culture and in vivo leukemia xenografts.
A Sequencing of leukemic PDXs in three different conditions, mono-, co-culture and bone marrow cells from leukemia xenografts in vivo. B UMAP projections of the integrated datasets (RPCA reduction through Seurat), visualized by condition (left) and leukemia subtype (right). Subtype is the leading source of variability, determining the clustering in the UMAP projection. C Expression of leukemia-associated genes for B-ALL (scaled dot plot) across conditions. D Expression of leukemia-associated genes for T-ALL (scaled dot plot) across conditions. E GSEA comparing co-cultured ALL cells to mono-cultured. Depicted are the top 10 upregulated hallmark pathways. EMT is revealed as the most upregulated pathway in co-cultures. F Violin plot showing the expression of the EMT signature expression in B- and T-ALL cells for the co-culture, revealing higher EMT activity in B-ALL. G Stacked bar plots showing the proportion of cycling and non-cycling cells in B- and T-ALL for the two conditions, co-culture and in vivo. H GSEA bar plot depicting the top 10 upregulated pathways comparing non-cycling (G1) to cycling cells (G2M and S). I UMAP projections depicting the B-ALL (top, pdx1-pdx4) and T-ALL (bottom, pdx5-pdx6) PDXs, linked to expression of known ALL cell surface markers.
Fig. 6
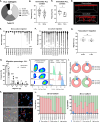
Fig. 6. 3D co-culture-enhanced ALL aggregation, migration and proliferation lead to increased heterogeneity.
A Pie chart showing that 13 PDXs of different subtypes were analyzed in the 3D model. B Immediate cell-cell proximity ( < 10 μm) is enriched in co-cultures, suggesting superior cell communication (n = 3, PDXs used as biological replicates, statistical analysis: Wilcoxon matched-pairs signed rank test, p value < 0.05). C Immediate contact is significantly enriched in B-ALL samples compared to T-ALL (same statistics as B). D Representative 3D reconstruction of B-ALL cells in the hydrogel. E, F Single-cell spatial distribution normalized to the highest ALL z-position per well. Light gray: B-ALL PDXs, Dark gray: T-ALL PDXs. G Dot plot showing the migration percentage of HUVECs, normalized to the highest leukemic cell position detected in the hydrogel (n = 3, statistical analysis: unpaired t test, p value < 0.05). H Migration analysis reveals that approximately 20–40% of ALL cells are in direct contact with the vessel-like structure (n = 3, statistical analysis: Wilcoxon matched-pairs signed rank test, p value < 0.05). Migration percentages are based on the relative position of each cell to the highest localized ALL cell. I Proliferation assessment with CellTrace Violet via Flow Cytometry. The CellTrace intensity reveals a non-cycling (defined by timepoint 0, high CellTrace intensity), a slow cycling (medium CellTrace intensity) and a high cycling population (low CellTrace intensity). J Plots depicting the percentage of cells in each phase across the 13 PDXs per condition. K Immunofluorescent staining with CD19 for lymphocyte (B-ALL) identification. Both CellTrace positive (yellow arrows, non-cycling) and negative cells (white arrows, cycling) are detected. L Stacked bar plots depicting the proportions of non-cycling, slow cycling and high cycling cells in 3D and 2D co-culture respectively on day 7.
Fig. 7
Fig. 7. Drug screenings in the 3D co-culture reveal increased resistance.
A Gating strategy for flow cytometry. Viable ALL cells were gaited for lymphocytes based on their size, followed by doublet exclusion, cellTrace positivity and PI negativity. B Experimental design. Drug responses in the 3D co-culture system were compared to those in a standardized drug response profiling protocol, where immortalized hTERT-MSCs-ALL co-cultures are treated for 72 h (n = 3). C Bar plots showing the normalized response values (integrated normalized cell counts over two concentrations) for all the 3D and 2D conditions (n = 3, statistical analysis: ratio paired t test, p value < 0.05). D Percentile ranking indicating the response patterns across the conditions, color-coded based on the response in 3D. EI Dot plots showing the normalized viability of the leukemic cells upon treatment with different compounds. Depicted is the response to 100 and 10,000 nM in the 2D and 3D systems respectively. From left to right : (E) idasanutlin, (F) venetoclax, (G) doxorubicin, (H) vincristine, and (I) dexamethasone.

References

    1. Inaba H, Mullighan CG. Pediatric acute lymphoblastic leukemia. Haematologica. 2020;105:2524–39. - PMC - PubMed
    1. Passaro D, Garcia-Albornoz M, Diana G, Chakravarty P, Ariza-McNaughton L, Batsivari A, et al. Integrated OMICs unveil the bone-marrow microenvironment in human leukemia. Cell Rep. 2021;35:109119. - PMC - PubMed
    1. Baryawno N, Przybylski D, Kowalczyk MS, Kfoury Y, Severe N, Gustafsson K, et al. A Cellular Taxonomy of the Bone Marrow Stroma in Homeostasis and Leukemia. Cell. 2019;177:1915–32. - PMC - PubMed
    1. Anderson D, Skut P, Hughes AM, Ferrari E, Tickner J, Xu J, et al. The bone marrow microenvironment of pre-B acute lymphoblastic leukemia at single-cell resolution. Sci Rep. 2020;10:19173. - PMC - PubMed
    1. Morrison SJ, Scadden DT. The bone marrow niche for haematopoietic stem cells. Nature. 2014;505:327–34. - PMC - PubMed

LinkOut - more resources