. 2025 Oct;646(8087):1272-1280.
doi: 10.1038/s41586-025-09491-0. Epub 2025 Sep 10.

Structure and mechanism of the mitochondrial calcium transporter NCLX

Affiliations

Structure and mechanism of the mitochondrial calcium transporter NCLX

Minrui Fan et al. Nature. 2025 Oct.

Abstract

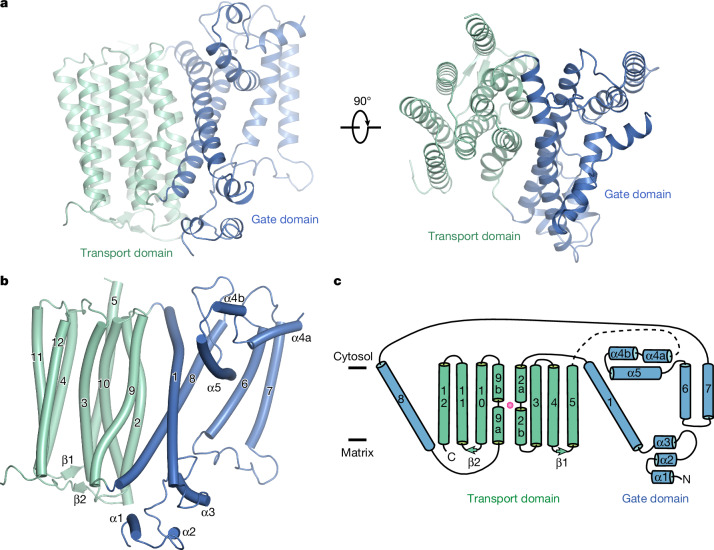
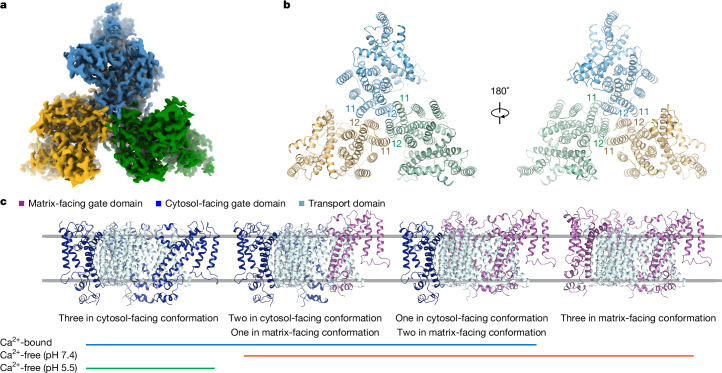
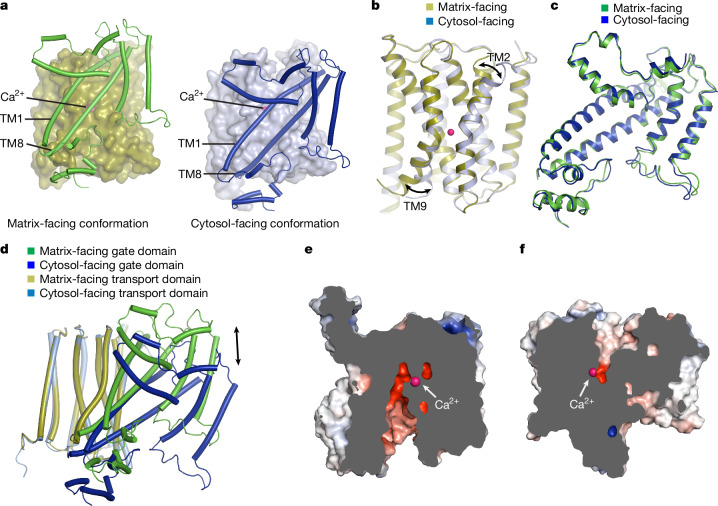
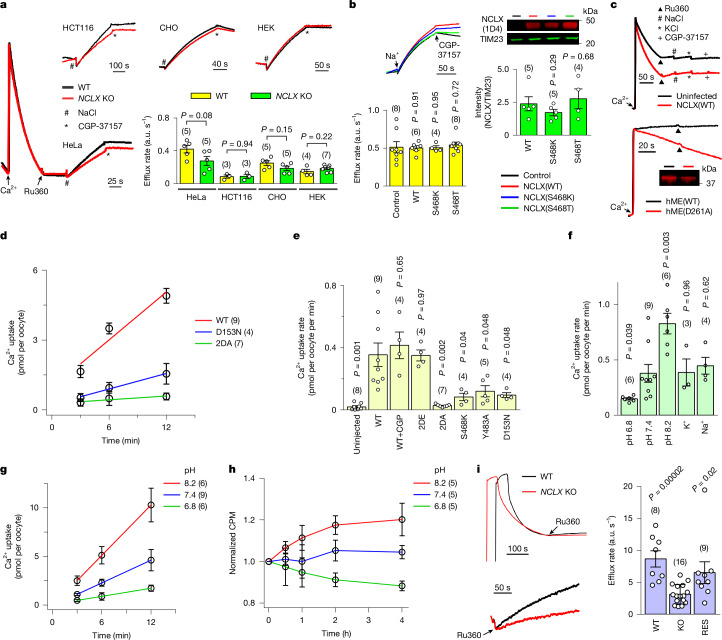
As a key mitochondrial Ca2+ transporter, NCLX regulates intracellular Ca2+ signalling and vital mitochondrial processes1-3. The importance of NCLX in cardiac and nervous-system physiology is reflected by acute heart failure and neurodegenerative disorders caused by its malfunction4-9. Despite substantial advances in the field, the transport mechanisms of NCLX remain unclear. Here we report the cryo-electron microscopy structures of NCLX, revealing its architecture, assembly, major conformational states and a previously undescribed mechanism for alternating access. Functional analyses further reveal an unexpected transport function of NCLX as a H+/Ca2+ exchanger, rather than as a Na+/Ca2+ exchanger as widely believed1. These findings provide critical insights into mitochondrial Ca2+ homeostasis and signalling, offering clues for developing therapies to treat diseases related to abnormal mitochondrial Ca2+.


Conflict of interest statement

Competing interests: The authors declare no competing interests.

Figures

Fig. 1
Fig. 1. Structure of an NCLX protomer.
a, Structure of an NCLX protomer. The ribbon representations of the NCLX protomer (in a matrix open conformation) are viewed from membrane and intermembrane space, respectively. b, The overall architecture of an NCLX protomer. c, The topology of NCLX.
Fig. 2
Fig. 2. Assembly of NCLX.
a, The density map of an NCLX trimer. The density map (Ca2+ bound, cytosol-facing conformation) is coloured by subunit. b, The structure of an NCLX trimer. The Ca2+ bound, cytosol-facing conformation of NCLX is shown as a ribbon from the cytosolic and matrix sides, respectively, with TM11 and TM12 labelled at the trimer interfaces. c, The conformational state assembly of NCLX trimers. The transport domain is coloured cyan, whereas the gate domain of each protomer is coloured according to the conformational state. The conditions leading to the 3D reconstructions with specific conformational state assembly are indicated by the coloured lines below.
Fig. 3
Fig. 3. Conformational states of NCLX.
a, NCLX in matrix- and cytosol- facing conformations. The transport domains are represented by the surface, whereas the gate domain helices are shown as cylinders. b, Superposition of the transport domain in matrix- and cytosol- facing conformations. c, Superposition of the gate domain in matrix- and cytosol- facing conformations. d, Superposition of NCLX in matrix- and cytosol- facing conformations. The arrow indicates the direction of the movement of the gate domain from the matrix- to the cytosol-facing conformation. e, The slab view of NCLX in the matrix-facing conformation. f, The slab view of NCLX in a cytosol-facing conformation. Ca2+ is shown as a magenta sphere in e and f.
Fig. 4
Fig. 4. The Ca2+-binding site of NCLX.
a, Coordination of Ca2+ at the Ca2+-binding site in the experimental structure (Ca2+ shown as a magenta sphere in the zoomed-in view on the right and as a green sphere on the left for contrast). Ca2+ is coordinated by the D153 and D471 side-chain oxygens; the N149 and N467 backbone oxygens; and water molecules. b, The density map of the Ca2+-binding site of NCLX. The densities are shown as blue meshes (contoured at 14σ), with Ca2+ displayed as a magenta sphere and the coordinating water molecules as red spheres. c, Superposition of matrix-facing NCLX in the presence and absence of Ca2+. d, Superposition of cytosol-facing NCLX in the presence and absence of Ca2+. A magnified view of TM2 and TM9 coordinated by Ca2+ is shown on the right.
Fig. 5
Fig. 5. NCLX functional determination.
a, Mito-NCX activity in indicated cell lines. Cells were digitonin-permeabilized with calcium green 5N (CG5N) for reporting extra-mitochondrial Ca2+. Ca2+ (10 µM) increases CG5N fluorescence, followed by a signal reduction reflecting mitochondrial Ca2+ uptake. After Ru360 inhibits Ca2+ uptake, 10 mM Na+ induces mito-NCX, abolished by 5 µM CGP-37157. Mito-NCX rates are summarized in the bar chart. b, Effect of expressing NCLX constructs on mito-NCX in HEK cells. Ca2+ efflux traces (top left), efflux rates (bottom left) and Western blots (right) compare activity and expression levels. Control: no NCLX overexpression. c, Mitochondrial Ca2+ transport in Sf9 cells. Top: 10 mM Na+ fails to elicit mito-NCX with or without human NCLX overexpression in permeabilized Sf9 cells. Bottom: an MCU–EMRE fusion protein (hME) with a D261A substitution induces Ru360-insensitive mitochondrial Ca2+ uptake. Ru360 was also added before Ca2+ addition to inhibit native uniporter activity. d, 45Ca2+ influx into Xenopus oocytes expressing indicated human NCLX constructs. Solid lines indicate linear fits used to obtain Ca2+ uptake rates. 2DA, D153A–D471A. e, Impact of CGP-37157 or NCLX substitutions on Ca2+ uptake into oocytes. Expression levels of mutants are 80–120% of WT. Uninjected, no RNA injection; 2DE, D153E–D471E. P values were obtained by comparing with the WT. f,g, Sensitivity of WT NCLX activity to external pH, Na+ (100 mM) or K+ (100 mM). The Ca2+-uptake rate summary and pH-dependence raw data are shown in f and g, respectively. Solid lines represent linear fits. h, H+-coupled Ca2+ flux. Oocytes expressing WT NCLX and preloaded with 45Ca2+ were exposed to the indicated external pH. Intracellular 45Ca2+ measured at various time points were normalized to the average count at t = 0. CPM, count per minute. i, NICE in HeLa cells. Following CG5N addition (initial signal jump) and digitonin-induced slow signal decline, Ru360 addition inhibits the uniporter and reveals NICE, as also shown in the zoomed-in traces (bottom left) and quantified in the bar chart. RES, NICE rescue by expressing WT NCLX in NCLX KO cells. Numbers in parentheses indicate independent biological repeats. The molecular mass marker unit is kilodaltons. Data show the mean ± s.e.m. Statistics was performed using an unpaired, two-tailed t-test (significant at P < 0.05). Refer to Supplementary Fig. 1 for gel source data. a.u., arbitrary unit. Source Data
Extended Data Fig. 1
Extended Data Fig. 1. Sequence alignment of NCLX.
The sequences of NCLX from Rattus norvegicus (Rn; NCBI-ProteinID: NP_001017488), Homo sapiens (Hs; ID: NP_079235), Gallus gallus (Gg; ID: XP_004934554), Xenopus laevis (Xl; ID: NP_001128697), Carcharodon carcharias (Cc; ID: XP_041058292), Ciona intestinalis (Ci; ID: XP_002130159), Caenorhabditis elegans (Ce; ID: NP_499146), Arabidopsis thaliana (At; ID: NP_197288) are aligned. For each organism, the protein with the highest sequence similarity to rat NCLX (identified as the top BLASTP hit) was selected for sequence alignment. These homologues all exhibit similarity across the full length of the protein. Subcellular localization of these homologues remains to be determined. Some organisms, such as C. elegans, possess multiple potential NCLX homologues, including ncx-9, which has been suggested to localize to mitochondria. The two Ca2+-coordinating aspartate residues, D153 and D471, are indicated with blue circles.
Extended Data Fig. 2
Extended Data Fig. 2. Purification and biochemical characterization of rat NCLX and cryo-EM data processing of NCLX without calcium (pH 7.4).
a, Gel filtration profile of NCLX. b, SDS-PAGE gel of the purified NCLX (representative of six independent experiments with similar results). The gel source data are included in Supplementary Fig. 1. c, A flowchart of NCLX without calcium data processing. Conformational states of protomers: Class 1, three in matrix-facing conformation; Class 2, two in matrix-facing and one in cytosol-facing conformation; Class 3, one in matrix-facing and two in cytosol-facing conformation. Final map gold-standard FSC curves and angular particle distribution are shown next to the local resolution map for each class. d, A representative cryo-EM image (from 4,264 micrographs with similar results). e, Typical 2D class averages. f, Map vs. model FSC. g, Cryo-EM density corresponding to model.
Extended Data Fig. 3
Extended Data Fig. 3. Cryo-EM data processing of NCLX with calcium.
a, A flowchart of NCLX with calcium data processing. Conformational states of protomers: Class 2a, two in matrix-facing and one in cytosol-facing conformation; Class 3a, one in matrix-facing and two in cytosol-facing conformation; Class 4a, three in cytosol-facing conformation. Final map gold-standard FSC curves and angular particle distribution are shown next to the local resolution map for each class. b, A representative cryo-EM image (from 24,443 micrographs with similar results). c, Typical 2D class averages. d, Map vs. model FSC. e, Cryo-EM density corresponding to model.
Extended Data Fig. 4
Extended Data Fig. 4. Cryo-EM data processing of NCLX without calcium at low pH.
a, A flowchart of NCLX without calcium at low pH data processing. Conformational states of protomers: Class 4b, three in cytosol-facing conformation. Final map gold-standard FSC curves and angular particle distribution are shown next to the local resolution map. b, A representative cryo-EM image (from 9,653 micrographs with similar results). c, Typical 2D class averages. d, Map vs. model FSC. e, Cryo-EM density corresponding to model.
Extended Data Fig. 5
Extended Data Fig. 5. Determination of NCLX orientation and the comparison of NCLX assembly and the Ca2+-binding site in different conformational states.
a, Protease digestion of NCLX. After isolating mitoplasts from HEK cells expressing C-terminally 1D4-tagged human NCLX, adding proteinase K (Pro-K) causes a downward shift of the NCLX band, as detected by an anti-1D4 antibody (image on the left). This suggests that (1) the C-terminal 1D4 tag dwells within the matrix and is therefore protected from Pro-K digestion, and (2) Pro-K cuts an NCLX area in the intermembrane space to cause the observed band shift. As the loop between TM5 and TM6 is large and unstructured, we hypothesized that this loop is digested by Pro-K. Accordingly, we introduced a TEV protease (TEVP) site after V278 in the TM5-6 loop and digested this construct in mitoplasts using TEVP. This manoeuvre produces a band at a similar location as the band generated by Pro-K digestion of WT NCLX, suggesting that Pro-K and TEVP both can cut the TM5-6 loop and that this loop is in the intermembrane space. Two subunits in the mitochondrial Ca2+ uniporter complex, MCU and EMRE, were used as controls. The green bands represent native MCU proteins. As most of MCU’s protein mass is in the matrix, it is not affected by Pro-K or TEVP. The EMRE protein has its C-terminal end exposed to the intermembrane space. Therefore, Pro-K was able to digest a 1D4 tag attached to EMRE’s C-terminus, as reflected by the disappearance of the Western blot signal created by the anti-1D4 antibody (image on the right). The experiment was performed with four independent biological replicates, all yielding similar results. Molecular weight marker unit: kDa. For gel source data, see Supplementary Fig. 1. b, A schematic of NCLX orientation and transmembrane topology. Key residues in panels a and c are highlighted in blue. The orange dotted lines surrounding M196 indicate linkers that were engineered to make M196 more exposed. c, TEVP digestion of NCLX. TEVP sites were introduced into NCLX in positions after the indicated residues. Those sites, whose digestion by TEVP is unaffected by DDM (e.g., D350 and M196), are located in the intermembrane space. By contrast, those sites, which require DDM to be fully digested by TEVP (e.g., M584 and V51), are inside the matrix. In the presence of DDM, cleavage of the TEVP site after M584 causes the disappearance of the band (lane 9 from the left). This is because the fragment that contains the 1D4 tag is too small (~10 amino acids) and would migrate out of the gel. Digestion of the TEVP site after V51 causes a band shift (lane 12 from the left). This is because the digested fragment that contains NCLX residue 52–584 and the C-terminal 1D4 tag is smaller than the undigested NCLX (lanes 10 and 11). For gel source data, see Supplementary Fig. 1. d, A summary of TEVP digestion results. The Western signal ratios of digested NCLX with or without DDM in panel c are presented. A ratio close to 1 indicates that DDM does not have effects on proteolysis, while a ratio close to 0 indicates that the TEV site is in the matrix, protected by the inner mitochondrial membrane. Data are shown as means ± s.e.m. Numbers in parentheses indicate the number of independent biological replicates. e, The superposition of three classes of Ca2+-free NCLX. The transport domains that mediate the oligomerization superimpose well. f, The superposition of three classes of NCLX with Ca2+. The transport domains that mediate the oligomerization superimpose well. g, The coordination environment around the Ca2+ binding site (cytosol-facing conformation). Ca2+ is depicted as a green sphere, and the water molecules are shown as red spheres. h, Superposition of Ca2+-coordinating residues in cytosol- and matrix- facing conformations. i, Superposition of cytosol-facing NCLX with Ca2+ bound or at low pH without Ca2+ (comparison of the protomer on the left and the transport domain on the right). Source Data
Extended Data Fig. 6
Extended Data Fig. 6. Time series of key distances in the Ca2+-binding site.
Plots shown are for five independent simulations for each of three simulation sets: (1) simulations of cytosol-open NCLX initiated with a Ca2+ ion in the binding pocket (blue traces); (2) simulations of matrix-open NCLX initiated with a Ca2+ ion in the binding pocket (orange traces); (3) simulations of matrix-open NCLX initiated with no Ca2+ ions in the binding pocket (black traces). All carboxylic acidic side chains, including those of D153 and D471, are deprotonated (negatively charged) in all simulations shown. Unsmoothed traces (thin lines) and smoothed traces (thick lines) are shown for all simulations. Time traces were smoothed using a moving average with a window size of 20 ns. See Methods.
Extended Data Fig. 7
Extended Data Fig. 7. Frequency distributions of key distances in the Ca2+-binding site and a comparison between experimental structures and MD simulations.
a, Distributions are computed across five independent simulations for each of two simulation sets: (left) simulations of cytosol-facing NCLX initiated with a Ca2+ ion in the binding pocket(blue curves); (right) simulations of matrix-facing NCLX initiated with a Ca2+ ion in the binding pocket (orange curves) (see Methods). All aspartate and glutamate residues are charged in all simulations shown. b, Comparison of Ca2+-coordinating residues in cryo-EM structures and MD simulations. Left: superposition of the cryo-EM structure of NCLX in a cytosol-facing conformation onto a representative frame from MD simulations. Right: superposition of the cryo-EM structure of NCLX in a matrix-facing conformation onto a representative frame from MD simulations.
Extended Data Fig. 8
Extended Data Fig. 8. Functional analysis of NCLX.
a, Subcellular localization of overexpressed NCLX in HEK cells. NCLX in whole-cell lysates (WCL), mitochondria (Mito), and post-mitochondrial supernatant (PMS), prepared from equal numbers of cells, was analysed. As a control to demonstrate the robustness of the subcellular fractionation, we show that MCU and a mitochondrial protein COX2 are predominantly present in the Mito fraction, while β-actin is mostly in the cytosol. Results show that overexpressed, C-terminally 1D4-tagged WT or mutant NCLX, detected by the 1D4 antibody, mostly travels to mitochondria, with only a small fraction present outside of mitochondria as summarized in the bar chart. b, A representative result showing the presence of NCLX in Sf9-cell mitochondria. Experiments were performed as in a. The absence of Histone H3 in the mitochondrial fraction confirms minimal nuclear contamination. c, Mitochondrial Ca2+ efflux in Sf9 cells. The trace supplements the upper panel in Fig. 5c to show that adding Ru360 to inhibit the uniporter reveals mitochondrial Ca2+ efflux in Sf9 cells. d, NCLX in Xenopus oocyte membranes. The plasma membranes of Xenopus oocytes expressing 1D4-tagged WT or mutant NCLX were isolated, as described in Materials and Methods, and were analysed with Western blot using the 1D4 antibody. e, NCLX-induced NICE in Sf9 mitochondria. WT, 2DA (D153A-D471A), or S468K NCLX was expressed to similar levels in sf9 cells, as shown in the Western blot image. Mitochondrial Ca2+ flux experiment, performed in the absence of Na+, shows that blocking the uniporter with Ru360 reveals NICE mediated by NCLX. The rate of NICE in Sf9 mitochondria is ~10-fold faster than that in HeLa cells (Fig. 5i), likely because higher NCLX expression in Sf9 cells. The p value in the bar chart was obtained by comparing with WT NCLX. Control: uninfected Sf9 cells. f, The effect of functionally impaired NCLX mutants on WT NCLX. WT NCLX was co-expressed with 2DA NCLX or an unrelated protein EMRE as a control in Sf9 cells. 2DA NCLX does not affect NICE mediated by WT NCLX, suggesting that a functionally impaired mutant would not affect the function of WT subunits in the NCLX trimer. g, NCLX mRNA levels in various NCLX-KO cell lines. The bar chart presents NCLX mRNA levels in NCLX-KO cell lines as compared with their corresponding WT cells. Note that CRISPR KO would not eliminate NCLX mRNA, because it works by introducing insertion or deletion into the NCLX gene to cause frameshifts, instead of targeting mRNA for degradation as in the case of shRNA. Throughout the entire figure, data are presented as means ± s.e.m., with values in parentheses denoting the number of independent biological replicates, and statistics performed using unpaired, two-tailed t-test. Experiments in panels b-d were performed with three independent biological replicates with consistent results. Molecular weight marker unit: kDa. For gel source data, see Supplementary Fig. 1. Source Data
Extended Data Fig. 9
Extended Data Fig. 9. Time series of Ca2+ position in simulations with D153 and D471 deprotonated or protonated.
Plots are shown for five independent simulations under each of four conditions: (1) simulations of cytosol-open NCLX initiated with a Ca2+ ion in the binding pocket, with D153 and D471 deprotonated (blue traces); (2) simulations of cytosol-open NCLX initiated with a Ca2+ ion in the binding pocket, with D153 and D471 protonated(gray traces); (3) simulations of matrix-open NCLX initiated with a Ca2+ ion in the binding pocket, with D153 and D471 deprotonated (orange traces); (4) simulations of matrix-open NCLX initiated with a Ca2+ ion in the binding pocket, with D153 and D471 protonated (brown traces). The z-axis is the direction perpendicular to the lipid bilayer. The z-coordinate is 0 at the initial Ca2+ position, with values increasing in the direction of the matrix and decreasing in the direction of the cytosol. Red arrows mark times at which the Ca2+ exits the transporter; subsequently, it either interacts with charged residues at the protein surface or diffuses freely through the solvent. Unsmoothed traces (thin lines) and smoothed traces (thick lines) are shown for all simulations. Time traces were smoothed using a moving average with a window size of 20 ns.

References

    1. Palty, R. et al. NCLX is an essential component of mitochondrial Na+/Ca2+ exchange. Proc. Natl Acad. Sci. USA107, 436–441 (2010). - PMC - PubMed
    1. Garbincius, J. F. & Elrod, J. W. Mitochondrial calcium exchange in physiology and disease. Physiol. Rev.102, 893–992 (2022). - PMC - PubMed
    1. De Stefani, D., Rizzuto, R. & Pozzan, T. Enjoy the trip: calcium in mitochondria back and forth. Annu. Rev. Biochem.85, 161–192 (2016). - PubMed
    1. Luongo, T. S. et al. The mitochondrial Na+/Ca2+ exchanger is essential for Ca2+ homeostasis and viability. Nature545, 93–97 (2017). - PMC - PubMed
    1. Garbincius, J. F. et al. Enhanced NCLX-dependent mitochondrial Ca2+ efflux attenuates pathological remodeling in heart failure. J. Mol. Cell. Cardiol.167, 52–66 (2022). - PMC - PubMed

LinkOut - more resources