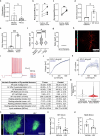
. 2025 Oct;646(8087):1232-1242.
doi: 10.1038/s41586-025-09492-z. Epub 2025 Sep 10.

Neuronal activity-dependent mechanisms of small cell lung cancer pathogenesis

Affiliations

Neuronal activity-dependent mechanisms of small cell lung cancer pathogenesis

Solomiia Savchuk et al. Nature. 2025 Oct.

Abstract

Neural activity is increasingly recognized as a crucial regulator of cancer growth. In the brain, neuronal activity robustly influences glioma growth through paracrine mechanisms1 and by electrochemical integration of malignant cells into neural circuitry via neuron-to-glioma synapses2,3. Outside of the central nervous system, innervation of tumours such as prostate, head and neck, breast, pancreatic, and gastrointestinal cancers by peripheral nerves similarly regulates cancer progression4-12. However, the extent to which the nervous system regulates small cell lung cancer (SCLC) progression, either in the lung or when growing within the brain, is less well understood. SCLC is a lethal high-grade neuroendocrine tumour that exhibits a strong propensity to metastasize to the brain. Here we demonstrate that in the lung, vagus nerve transection markedly inhibits primary lung tumour development and progression, highlighting a critical role for innervation in SCLC growth. In the brain, SCLC cells co-opt neuronal activity-regulated mechanisms to stimulate growth and progression. Glutamatergic and GABAergic (γ-aminobutyric acid-producing) cortical neuronal activity each drive proliferation of SCLC in the brain through paracrine and synaptic neuron-cancer interactions. SCLC cells form bona fide neuron-to-SCLC synapses and exhibit depolarizing currents with consequent calcium transients in response to neuronal activity; such SCLC cell membrane depolarization is sufficient to promote the growth of intracranial tumours. Together, these findings illustrate that neuronal activity has a crucial role in dictating SCLC pathogenesis.


Conflict of interest statement

Competing interests: M.M. holds equity in MapLight Therapeutics and Stellaromics, and stock in CARGO Therapeutics. M.M. was previously on the scientific advisory board for Cygnal Therapeutics. J.S. has equity in and is an advisor for DISCO Pharmaceuticals. B.I. has received consulting fees and honoraria from Volastra Therapeutics Inc., Merck, AstraZeneca, Novartis, Eisai and Janssen Pharmaceuticals and has received research funding to Columbia University from Alkermes, Arcus Biosciences, Checkmate Pharmaceuticals, Compugen, Immunocore, Merck, Regeneron and Synthekine. B.I. is a founder of Basima Therapeutics, Inc.

Figures
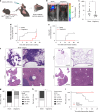
Fig. 1
Fig. 1. Vagal nerve innervation is critical for primary SCLC initiation and development.
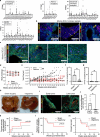
a, Experimental paradigm for unilateral cervical vagotomy in genetic mouse model of spontaneously forming SCLC (RPR2-luc). Created in BioRender. Savchuk, S. (2025) https://BioRender.com/5fwotqm. b, Representative in vivo imaging system (IVIS) image of RPR2-luc mice 10 weeks after sham or vagotomy procedure. Photon emission expressed as photons per second per cm2 per sr. The numbers on the images represent photon emission from the area selected within the red circles. c, Analysis of IVIS bioluminescence of overall tumour growth in SCLC primary tumours measured 10 weeks after vagotomy procedure (n = 11 sham and n = 9 vagotomy mice from 2 independent cohorts, P = 0.0465). Data are medians. d, Time course of tumour growth in RPR2-luc mice as measured by IVIS bioluminescence imaging after sham operation or vagotomy procedure. Events are recorded when mice begin to consistently show an increase in flux signal by tenfold between each weekly measurement (n = 11 sham and n = 9 vagotomy mice, P = 0.040). e, Time course of liver metastasis onset in RPR2-luc mice as detected by IVIS bioluminescence imaging after sham operation or vagotomy procedure (n = 11 sham and n = 9 vagotomy mice, P = 0.036). f, Representative haematoxylin and eosin (H&E) staining of lungs and livers isolated from sham-operated and denervated (vagotomy) RPR2-luc mice. Scale bars: 5,000 µm (left-hand images) and 250 µm (right-hand images). g, Quantification of lung tumour score (percentage of the organ occupied by the tumour) in sham-operated and denervated (vagotomy) RPR2-luc mice (n = 7 sham and n = 9 vagotomy mice, P = 0.005). h, As in g, for quantification of liver tumour score (n = 7 sham and n = 9 vagotomy mice, P = 0.019). i, Kaplan–Meier survival curve of RPR2-luc mice after either sham operation or denervation (vagotomy) (n = 11 sham and n = 9 vagotomy mice, P = 0.014). Mann–Whitney test (c); Gehan–Breslow–Wilcoxon test (d); log-rank (Mantel–Cox) test (e,i); Fisher’s exact test (g,h); all tests are two-tailed. **P < 0.01, *P < 0.05. Source data
Fig. 2
Fig. 2. Neuronal activity promotes SCLC growth within the brain.
a, Representative immunohistochemistry of human SCLC brain metastases. Left, H&E staining. Right, neurofilament (brown) with nuclear counterstain (blue). Scale bars, 150 µm. b, Proliferation index in regions of human SCLC brain metastases quantified less than or greater than 100 µm from axons (n = 9 patients, P = 0.0009). c, Representative images of mouse 16T SCLC cells (GFP) co-cultured with primary cortical neurons (MAP2). Proliferative cells are labelled with EdU. Scale bars, 50 µm. d, Quantification of data in c with or without addition of 1 µM TTX (n = 5 coverslips per condition, P = 0.0010). e, As in d, for human SCLC cells (H446, n = 4 coverslips per condition, n = 5 for baseline, P = 0.0003). f, Uniform manifold approximation and projection (UMAP) embedding of scRNA-seq profiles of mouse 16T SCLC cells isolated from monoculture or co-culture with primary mouse neurons. g, Distribution of SCLC cells in f on the UMAP embedding plot. h, Gene set enrichment analysis (GSEA) of the 16 populations identified in g reveals a distinct cluster among the SCLC cells isolated from neuron co-cultures that is enriched for proliferation-related genes (all gene signatures in Supplementary Table 1). ssGSEA, single-sample GSEA. i, Quantification of ssGSEA scores for synapse-related gene signature across the 16 clusters in g detects significant upregulation in cluster 14 (red, statistical testing in Supplementary Table 2). j, Visualization of cell clusters enriched for synapse-related genes among SCLC cells isolated from neuronal co-culture (cluster 14). k, Distribution of SCLC cells treated with 1 µM TTX in monoculture or neuron co-culture (Extended Data Fig. 4f) on the UMAP embedding plot. l, As in i but in the presence of 1 µM TTX (the 18 clusters in k). m, Expression of synapse-related genes in cells isolated from patient lung primary or recurrent or non-brain-metastatic lesions (n = 16) versus cells from patient SCLC brain metastases (n = 12, P < 0.0001). n, Expression of synapse-related genes across the cell types and malignant cell metaprogrammes (MP1–MP9) detected in patient lung primary, recurrent, non-brain-metastatic lesions (n = 16) or SCLC brain metastases (n = 12 patients). CNS, central nervous system; epi, epithelial. Data are mean ± s.e.m. (d,e); violin plots (i,l); violin and box plots (m,n). In box plots, the centre line is the median, box edges delineate 25th and 75th percentiles and whiskers extend to minimum and maximum values; dots represent outliers. Paired t-test (b); two-way ANOVA (d,e); one-way ANOVA with Tukey correction (i,l); pairwise Wilcoxon rank sum test (m). All tests are two-tailed. ****P < 0.0001, ***P < 0.001; NS, not significant. Source data
Fig. 3
Fig. 3. SCLC cells exhibit synaptic currents that drive tumour progression.
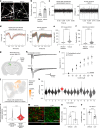
a, Immuno-electron microscopy of 16T-GFP SCLC cells allografted to mouse hippocampus. Black dots represent immunogold particles labelling GFP (tumour cells). Post-synaptic density in GFP+ tumour cells (pseudo-coloured green), synaptic cleft and clustered synaptic vesicles in apposing pre-synaptic neuron (blue) identify synapses (white arrowheads). Scale bars, 200 nm. b, Representative recordings of sEPSCs in allografted 16T SCLC cells. c, Fraction of SCLC cells demonstrating spontaneous currents illustrated in b at baseline (artificial cerebrospinal fluid (ACSF), 8 out of 53 cells) or with the addition of 10 µM NBQX (bottom, 0 out of 27 cells). d, Representative traces of neuronal activity-dependent synaptic currents evoked in SCLC (n = 27 out of 49 cells), blocked after application of 1 µM TTX. e, Representative traces of neuronal activity-dependent evoked SCLC currents before and after application of 10 µM gabazine (n = 3 out of 3 cells). f, Representative trace of 16T SCLC cell currents in response to local GABAergic stimulation in the presence of glutamatergic inhibitors in perforated-patch recordings using gramicidin D at varying membrane potentials. g, Current–voltage relationship of GABAergic stimulation-induced current in 16T SCLC cells recorded with perforated-patch electrophysiology. Reversal potential of GABA was −27.3 ± 5.5 mV (−31.0 mV based off linear fit in example trace); n = 6 cells across 3 mice. h, Cell-attached measurement of resting membrane potential of SCLC cells. Current traces recorded during voltage ramp are shown in black. The red line is the extrapolated leak current from a linear fit and vertical grey line indicates the intersection of the voltage-activated K+ current with the leak current, yielding the resting membrane potential of −72 ± 7 mV (n = 7 cells). i, Proliferative index of mouse 16T SCLC-A subtype cells co-cultured with human iPS cell-derived glutamatergic neurons reveals increased proliferation in co-culture, abrogated by the addition of 50 µM MK801 (NMDA receptor inhibitor for glutamate, n = 5 coverslips for baseline condition, n = 4 for MK801, n = 7 for co-culture and n = 6 for co-culture with MK801, P < 0.0001). j, As in i, but with 50 µM CNQX (AMPA receptor inhibitor for glutamate) (n = 5 coverslips per condition, P < 0.0001). k, Proliferative index of mouse SCLC-A subtype 16T cells co-cultured with human iPS cell-derived GABAergic neurons with or without addition of 1 µM TTX or 20 µM gabazine (GABAA receptor inhibitor) reveals that increased proliferation in co-culture is abrogated by TTX or gabazine (n = 3 coverslips per condition, P < 0.0001). Data are mean ± s.e.m. (ik). Two-way ANOVA (ik). All tests are two-tailed. Source data
Fig. 4
Fig. 4. Neuronal circuit activity and downstream tumour membrane depolarization drive tumour progression.
a, Paradigm for in vivo optogenetic stimulation of Thy1-ChR2 (ChR2) pyramidal premotor cortical projection neurons in awake behaving mouse with SCLC tumour allografted into the M2 cortex. b, Representative immunofluorescence of mouse 16T SCLC brain tumours (GFP) allografted in the cortex of wild-type (WT) or optogenetically stimulated ChR2 mice. Proliferating cells are labelled with Ki67. Scale bars, 50 µm. c, Quantification of data in b (n = 8 wild-type and n = 8 ChR2 mice, P = 0.0016). d, Quantification of SCLC cells (per 500 µm) invading beyond the tumour edge following optogenetic stimulation of wild-type or ChR2 mice (n = 6 wild-type and n = 6 ChR2 mice, P = 0.0029). e, Paradigm for in vivo optogenetic stimulation of Dlx-ChRmine (red-light-sensitive channelrhodopsin)-expressing GABAergic cortical interneurons in awake mice with SCLC tumours allografted into the M2 cortex. f, Representative immunofluorescence of mouse 16T SCLC brain tumours (GFP) allografted to the cortex of Dlx-ChRmine expressing mice (mCherry) following optogenetic stimulation (stim). Proliferating cells are labelled with Ki67. Scale bars, 50 µm. g, Quantification of data in f (n = 6 mock-stimulated mice and n = 7 stimulated mice, P = 0.0410). h, As in f for human H446 SCLC cells (n = 5 mock-stimulated and n = 7 stimulated mice, P = 0.0074). i, Two-photon in situ calcium imaging of GCaMP6s-expressing 16T SCLC cells in hippocampal allografts. Representative trace of spontaneous activity as measured by changes to GCaMP6s fluorescence in SCLC cells with (red) or without (black) administration of 0.5 µM TTX. j, Two-photon in situ calcium imaging of GCaMP6s-expressing SCLC cells in hippocampal allografts with Schaffer collateral stimulation (n = 6 slices, 4 mice). Representative frames shown before and after stimulation. Red denotes the tdTomato nuclear tag of SCLC cells; green denotes SCLC GCaMP6s. Scale bars, 25 µm. k, Quantification of GCaMP6s fluorescence in individual SCLC cells in response to electrical stimulation of CA1 Shaffer collateral axons with or without administration of 0.5 µM TTX (n = 22 cells, P < 0.0001). l, Paradigm for in vivo optogenetic depolarization of intracranial allografts of ChR2-expressing 16T SCLC cells. m, Representative immunofluorescence of ChR2-expressing SCLC allografts after mock or blue light-induced depolarization. Neuronal nuclei are labelled with NeuN and tumour cells are labelled with GFP. Scale bars, 200 µm. n, Quantification of mean tumour area from m (n = 5 mock and n = 7 depolarized mice, P = 0.0101). Data are mean ± s.e.m. (c,d,g,h); data are median ± interquartile range (n). Unpaired t-test (c,d,g,h); paired t-test (k); Mann–Whitney test (n). All tests are two-tailed. Drawings in a,e,l created in BioRender. Savchuk, S. (2025) https://BioRender.com/5fwotqm. Source data
Fig. 5
Fig. 5. SCLC induces neuronal hyperexcitability.
a, Immunofluorescence of human iPS cell-derived neurons in monoculture (left) or co-cultured with 16T SCLC cells (right). Arrowheads indicate colocalized pre-synaptic (synapsin) and post-synaptic (HOMER1) puncta along neuronal processes (neurofilament (NF)). Scale bar, 25 µm. b, Quantification of data in a (per 10 µm neurofilament length, n = 12 coverslips for neuron baseline and n = 10 coverslips for co-culture, P < 0.0001). c, Representative 500 ms recording of human iPS cell-derived glutamatergic neurons at baseline versus co-cultured with 16T SCLC cells using MEA (n = 6 per condition). d, Representative traces of spike amplitude in human iPS cell-derived glutamatergic neurons at baseline versus co-cultured with 16T SCLC cells. e, Quantification of data in c,d (n = 24 spikes in neuron baseline and n = 168 spikes in co-culture condition, P < 0.0001). f, As in e, but for human H446 SCLC cells (n = 363 spikes in neuron baseline and n = 2,721 spikes in co-culture, P < 0.0001). g, Paradigm for local field recordings in SCLC hippocampal allografts. Created in BioRender. Savchuk, S. (2025) https://BioRender.com/5fwotqm. h, Representative traces of local field potential in response to local stimulation of tumour allografts and control contralateral hippocampus. i, Extracellular local field potential (fEPSP) slope in response to various axonal stimulation intensities in the tumour-infiltrated or control contralateral hippocampus (data fit to a nonlinear regression and compared using the extra-sum-of-squares F-test; n = 24 tumour and n = 25 control across 6 mice, P < 0.0001). j, GSEA of scRNA-seq data from 16T SCLC cells isolated from either monoculture or neuron co-culture (Fig. 2f,g) reveals a distinct cluster that is enriched for astrocyte-related genes. All gene lists in Supplementary Table 1. k, Quantification of ssGSEA scores for astrocyte-related genes across the 16 identified clusters detects upregulation of astrocyte signature in cluster 5 (highlighted in red). Statistical testing in Supplementary Table 2. l, Expression of astrocyte synaptogenesis-related genes in cells isolated from patient lung primary, recurrent or non-brain-metastatic lesions (n = 16) versus patient SCLC brain metastases (n = 12, P < 0.0001). m, Representative immunofluorescence of human H446 SCLC (GFP) xenografted in cortex of mice treated with vehicle or levetiracetam (LEV). Proliferating cells are labelled with Ki67. Scale bars, 50 µm. n, Quantification of data in m (n = 3 vehicle and n = 5 levetiracetam-treated mice, P = 0.0065). o, As in n, but for mouse 16T SCLC cells (n = 6 vehicle and n = 7 levetiracetam-treated mice, P < 0.0001). Data are mean ± s.e.m. (b,i,n,o); violin plot (e,f,k); and violin and box plot (l). Unpaired t-test (b,n,o); Mann–Whitney test (e,f); one-way ANOVA with Tukey correction (k); pairwise Wilcoxon rank sum test (l). All tests are two-tailed. Source data
Extended Data Fig. 1
Extended Data Fig. 1. Denervation in genetic model of spontaneously forming SCLC.
a, Quantification of neurotransmitter receptor gene expression in human samples of primary SCLC (n = 81, for gene list see Supplementary Table 1). b, Visualization of tumor innervation in primary lung tumor samples taken from the genetic mouse model of spontaneously forming SCLC. Streptavidin (SA, green) used to mark airways; proliferative cells are labeled with Ki67 (red) to help identify tumors. Vesicular acetylcholine transporter (VAChT), tyrosine hydroxylase (TH), and myelin basic protein (MBP) (yellow) are used to visualize parasympathetic, sympathetic, and myelinated sensory populations of nerve fibers in left, middle and right image, respectively. Scale bar = 100 µm. c, Visualization of tumor innervation of liver metastasis in murine RPR2-luc model of SCLC. Streptavidin (SA, green) used to mark epithelial cells and help identify airways; proliferative cells are labeled with Ki67 (red) to help identify tumors; MBP (yellow) is used to visualize subpopulation of nerve fibers. Scale bar = 50 µm. d, Body mass surveillance of animals up to 4 weeks following vagotomy or sham procedure (n = 5 animals per group). e, IVIS bioluminescence analysis of overall tumor growth in SCLC primary tumors measured weekly after vagotomy procedure (n = 11 sham and n = 9 vagotomy animals from 2 independent cohorts, n = 0.0041). Data represented as raw values of total flux. Arrowheads demonstrate animal endpoints. f, Quantification of percent of lung occupied by tumor in sham and denervated animals (n = 7 sham, n = 9 vagotomy, p = 0.0430). g, As in f, but for livers (n = 7 sham, n = 9 vagotomy, p = 0.0192). h, Gross image of livers harvested at the endpoint of the experiment from the sham operated (left) and denervated (right) animals. Scale bar = 1 cm. i, Representative immunofluorescence of nerve fibers (VAChT, yellow) around the early lung lesions (marked via Ki67, red) in RPR2-luc animals (left, 2–3 months since Cre administration, n = 4) compared to late-stage tumors (right, 8–9 months since Cre administration, n = 3). Streptavidin (SA, green) used to delineate airways. Scale bar = 100 µm. j, Quantification of data in i demonstrating decrease in innervation in late-stage tumors. k, Time course of tumor growth as measured by IVIS bioluminescence imaging in sham operated (grey) and denervated (vagotomy; red) animals that underwent surgery after initial tumor formation (n = 7 sham and n = 9 vagotomy animals from 2 independent cohorts). l, As in k for onset of liver metastasis as detected by IVIS imaging. m, Kaplan–Meier survival curve for sham operated (grey) and denervated (vagotomy; red) animals that underwent surgery after initial tumor formation (n = 7 sham and n = 9 vagotomy). Data are box plots for a (box defined by 25th percentile, median, and 75th percentile, whiskers extend to min/max, dots represent outliers), median +/- I.Q.R for f,g,j. Analysis with two-way ANOVA for e, two-sided unpaired Mann-Whitney test for f, g, j, Gehan-Breslow-Wilcoxon test for k, Log-rank (Mantel-Cox) test for l, m. All tests are two-tailed. *P < 0.05. Source data
Extended Data Fig. 2
Extended Data Fig. 2. Denervation does not offer survival advantage for MYC-driven SCLC.
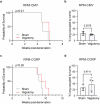
a, Kaplan–Meier survival curve for sham operated (grey) and denervated (vagotomy; red) animals of RPM-CMV-Cre model (n = 3 sham and n = 3 vagotomy). b, Quantification of tumor burden by percent of lung occupied by tumor for animal cohort in a. c, As in a for RPM-CGRP-Cre model animals (n = 4 sham and n = 4 vagotomy). d, Quantification of tumor burden by percent of lung occupied by tumor for animal cohort in c. Data are mean ± s.e.m. for b, d. Analysis with Log-rank (Mantel-Cox) test for a,c, two-sided unpaired t-test for b,d. Source data
Extended Data Fig. 3
Extended Data Fig. 3. Microenvironmental dynamics within intracranial SCLC tumors.
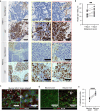
a, Representative neurofilament (top) and Ki67 (bottom) immunohistochemistry of two human samples of SCLC brain metastasis in regions within (red box, zoomed in on right panel) and outside (yellow box, zoomed in on middle panel) 100 µm distance from neurofilament. Scale bar on left = 100 µm; scale bar on middle and right = 50 µm. b, Comparison of local nuclear density as a measure of proliferative history in human SCLC brain metastases for n = 9 patients. Regions are grouped by distance to axons immunostained for neurofilament (less than or greater than 100 µm, p = 0.0044). c, Representative immunofluorescent images of murine SCLC brain allografts (GFP, green) with neurons labeled with MAP2 (red) and NeuN (white). Scale bar = 50 µm (left), 20 µm (right). d, Representative images of proliferation rate (Ki67, red) of murine SCLC allografts (GFP, green) assessed in regions deprived of (left) or enriched for (right) neurons. Scale bar = 50 µm. e, Quantification of data in d, illustrating increased proliferation in neuron-rich compared to neuron-poor areas (n = 6 animals, p < 0.0001). Analysis with two-tailed paired t-test for b, e. ****P < 0.0001, ***P < 0.001, **P < 0.01, *P < 0.05. Source data
Extended Data Fig. 4
Extended Data Fig. 4. Single-cell RNA sequencing of SCLC cells after co-culture with neurons, either with or without addition of tetrodotoxin, reflects distinct subpopulations of cells that cluster separately from SCLC cells in monoculture.
a, Representative immunofluorescence of neuronal populations present in primary neuronal co-cultures demonstrating presence of glutamatergic (VGLUT2, white) and GABA-ergic (GAD65, red) neurons and absence of astrocytes (GFAP, green). Scale bar = 100 µm. Data from 2 independent experiments. b, Quantification of data in a, demonstrating approximately equal proportions of glutamatergic and GABA-ergic neurons. c, Expression of membrane GFP (mGFP) in 16T SCLC cells grown in monoculture or isolated from co-culture with primary murine neurons. d, Composition of the 16 clusters depicted in Fig. 2g as percentage of cells isolated from the monoculture (grey) or co-culture (black) conditions. e, Gene Ontology (GO) enrichment analysis for the top pathways expressed by cells in cluster 14. f, UMAP embedding of single cell RNA-seq profiles of murine 16T SCLC cells isolated from monoculture (grey) or co-culture (black) with primary murine neurons in the presence of 1 µM TTX. 44,562 cells were analyzed from 3 biological replicates. g, Expression of membrane GFP (mGFP) in cells from f. h, Composition of the 18 clusters depicted in Fig. 2k as percentage of cells isolated from the monoculture (grey) or co-culture (black) in the presence of TTX conditions.
Extended Data Fig. 5
Extended Data Fig. 5. Human brain metastatic SCLC contains a subpopulation enriched for neural gene signatures.
a, Integrated UMAP embeddings of all cells from a cohort of n = 12 patients with SCLC brain metastases, colored by their assigned cell-types (left) or patient (right). b, as in a, but of cells from n = 16 patients with lung primary, recurrent, and non-brain-metastatic SCLC lesions (data made publicly available by Chan et al., 2021). c, Spearman correlation of cell programs classifying malignant cells in a, grouped into 6 distinct metaprograms (indicated by boxes within the co-correlation plot). d, as in c, but for malignant cells in b grouped into 9 distinct metaprograms. e, Normalized gene contribution of top defining genes (rows) for each respective metaprogram in the brain-metastatic cohort (columns). Annotated biological functions corresponding to these genes, individual metaprograms, or groups of metaprograms are shown on the right. Metaprogram 3 is defined by genes driving neural-like differentiation. f, Scaled correlation of brain-metastatic cohort metaprograms (columns) with annotated transcriptional hallmarks of tumor heterogeneity derived by Gavish et al. (rows). Metaprogram 3 demonstrates a strong correlation with neural-like hallmarks. g, as in e for the primary, recurrent, and non-brain metastatic cohort. h, as in f for the primary, recurrent, and non-brain metastatic cohort.
Extended Data Fig. 6
Extended Data Fig. 6. Electrical currents in SCLC pathogenesis.
a, Immuno-electron microscopy of H446-GFP SCLC allografted to mouse hippocampus. Black dots represent immunogold particles labeling GFP (tumor cells). Post-synaptic density in GFP+ tumor cells (pseudo-colored green), synaptic cleft, and clustered synaptic vesicles in apposing presynaptic neuron (pseudo-colored blue) identify synapses (white arrowheads). Scale bar = 300 nm. b, Immuno-electron microscopy of 16T-GFP SCLC allografted to mouse hippocampus to demonstrate perisynaptic SCLC connections. Post-synaptic density in GFP-negative neuron (pseudocolored blue), synaptic cleft, and clustered synaptic vesicles in apposing presynaptic neuron identify neuron-to-neuron synapses (black arrowheads). Tumor cells in perisynaptic position are pseudocolored green. Scale bar = 200 μm. c, as in b, but with H446-GFP SCLC cells. Scale bar = 300 μm. d, Quantification of synaptic and perisynaptic neuron-to-tumor connections in murine 16T and human H446 SCLC cells. e, Experimental paradigm for acute slice electrophysiology. GFP + SCLC cells (grey) allografted into the mouse hippocampal CA1 region with CA3 Schaffer collateral afferent stimulation. Created in BioRender. Savchuk, S. (2025) https://BioRender.com/5fwotqm. f, Biocytin-filled (red) SCLC cell allografted to CA1 region of mouse hippocampus. Scale bar = 20 μm. g, Representative recordings of spontaneous currents in allografted SCLC cells at baseline (black) or after addition of 10 µM glutamatergic inhibitors NBQX and CPP (red). h, Cumulative probability density function (CDF) of membrane current of SCLC cells recorded at baseline (n = 8) and after application of glutamate receptor antagonists (n = 15). i, Expression of K+/Cl− co-transporter genes in SCLCs cell lines (n = 4 samples). j, Expression of K+/Cl− co-transporter genes in human samples of primary SCLC (n = 81 patients). Data are plotted as mean ± s.e.m. for d, box-and-whisker plots for i, j, (box defined by 25th percentile, median, and 75th percentile, whiskers extend to min/max, dots represent outliers). Analysis with 2-sided t-test, Wilcoxon rank sum, and Kolmogorov-Smirnov for h. Source data
Extended Data Fig. 7
Extended Data Fig. 7. Human iPSC-derived glutamatergic neurons drive activity-dependent proliferation of multiple SCLC subtypes.
a, Expression of ASCL1 in 16T SCLC cells grown in monoculture or isolated from co-culture with primary murine neurons and processed for single cell RNA sequencing (see Fig. 2f). b, As in a for NEUROD1. c, Quantification of ASCL1 and NEUROD1 in 16T SCLC cells grown in monoculture or neuron co-culture (data from a, b, p < 0.0001). d, Quantification of proliferative index of murine 16T SCLC-A subtype cells co-cultured with human iPSC-derived glutamatergic neurons reveals increased proliferation in co-culture, abrogated by the addition of 1 µM TTX (n = 4 coverslips per condition, p < 0.0001). e, As in d, but human H69 SCLC-A subtype cells were used (n = 3 coverslips per condition, p = 0.0110). f, As in d, but human CORL47 SCLC-A subtype cells were used (n = 3 coverslips per condition, p = 0.0006). g, As in d, but human H446 SCLC-N subtype cells were used (n = 3 coverslips per condition, p = 0.0030). h, As in d, but human SCLC22H SCLC-N subtype cells were used (n = 3 coverslips per condition, p = 0.0002). i, As in d, but human H1048 SCLC-P subtype cells were used (n = 3 coverslips per condition, p = 0.0003). Data are violin plot for c, mean ± s.e.m for d-i. Analysis with Wilcoxon rank sum test for c, 2-way ANOVA for d-i. All tests are two-tailed. ****P < 0.0001, ***P < 0.001, **P < 0.01, *P < 0.05.
Extended Data Fig. 8
Extended Data Fig. 8. Glutamatergic and GABA-ergic signaling drives proliferation of multiple SCLC subtypes via neurotransmitter-mediated signaling pathways.
a, Quantification of proliferative index of human SCLC-A subtype H69 cells co-cultured with human iPSC-derived glutamatergic neurons with or without addition of 50 µM MK801 (inhibitor of NMDA receptor for glutamate) reveals increased proliferation in co-culture abrogated by MK801 (n = 3 coverslips per condition, p = 0.0002). b, As in a, but 50 µM CNQX (inhibitor of AMPA receptor for glutamate) was used (n = 3 coverslips per condition, p = 0.0017). c, As in a, but human SCLC-N subtype H446 cells were used (n = 3 coverslips per condition, p = 0.0005). d, As in a, but human SCLC-P subtype H1048 cells were used (n = 3 coverslips per condition, p = 0.0001). e, Quantification of proliferative index of human SCLC-N subtype H446 cells co-cultured with human iPSC-derived GABA-ergic neurons with or without addition of 1 µM TTX or 20 µM Gabazine (GABA-A receptor inhibitor) reveals increased proliferation in co-culture abrogated by TTX and Gabazine (n = 4–6 coverslips per condition, p < 0.0001). f, As in e, but human SCLC-P subtype H1048 cells were used (n = 3–5 coverslips per condition, p < 0.0001). Data are mean ± s.e.m. Analysis with 2-way ANOVA. ****P < 0.0001, ***P < 0.001, **P < 0.01, *P < 0.05.
Extended Data Fig. 9
Extended Data Fig. 9. Neuron-conditioned media increases proliferation of SCLC, but not to the extent of direct co-culture.
a, Quantification of proliferative index of murine 16T SCLC cells exposed to conditioned media (CM) from or directly co-cultured with iPSC-derived glutamatergic neurons with or without addition of 1 µM TTX (n = 3 coverslips per condition, p < 0.0001). Conditioned media alone renders a partial increase in SCLC proliferation compared to baseline, but not to the full effect of direct co-culture (grey). b, As in a, but human H69 SCLC cells were used (n = 3–5 coverslips per condition, p = 0.0003). c, As in a, but iPSC-derived GABA-ergic neurons were used (n = 3–6 coverslips per condition, p < 0.0001). d, As in c, but human H69 SCLC cells were used (n = 3–4 coverslips per condition, p = 0.0007). e, Quantification of proliferative index of murine 16T SCLC cells exposed to conditioned media (CM) from lung epithelial cells (n = 3 coverslips per condition, p = 0.9010. f, Quantification of proliferative index of murine 16T SCLC cells at baseline or when treated with 100 nM neuroligin 3 (NLGN3) or 100 nM brain derived neurotrophic factor (BDNF). 10% FBS condition is used as positive control (n = 4 coverslips per condition, p = 0.9403 for NLGN3, p = 0.8969 for BDNF). g, As in f but for human H446 SCLC cells (n = 4 coverslips per condition, p = 0.9387 for NLGN3, p = 0.9969 for BDNF). h, Quantification of proliferative index of patient derived glioma cells (SU-DIPGVI) at baseline or treated with 100 nM NLGN3 (n = 4 coverslips per condition, p = 0.0483). i, as in h for glioma cells treated with 100 nM BDNF (n = 4 coverslips per condition, p = 0.0096). Data are mean ± s.e.m. Analysis with one-way ANOVA for a, b, c, d, f, g, two-tailed unpaired t-test e, h, i. ****P < 0.0001, ***P < 0.001, **P < 0.01, *P < 0.05.
Extended Data Fig. 10
Extended Data Fig. 10. Neuronal circuit activity drives invasion of SCLC cells.
a, Immunofluorescent images demonstrating cells expanding beyond the invasive edge of the tumor in SCLC brain allografts (GFP, green) of WT (left) or optogenetically stimulated ChR2 animals (right). Scale bar = 100 µm. b, Immunofluorescent images demonstrating increased tumor area in SCLC brain allografts of WT or ChR2 animals. Scale bar = 150 µm. c, Quantification of data in b, illustrating increased tumor spread from core after optogenetic stimulation (n = 7 WT, n = 8 ChR2 animals, p = 0.0267). Data are mean ± s.e.m for c. Analysis with two-tailed unpaired t-test for c. *P < 0.05. Source data
Extended Data Fig. 11
Extended Data Fig. 11. Membrane depolarization drives SCLC pathogenesis.
a, Representative calcium imaging of GCaMP6s-expressing 16T SCLC cells at baseline (left) and after application of 1 mM GABA. Scale bar = 100 μm. b, Quantification of GCaMP6s fluorescence in individual SCLC cells (from a) in response to administration of 1 mM GABA (n = 44 cells, p < 0.0001). c, As in b, but with administration of 1 mM glutamate (n = 19 cells, p < 0.0001). d, Quantification of the percent of cells exhibiting spontaneous calcium transients as depicted in Fig. 4i in SCLC tumors at baseline or with the addition of 0.5 µM TTX (p = 0.0002). e, Whole-cell patch-clamp voltage trace from ChR2-expressing SCLC cells (16T-ChR2) in response to blue light-induced depolarization. The lower panel represents the timing of blue light delivery. f, as in e, but demonstrating whole-cell patch-clamp current trace from ChR2-expressing SCLC cells (16T-ChR2). g, Quantification of proliferation index of 16T-ChR2 SCLC cells in mock-stimulated tumors or membrane depolarized tumors (n = 5 mock, n = 6 depolarized mice, p = 0.0460). Data are plotted as mean ± s.e.m. for d, g. Analysis with two-tailed paired t-test for b-c, two-tailed unpaired t-test for d, g. ****P < 0.0001, ***P < 0.001, **P < 0.01, *P < 0.05. Source data
Extended Data Fig. 12
Extended Data Fig. 12. Bidirectional neuron-SCLC interactions drive peritumoral hyperexcitability.
a, Quantification of the number of colocalized pre- and post-synaptic inhibitory puncta (quantified via colocalized synapsin-gephyrin staining) on neuronal processes at baseline vs. co-cultured with SCLC cells defined per 10 µm of neurofilament length (n = 10 coverslips in neuron baseline condition, n = 9 coverslips in SCLC co-culture condition). b, Quantification of the number of synapses per number of neurons within the region of murine 16T SCLC hippocampal allografts compared to contralateral normal hippocampi, demonstrating increased synaptic density in the tumor region compared to contralateral control hippocampus. Only regions of abundant (>5% cells) perisynaptic SCLC cells were considered (n = 3 mice, p = 0.0158). c, As in b, but for human H446 SCLC cells (n = 4 mice, p = 0.0037). d, Quantification of spike frequency in iPSC-derived glutamatergic neurons co-cultured with murine 16T SCLC cells (n = 4, p = 0.0296). e, as in d, but with the addition of human H446 SCLC cells (n = 3, p = 0.0005). f, Quantification of spike number and amplitude of iPSC-derived glutamatergic neurons at baseline or with the addition of conditioned media (CM) collected from SCLC cells (n = 91 spikes at baseline, n = 430 spikes in co-culture, n = 236 spikes in CM-treated condition, p < 0.0001). CM-treated neurons exhibit some elevation in spike depth but not to the degree of those recorded from neurons grown in direct co-culture with SCLC cells. g, Quantification of spike number and amplitude of SCLC cultured alone. h, Biocytin (red)-filled pyramidal neuron in the area of the tumor cells in situ. Scale bar = 100 μm. i, Representative current clamp currents and induced action potentials measured in pyramidal neurons in response to varying current injections (−100 pA, black; 100 pA, blue; 200 pA, red). j, Current to voltage relationship of action potentials in neurons from either the allograft (tumor-bearing) hippocampus or control contralateral hippocampus (n = 65 SCLC-associated, 32 control neurons). k, Current to action potential firing frequency relationship in neurons from either the allograft (tumor-bearing) hippocampus or control contralateral hippocampus (n = 65 SCLC-associated, 32 control neurons). l, Table listing cell-intrinsic properties of pyramidal neurons from either the allograft (tumor-bearing) hippocampus or control contralateral hippocampus (n = 65 SCLC-associated, 32 control neurons). m, Expression of astrocyte-related gene signature (Supplementary Table 1) taken from scRNAseq analysis of cells isolated from patient lung primary, recurrent or non-brain-metastatic lesions (n = 16, data made publicly available by Chan et al. 2021) vs. cells from patient SCLC brain metastases (n = 12). n, Representative immunohistochemistry imaging of overall tumor burden in animals allografted with 16 T SCLC cells (green) and treated with vehicle or levetiracetam (LEV). Scale bar = 200 μm. o, Quantification of data in n (n = 6 vehicle, n = 7 levetiracetam, p = 0.0309). p, As in o, but for animals xenografted with human SCLC-N subtype H446 (n = 3 vehicle, n = 5 levetiracetam, p = 0.0472). Data are mean ± s.e.m for a, d, e, o, p, violin plot for f, g, violin and box blot for m (box defined by 25th percentile, median, and 75th percentile, whiskers extend to min/max, dots represent outliers). Analysis with two-tailed unpaired t-test for a, d, e, o, p, two-tailed paired t-test for b, c, Kruskal-Wallis test for f. ****P < 0.0001, ***P < 0.001, **P < 0.01, *P < 0.05. Source data

Update of

References

    1. Venkatesh, H. S. et al. Neuronal activity promotes glioma growth through neuroligin-3 secretion. Cell161, 803–816 (2015). - PMC - PubMed
    1. Venkatesh, H. S. et al. Electrical and synaptic integration of glioma into neural circuits. Nature573, 539–545 (2019). - PMC - PubMed
    1. Venkataramani, V. et al. Glutamatergic synaptic input to glioma cells drives brain tumour progression. Nature573, 532–538 (2019). - PubMed
    1. Magnon, C. et al. Autonomic nerve development contributes to prostate cancer progression. Science341, 1236361 (2013). - PubMed
    1. Renz, B. W. et al. Cholinergic signaling via muscarinic receptors directly and indirectly suppresses pancreatic tumorigenesis and cancer stemness. Cancer Discov.8, 1458–1473 (2018). - PMC - PubMed

MeSH terms

LinkOut - more resources