. 2025 Sep;4(9):1135-1151.
doi: 10.1038/s44161-025-00698-y. Epub 2025 Sep 10.

Heart failure-specific cardiac fibroblasts contribute to cardiac dysfunction via the MYC-CXCL1-CXCR2 axis

Affiliations

Heart failure-specific cardiac fibroblasts contribute to cardiac dysfunction via the MYC-CXCL1-CXCR2 axis

Jin Komuro et al. Nat Cardiovasc Res. 2025 Sep.

Abstract

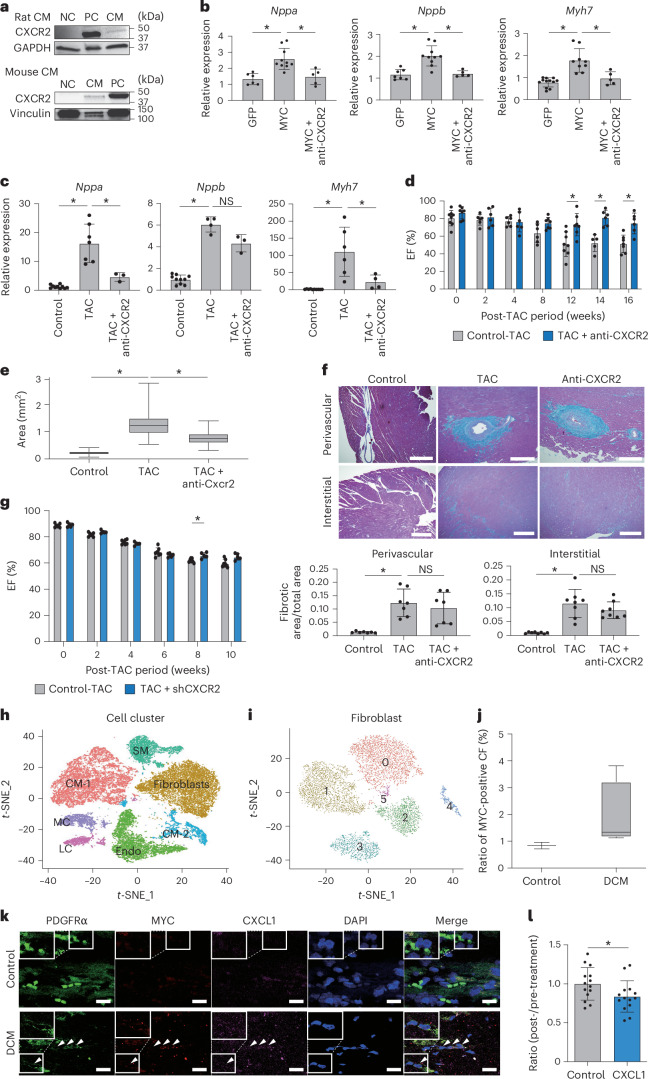
Heart failure (HF) is a growing global health issue. While most studies focus on cardiomyocytes, here we highlight the role of cardiac fibroblasts (CFs) in HF. Single-cell RNA sequencing of mouse hearts under pressure overload identified six CF subclusters, with one specific to the HF stage. This HF-specific CF population highly expresses the transcription factor Myc. Deleting Myc in CFs improves cardiac function without reducing fibrosis. MYC directly regulates the expression of the chemokine CXCL1, which is elevated in HF-specific CFs and downregulated in Myc-deficient CFs. The CXCL1 receptor, CXCR2, is expressed in cardiomyocytes, and blocking the CXCL1-CXCR2 axis mitigates HF. CXCL1 impairs contractility in neonatal rat and human iPSC-derived cardiomyocytes. Human CFs from failing hearts also express MYC and CXCL1, unlike those from controls. These findings reveal that HF-specific CFs contribute to HF via the MYC-CXCL1-CXCR2 pathway, offering a promising therapeutic target beyond cardiomyocytes.


Conflict of interest statement

Competing interests: K.F. is a founding scientist funded by the SAB of Heartseed Co., Ltd. The other authors, J.K., H.H., T. Katsuki, D.K., M. Katoh, T. Ko, M. Ito, M. Katagiri, M. Kubota, S. Yamada, T.N., Y.A., T. Kouka, K.K., M. Kimura, S.I., S.N., I.K., S. Yuasa and M. Ieda, declare no competing interests.

Figures

Fig. 1
Fig. 1. MYC expression in CFs of failing hearts.
a, Experimental scheme using mice exposed to pressure overload. 0, day of TAC; 2 weeks, 2 weeks after TAC; 12 weeks, 12 weeks after TAC. On the day of TAC and 2 weeks and 12 weeks after TAC, non-cardiomyocytes were collected from the heart and scRNA-seq was performed. b, t-SNE visualization of unsupervised clustering of non-cardiomyocytes. Cells (dots) are colored according to the cell clusters and annotated using well-known marker genes. CE, capillary endothelial cell; MΦ, macrophage; SM, smooth muscle cell; AE, arterial endothelial cell; DC, dendritic cell; VE, venous endothelial cell; ME, MKI67 positive endothelial cell; NC, nerve cell; LE, lymphatic endothelial cell; BC, B cell; TC, T cell. c, Feature plot showing fibroblast marker gene expression on t-SNE. d, t-SNE reclassified CFs into six subpopulations according to their gene expression (left, colored according to the cell clusters; right, colored according to the time after TAC). The table shows the cell ratios of six clusters at each time course. e, GO analysis of genes specifically expressed in cluster 4, HF-specific CFs. f, Violin plot showing the expression of Myc and Tcf21 among the six clusters. g, Left: representative cardiac sections stained with azan. Scale bars, 1 mm. Right: representative gross cardiac appearance. h, Flow cytometry analyses of PDGFRα and MYC expression in sham and TAC12w hearts. Negative control, secondary antibody alone in each mouse. i, Immunofluorescence for collagen I and smFISH for MYC in sham and TAC12w hearts. The experiment was repeated independently three times with similar results. Scale bars, 20 μm. j, Western blot analysis of MYC and GAPDH expression in CFs of sham and TAC12w mice. The experiment was repeated independently three times with similar results. Source data
Fig. 2
Fig. 2. MYC overexpression in CFs showed significant deterioration of cardiac function in TAC mice.
a, Experimental scheme for generating cardiac fibroblast-specific MYC-OE mice. 0, day of TAC; 12 weeks, 12 weeks after TAC. b, Western blot analysis of MYC and GAPDH expression in WT control, WT-TAC and OE-TAC mouse hearts. The experiment was repeated independently two times with similar results. c, Echocardiographic assessment of control and OE mice from before (0 week) to 12 weeks after TAC. d, Bar plots show cardiac function evaluated by echocardiography in control and OE mice before and after pressure overload (0–12 weeks). Means and standard errors are shown (TAC0w, control n = 6 and OE n = 5; TAC2w, 5 and 5; TAC4w, 6 and 5; TAC8w, 5 and 5; TAC12w, 4 and 5). Tcf21 iCre–R26StopFLMYC mice were used as control. *P < 0.05; P = 0.0014 (TAC12w); significance was determined using the two-sided Holm–Sidak test for mean comparisons. e, Relative mRNA expression of HF markers measured using RT-qPCR. Data are shown as mean ± s.d. *P < 0.05; P = 0.024 (control (n = 6) versus WT-TAC (n = 3), Nppa), P = 0.036 (WT-TAC versus OE-TAC (n = 5), Nppa), P = 0.0095 (control (n = 6) versus WT-TAC (n = 4), Nppb), P = 0.029 (WT-TAC versus OE-TAC (n = 4), Nppb), P = 0.49 (control (n = 4) versus WT-TAC (n = 4), Myh7), P = 0.029 (WT-TAC versus OE-TAC (n = 4), Myh7); significance was determined using the two-sided Mann–Whitney test for mean comparisons. f, Comparison of cardiomyocyte sizes among control, WT-TAC and OE-TAC mice. Cell size was evaluated using WGA staining. Scale bars, 50 μm. Representative histological data and quantitative analyses of the cell size in each mouse are shown (n = 100 cells each). The box plots show the median (center line) and first and third quartiles (box edges), while the whiskers go from each quartile to the minimum or maximum. *P < 0.05; P < 0.001 (control versus WT-TAC), P = 0.001 (WT-TAC versus OE-TAC); significance was determined using the two-sided Mann–Whitney test for mean comparisons. g, Comparison of fibrotic areas among the control, WT-TAC and OE-TAC mice. Fibrosis was evaluated in the perivascular and interstitial regions via azan staining. Scale bars, 300 μm. Representative histological data and quantitative analyses of the fibrotic areas in each mouse are shown (n = 5 each). Data are shown as mean ± s.d. *P < 0.05; NS, not significant; P = 0.0079 (control versus WT-TAC, perivascular), P = 0.016 (WT-TAC versus OE-TAC, perivascular), P = 0.0079 (control versus WT-TAC, interstitial), P = 1.0 (WT-TAC versus OE-TAC, interstitial); significance was determined using the two-sided Mann–Whitney test for mean comparisons. Source data
Fig. 3
Fig. 3. MYC deletion in CFs ameliorates TAC-induced cardiac dysfunction.
a, Experimental scheme for generating cardiac-fibroblast-specific Myc KO mice. 0, day of TAC; 12 weeks, 12 weeks after TAC. b, Relative mRNA expression of Myc in the heart as measured via RT-qPCR. Data are shown as mean ± s.d. *P < 0.05; P < 0.001 (control (n = 10) versus WT-TAC (n = 7)), P = 0.13 (control versus KO-TAC (n = 11)); significance was determined using the two-sided Mann–Whitney test for mean comparisons. c, Representative images of the echocardiographic assessment of control and KO mice before and after TAC (20 weeks). d, The bar plots show cardiac function evaluated by echocardiography in control and KO mice before and after pressure overload (0–20 weeks). Data are shown as mean ± s.e. (TAC0w, control n = 5 and KO n = 6; TAC2w, 4 and 6; TAC4w, 5 and 6; TAC8w, 4 and 6; TAC12w, 4 and 5; TAC14w, 4 and 5; TAC16w, 4 and 5; TAC20W, 3 and 4). Tcf21 iCre-MYC flox mice were used for control. *P < 0.05; P = 0.018 (TAC8w), P = 0.018 (TAC12w), P = 0.007 (TAC14w), P = 0.018 (TAC16w), P < 0.001 (TAC20w); significance was determined using the two-sided Holm–Sidak test for mean comparisons. e, Relative mRNA expression of HF markers measured using RT-qPCR (n = 4 each). Data are shown as mean ± s.d. *P < 0.05; P = 0.029 (control versus WT-TAC, Nppa), P = 0.029 (WT-TAC versus KO-TAC, Nppa), P = 0.029 (control versus WT-TAC, Nppb), P = 0.029 (WT-TAC versus KO-TAC, Nppb), P = 0.029 (control versus WT-TAC, Myh7), P = 0.029 (WT-TAC versus KO-TAC, Myh7); significance was determined using the two-sided Mann–Whitney test for mean comparisons. f, The size of cardiomyocytes in control, WT-TAC and KO-TAC mice was evaluated using WGA staining. Quantitative analyses of the cell size in each mouse are shown (n = 100 cells each). The box plots show the median (center line) and first and third quartiles (box edges), while the whiskers go from each quartile to the minimum or maximum. *P < 0.05; P < 0.001 (control versus WT-TAC), P < 0.001 (WT-TAC versus KO-TAC); significance was determined using the two-sided Mann–Whitney test for mean comparisons. g, Fibrotic areas in the control, WT-TAC and KO-TAC mice were evaluated at the perivascular and interstitial regions via azan staining. Scale bars, 300 μm. Representative histological data and quantitative analyses of the fibrotic areas in each mouse are shown (n = 5 each). Data are shown as mean ± s.d. *P < 0.05; P = 0.0079 (control versus WT-TAC, perivascular), P = 0.84 (WT-TAC versus KO-TAC, perivascular), P = 0.0079 (control versus WT-TAC, interstitial), P = 0.69 (WT-TAC versus KO-TAC, interstitial); significance was determined using the two-sided Mann–Whitney test for mean comparisons. h, Kaplan–Meier survival curves for control and KO mice after TAC were compared using log-rank tests (n = 11 (control) and 10 (KO)). Source data
Fig. 4
Fig. 4. Comparison of cardiac gene expressions of control, WT-TAC and KO-TAC mice.
a, Principal component analysis (PCA) visualization showing global gene expression in WT control, WT-TAC and KO-TAC mice (n = 3 each). b, Heat map showing the expression levels of differentially expressed genes in WT control, WT-TAC and KO-TAC mice. Left: differentially expressed genes in WT and WT-TAC mice. Right: differentially expressed genes between the WT-TAC and KO-TAC mice. c, GO analysis of differentially expressed genes. Genes were upregulated in WT-TAC mice compared with those in WT control mice. The red bars indicate GO terms associated with genes expressed in cardiomyocytes. The white bars represent other GO terms not specifically related to cardiomyocyte-expressed genes. d, GO analysis of differentially expressed genes. Genes were downregulated in KO-TAC mice compared with those in WT-TAC mice. The red bars indicate GO terms associated with genes expressed in cardiomyocytes. The white bars represent other GO terms not specifically related to cardiomyocyte-expressed genes. e, Top: GSEA of genes associated with MYC targets. Plots were prepared using the HALLMARK_MYC_TARGETS_V1 dataset (containing genes regulated by MYC) from the Molecular Signatures Database. Bottom: GSEA of genes associated with the cardiac hypertrophy pathway. P values were derived from one-sided permutation tests with FDR correction. f, GSEA of genes associated with fibrosis. Genes associated with fibrosis were upregulated in WT-TAC mice compared with those in WT control mice. P values were derived from one-sided permutation tests with FDR correction. g, GSEA of genes associated with fibrosis. Genes associated with fibrosis were not significantly different between the KO and WT-TAC mice. P values were derived from one-sided permutation tests with FDR correction. Source data
Fig. 5
Fig. 5. MYC-induced secreted factors in CFs upregulate HF marker genes in cardiomyocytes.
a, Experimental setup. Culture medium conditioned by MYC overexpression in CFs using a retroviral vector was transferred to cultured neonatal rat cardiomyocytes (CM). b, Relative mRNA expression of HF markers in cardiomyocytes cultured in medium conditioned by MYC or GFP overexpression in CF. Data are shown as mean ± s.d. *P < 0.05; P = 0.036 (Nppa, GFP n = 3, MYC n = 5), P = 0.024 (Nppb, GFP n = 3, MYC n = 6), P = 0.024 (Myh7, GFP n = 3, MYC n = 6); significance was determined using the two-sided Mann–Whitney test for mean comparisons. c, Venn diagram of genes upregulated in WT-TAC mice versus WT control mice, downregulated in KO-TAC mice versus WT-TAC mice in RNA-seq data and upregulated in HF-specific CFs (cluster 4) versus other cluster 1–3 CFs in scRNA-seq data. A total of 21 common genes are listed. d, Top: genome browser view showing Cxcl1 gene expression in WT control, WT-TAC and KO-TAC mice. Bottom: relative mRNA expression of CXCL1 as measured by RT-qPCR (n = 4 each). Data are shown as mean ± s.d. *P < 0.05; P = 0.029 (control versus TAC), P = 0.029 (TAC versus KO); significance was determined using the two-sided Mann–Whitney test for mean comparisons. e, ChIP-qPCR showing MYC binding to the CXCL1 promoter region in CFs (n = 3 each). IgG, nonspecific IgG control; MYC, anti-MYC antibody. The red arrows indicate the region of the E-box in the CXCL1 promoter sequence, and the black arrows indicate primer positions in the Cxcl1 gene. Data are shown as mean ± s.d. *P < 0.05; P = 0.029 (IgG n = 4, MYC n = 3); significance was determined using the one-sided Mann–Whitney test for mean comparisons. f, Relative mRNA expression of HF markers determined by RT-qPCR after CXCL1 stimulation. Data are shown as mean ± s.d. *P < 0.05; P = 0.024 (Nppa, control n = 6, CXCL1 n = 3), P = 0.024 (Nppb, control n = 6, CXCL1 n = 3); significance was determined using the two-sided Mann–Whitney test for mean comparisons. g, Cardiomyocyte size in the control and CXCL1-stimulated conditions. Quantitative analyses of cell size are shown (n = 50 each, P < 0.001). Box plots show the median (center line) and first and third quartiles (box edges), while the whiskers go from each quartile to the minimum or maximum. *P < 0.05; significance was determined using the two-sided Mann–Whitney test for mean comparisons. h, Bar plots showing the effect of CXCL1 on the contractile properties of cardiomyocytes of neonatal rats. Contractile properties were analyzed using the SI8000 Cell Motion Imager. Each parameter was normalized by the value of the control well (n = 10 each, P < 0.001). Data are shown as mean ± s.d. *P < 0.05; significance was determined using the two-sided Mann–Whitney test for mean comparisons. Source data
Fig. 6
Fig. 6. MYC–CXCL1–CXCR2 signaling contributes to HF pathogenesis.
a, Western blot analysis of CXCR2 expression in the negative control (NC), positive control (PC) and CM. Top: the NC is mouse embryonic fibroblasts, the PC is a human embryonic kidney cell line transfected with a Cxcr2 expression vector and the CM are cardiomyocytes of neonatal rats. Bottom: the NC is undifferentiated P19CL6 (mouse embryonic carcinoma) cells, the PC is a human embryonic kidney cell line transfected with a Cxcr2 expression vector and the CM are cardiomyocytes of mice. The experiment was repeated independently three times with similar results. b, Relative mRNA expression of HF markers in cardiomyocytes after addition of the medium conditioned by MYC overexpression in CFs, with and without a neutralizing antibody against CXCR2 (n = 3 each). Data are shown as mean ± s.d. *P < 0.05; P < 0.001 (GFP (n = 6) versus MYC (n = 10), Nppa), P = 0.0027 (MYC versus MYC plus anti-CXCR2 (n = 5), Nppa), P < 0.001 (GFP (n = 7) versus MYC (n = 10), Nppb), P = 0.0027 (MYC versus MYC plus anti-CXCR2 (n = 5), Nppb), P < 0.001 (GFP (n = 12) versus MYC (n = 9), Myh7), P = 0.0040 (MYC versus MYC plus anti-CXCR2 (n = 5), Myh7); significance was determined using the two-sided Mann–Whitney test for mean comparisons. c, Relative mRNA expression of HF markers measured by RT-qPCR in the hearts of control, TAC and TAC with neutralizing antibody against CXCR2. Data are shown as mean ± s.d. *P < 0.05; P < 0.001 (control (n = 10) versus TAC (n = 7), Nppa), P = 0.017 (TAC versus TAC plus anti-CXCR2 (n = 3), Nppa), P = 0.0020 (control (n = 10) versus TAC (n = 4), Nppb), P = 0.057 (TAC versus TAC plus anti-CXCR2 (n = 3), Nppb), P < 0.001 (control (n = 10) versus TAC (n = 6), Myh7), P = 0.038 (TAC versus TAC plus anti-CXCR2 (n = 4), Myh7); significance was determined using the two-sided Mann–Whitney test for mean comparisons. d, Bar plots showing cardiac function evaluated by echocardiography in TAC mice with (anti-CXCR2) and without neutralizing antibody against CXCR2 (control). Data are shown as mean ± s.d. (TAC0w, n = 8 (control) and 7 (anti-CXCR2); TAC2w, 6 and 6; TAC4w, 6 and 6; TAC8w, 6 and 7; TAC12w, 8 and 7; TAC14w, 5 and 6; TAC16w, 7 and 6). *P < 0.05; P = 0.036 (TAC12w), P = 0.0037 (TAC14w), P = 0.015 (TAC16w); significance was determined using the two-sided Holm–Sidak test for mean comparisons. e, Comparison of cardiomyocyte size between control and TAC mice with and without neutralizing antibody against CXCR2 (anti-CXCR2). Cell size was evaluated using WGA staining. Quantitative analyses of the cell size in each mouse are shown (n = 100 cells each). Box plots show the median (center line) and first and third quartiles (box edges), while the whiskers go from each quartile to the minimum or maximum. *P < 0.05; P < 0.001 (control versus TAC), P < 0.001 (TAC versus TAC + anti-CXCR2); significance was determined using the two-sided Mann–Whitney test for mean comparisons. f, Comparison of fibrotic areas between control and TAC mice with and without neutralizing antibody against CXCR2. Fibrosis was evaluated in the perivascular and interstitial regions by azan staining. Scale bars, 300 μm. Representative histological data and quantitative analyses of the fibrotic areas in each mouse are shown (n = 7 each). Data are shown as mean ± s.d. *P < 0.05; P < 0.001 (control versus TAC, perivascular), P = 0.54 (TAC versus TAC plus anti-CXCR2, perivascular), P < 0.001 (control versus TAC, interstitial), P = 0.38 (TAC versus TAC plus anti-CXCR2, interstitial); significance was determined using the two-sided Mann–Whitney test for mean comparisons. g, Bar plots showing cardiac function evaluated by echocardiography in control, and shRNA of CXCR2-injected mice (shCXCR2) after TAC. Data are shown as mean ± s.d. (n = 7 (control) and 5 (shCXCR2)). *P < 0.05; P = 0.025 (TAC8w); significance was determined using the two-sided Holm–Sidak test for mean comparisons. h, t-SNE plot of single-cell transcriptomes of human hearts (control: n = 1,673; HF: n = 29,496) (colored by cell clusters). Endo, endothelial cell; SM, smooth muscle cell; MC, myeloid cell; LC, lymphoid cell. i, t-SNE unsupervised clustering of fibroblasts in the human heart colored by cell clusters. j, Cell ratio of MYC-expressing CFs (control: n = 2; dilated cardiomyopathy (DCM): n = 4). Box plots show the median (center line) and first and third quartiles (box edges), while the whiskers go from each quartile to the minimum or maximum. k, Immunofluorescence for PDGFRα and smFISH for MYC and CXCL1 in human control hearts and DCM hearts. Scale bars, 20 μm. The experiment was repeated independently three times with similar results. The arrows indicate the colocalization of the MYC, CXCL1 and PDGFRα in the same cells. l, Bar plots showing the effect of CXCL1 on the contractile properties of iPSCM organoids. The plots show the rate of change of tissue contraction kinetics. Each parameter was normalized by the value of the control well (n = 14 each). Data are shown as mean ± s.d. *P < 0.05; P = 0.047; significance was determined using the two-sided unpaired t-test for mean comparisons. Source data
Extended Data Fig. 1
Extended Data Fig. 1. Single-cell RNA-seq of non-cardiomyocytes in the murine heart.
Related to Fig. 1. a: t-distributed stochastic neighbour embedding (t-SNE) visualisation of unsupervised clustering of non-cardiomyocytes. The cells (dots) are coloured according to the cell clusters, and the numbers represent cluster numbers. b: Non-cardiomyocytes classification based on gene expression using t-SNE. Non-cardiomyocytes were defined as cells expressing each marker gene. Marker genes include Car4 (capillary endothelium), Cd14 (macrophage), Acta2 (smooth muscle cells), Efnb2 (arterial endothelium), Cd80 (dendritic cells), Vwf (vein endothelium), Mki67 (Mki67 positive endothelium), Plp1 (nerves), Mmrn1 (lymphatic endothelium), Cd79a (B cells), and Cd3g (T cells). c: Violin plot depicting HF-Fibro (cluster 4) expression of Postn but not Acta2 or Chad. d: Violin plot showing the expression of transcription factors in six clusters. e: FACS analyses of PDGFRα and MYC expression in sham (TAC0w), TAC4w, TAC6w, and TAC 8w hearts.
Extended Data Fig. 2
Extended Data Fig. 2. Generation of cardiac fibroblast-specific MYC overexpression mice.
Related to Fig. 2. a: Bar plots illustrating left ventricle chamber size and wall thickness by echocardiography in control and OE mice pre- and post-pressure overload (TAC0w, n = 6 [control] and 5 [OE]; TAC2w, 5 and 5; TAC4w, 6 and 5; TAC8w, 5 and 5; TAC12w, 4 and 5). Tcf21 iCre-R26StopFLMYC mice were used as controls. b: Kaplan–Meier survival curves for control and OE mice after TAC were compared using the Gehan-Breslow-Wilcoxon test (n = 10 [control] and 20 [OE]). Source data
Extended Data Fig. 3
Extended Data Fig. 3. Generation of cardiac fibroblast-specific MYC knockout mice.
Related to Fig. 3. a: FACS analyses of MYC-expressed fibroblasts in MYC KO hearts of TAC 12w. Negative control, secondary antibody alone. b: Bar plots showing left ventricle chamber size and wall thickness by echocardiography in control and MYC KO mice pre- and post-pressure overload (TAC0w, n = 5 [control] and 6 [KO]; TAC2w, 4 and 6; TAC4w, 5 and 6; TAC8w, 4 and 6; TAC12w, 4 and 6; TAC14w, 4 and 5; TAC16w, 4 and 5; TAC20w, 3 and 4). Tcf21 iCre-MYC flox mice were used as controls. *, p < 0.05; p = 0.018 (LVDs, TAC20w); significance was determined using the two-sided Holm-Sidak test for mean comparisons. Source data are provided as a Source Data file. Source data
Extended Data Fig. 4
Extended Data Fig. 4. RNA-seq of WT control mice, WT-TAC mice, and KO-TAC mice.
Related to Fig. 4. a: Principal component analysis visualisation (PC1-PC2) showing global gene expression in hearts of WT control, WT-TAC, and KO-TAC mice (n = 3 each). b: Gene ontology (GO) analysis of differentially expressed genes. Left, Genes downregulated in WT-TAC mice vs. WT control mice. Right, Genes upregulated in KO-TAC mice vs. WT-TAC mice. c: GSEA of fibrosis-associated genes, indicating upregulation in WT-TAC mice vs. WT control mice and no significant difference between KO and WT-TAC mice.
Extended Data Fig. 5
Extended Data Fig. 5. Identifying secreted factors, such as CXCL1, as a direct target of MYC.
Related to Fig. 5. a: GO analysis bar graph for 21 candidate genes, revealing Cxcl1 and Tnfsf9 as intercellular signalling molecules. b, Relative mRNA expression of Cxcl1 and Tnfsf9 in CFs overexpressing MYC compared to that in the control (GFP). Data are shown as mean ± SD. *, p < 0.05; p = 0.0079 (CXCL1); significance was determined using the two-sided Mann-Whitney test for mean comparisons. Source data are provided as a Source Data file. c: ChIP-qPCR showing MYC at Cdh1, as a negative control, and Snail1, as a positive control, in MYC-overexpressing CF. IgG, nonspecific IgG control; MYC, anti-MYC antibody. d: Relative mRNA expression of the HF marker Myh7 after stimulation with CXCL1, measured by RT-qPCR. Data are shown as mean ± SD. *, p < 0.05, n.s., not significant; p = 0.26 (Control n = 6, CXCL1 n = 3); significance was determined using the two-sided Mann-Whitney test for mean comparisons. Source data are provided as a Source Data file. Source data
Extended Data Fig. 6
Extended Data Fig. 6. Effect of CXCR2 neutralising antibody and targeted knockdown of CXCL1 in CFs and CXCR2 in cardiomyocytes.
Related to Fig. 6. a: Experimental scheme of TAC mice injected with a neutralising antibody against CXCR2. b: Bar plots showing left ventricle chamber size and wall thickness measured by echocardiography in control and anti-CXCR2 mice after TAC. Mean and standard error are shown (TAC0w, n = 8 [control] and 7 [anti-CXCR2]; TAC2w, 6 and 6; TAC4w, 6 and 6; TAC8w, 6 and 7; TAC12w, 8 and 7; TAC14w, 5 and 6; TAC16w, 7 and 6). *, p < 0.05; p = 0.040 (LVDs, TAC16w); significance was determined using the two-sided Holm-Sidak test for mean comparisons. Source data are provided as a Source Data file. c: Bar plots showing left ventricle chamber size and wall thickness measured by echocardiography in control and shCXCR2 mice after TAC. Mean and standard error are shown (n = 6 [control] and 5 [shCXCR2] for TAC0w, TAC2w, TAC4w, TAC6w, TAC8w, and TAC10w). *, p < 0.05; p = 0.015 (LVDd, TAC10w), p = 0.0020 (LVDs, TAC10w); significance was determined using the two-sided Holm-Sidak test for mean comparisons. Source data are provided as a Source Data file. d: Bar plots showing cardiac function, left ventricle chamber size, and wall thickness measured by echocardiography in control and shRNA of Cxcx1 injected mice (shCXCL1) after TAC. Mean and standard error are shown (n = 7 [control] and 5 [shCXCL1] for TAC0w, TAC2w, TAC4w, TAC6w, TAC8w, and TAC10w). *, p < 0.05; p = 0.0064 (LVDd, TAC10w); significance was determined using the two-sided Holm-Sidak test for mean comparisons. Source data are provided as a Source Data file. e: Left panel, Western blot analysis of p-ERK, ERK, and GAPDH expression in cardiomyocytes from neonatal rats treated with CXCL1 alone or in combination with the anti-CXCR2 antibody. Representative data are shown. Right panel, quantification of Western blot optical densities, with p-ERK/ERK ratios displayed. *, p < 0.05; significance was determined using the two-sided Mann-Whitney test for mean comparisons. Source data are provided as a Source Data file. Source data
Extended Data Fig. 7
Extended Data Fig. 7. Single-nucleus RNA-seq analysis of patients with HF.
Related to Fig. 6. a: t-distributed stochastic neighbour embedding (tSNE) plot of human heart single-cell transcriptomes. The cells (dots) are coloured according to the cell clusters, and the numbers represent cluster numbers. b: Classification of whole heart cells based on gene expression using tSNE dimensionality reduction, identifying marker genes for cardiomyocytes, cardiac fibroblasts, endothelial cells, smooth muscle cells, myeloid cells, and lymphoid cells. c: tSNE plot of human heart single-cell transcriptomes. The cells (dots) are coloured according to the patient type. d: Feature plot displaying MYC expression on t-SNE of all cells in human heart. e: Violin plot showing the expression of MYC of all cells in human heart. f: t-SNE unsupervised clustering of fibroblasts in the human heart coloured by patient type. g: Gene Ontology analysis of differentially expressed genes. Genes were upregulated in human DCM CFs compared with those in human control CFs. h: Gene Ontology analysis of differentially expressed genes. Genes were downregulated in human DCM CFs compared with those in human control CFs. i: Feature plot visualising expression of MYC on t-SNE of fibroblasts. j: Violin plot showing the expression of MYC and CXCL1 in the six clusters. Source data
Extended Data Fig. 8
Extended Data Fig. 8. Expressions of MYC and CXCL1 in patients with HF and the effect of CXCL1 on human cardiomyocytes.
Related to Fig. 6. a: Immunofluorescence for PDGFRα and single-molecule fluorescence in situ hybridization for MYC and CXCL1 in human dilated phase HCM (dHCM) and sarcoidosis hearts. Scale bars, 20 μm. Arrows indicate the colocalization of the MYC, CXCL1, and PDGFRα in the same cells. b: CXCR2 expression data using single-cell RNA-seq from our previous report. Horizontal axis, TNNT2 expression; vertical axis, CXCR2 expression. Black squares, cardiomyocytes from human control hearts; blue triangles, cardiomyocytes from human hearts of dilated cardiomyopathy. c: Western blot analysis of CXCR2 and GAPDH expression in iPSCM. d: Relative mRNA expression of HF markers in iPSCM (n = 3–5 each). Data are shown as mean ± SD. *, p < 0.05; p = 0.029 (Nppa), p = 0.036 (Nppb); significance was determined using the two-sided Mann-Whitney test for mean comparisons. Source data are provided as a Source Data file. Source data
Extended Data Fig. 9
Extended Data Fig. 9. CXCR2 neutralising antibody suppresses TAC-induced increase in cardiac immune cells.
FACS analyses of CD3, CD11b, and Ly6G expression in mice hearts of sham (TAC0w), TAC4w, TAC8w, TAC12w, and TAC 12w with neutralising antibody against CXCR2.

References

    1. Braunwald, E. The war against heart failure: the Lancet lecture. Lancet385, 812–824 (2015). - PubMed
    1. Kho, C., Lee, A. & Hajjar, R. J. Altered sarcoplasmic reticulum calcium cycling—targets for heart failure therapy. Nat. Rev. Cardiol.9, 717–733 (2012). - PMC - PubMed
    1. Mudd, J. O. & Kass, D. A. Tackling heart failure in the twenty-first century. Nature451, 919–928 (2008). - PubMed
    1. Williams, R. S. Apoptosis and heart failure. N. Engl. J. Med.341, 759–760 (1999). - PubMed
    1. Higo, T. et al. DNA single-strand break-induced DNA damage response causes heart failure. Nat. Commun.8, 15104 (2017). - PMC - PubMed

MeSH terms