. 2025 Sep 10;11(1):170.
doi: 10.1038/s41522-025-00783-x.

ABO blood group antigens influence host-microbe interactions and risk of early spontaneous preterm birth

Affiliations

ABO blood group antigens influence host-microbe interactions and risk of early spontaneous preterm birth

Katherine E Mountain et al. NPJ Biofilms Microbiomes. .

Abstract

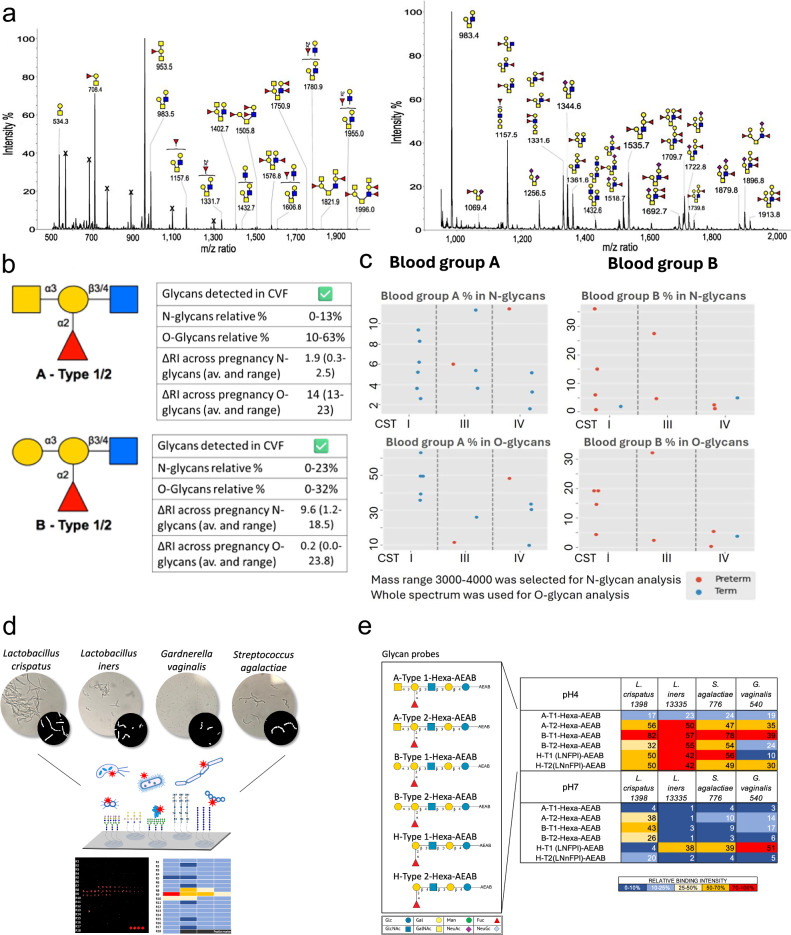
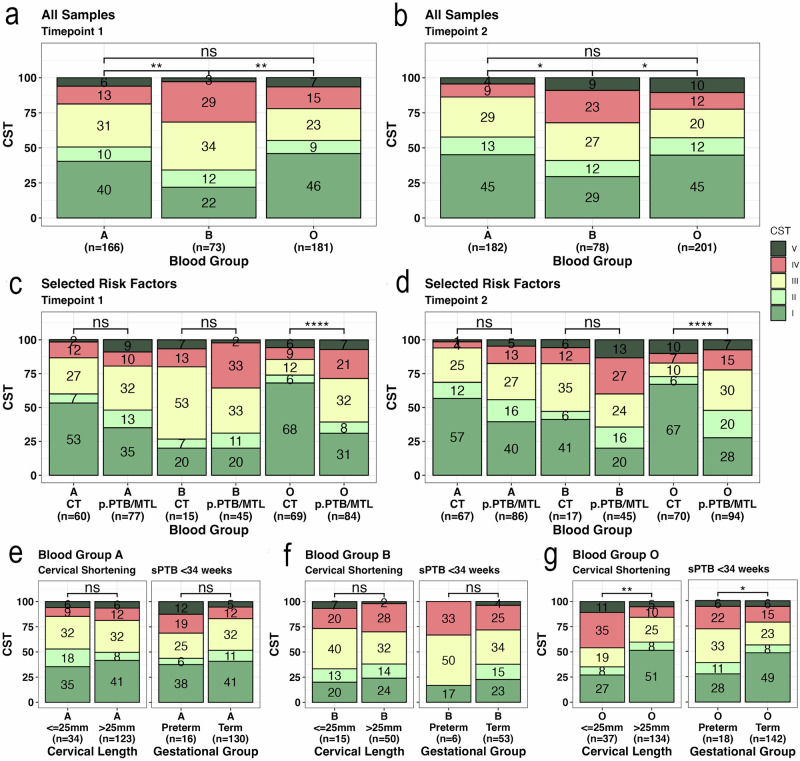
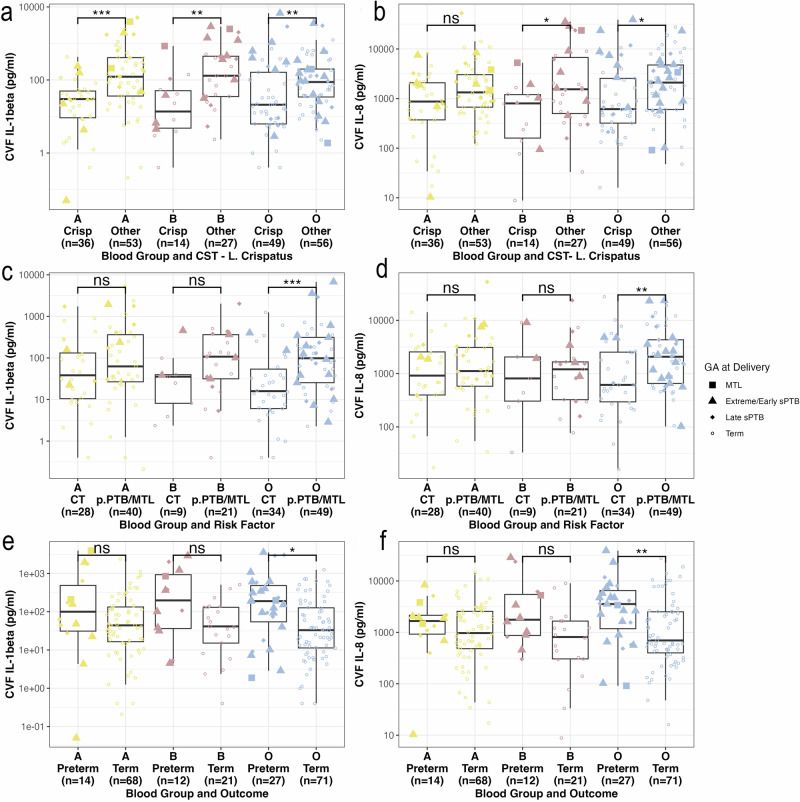
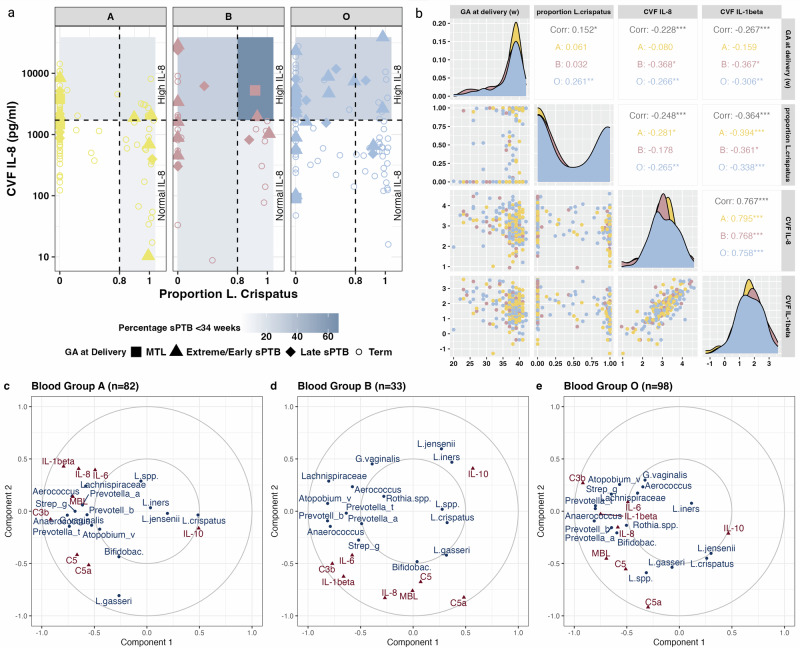
The mechanisms by which vaginal microbiota shape spontaneous preterm birth (sPTB) risk remain poorly defined. Using electronic clinical records data from 74,913 maternities in conjunction with metaxanomic (n = 596) and immune profiling (n = 314) data, we show that the B blood group phenotype associates with increased risk of sPTB and adverse vaginal microbiota composition. The O blood group associates with sPTB in women who have a combination of a previous history of sPTB, an adverse vaginal microbial composition and pro-inflammatory cervicovaginal milieu. In contrast, women of blood group A have a higher prevalence of vaginal Lactobacillus crispatus, a lower risk of sPTB, with sPTB cases showing no association with vaginal microbiota composition or inflammation. We found that cervicovaginal fluid contains ABH(O) glycans and shows variable binding to key vaginal bacteria. This indicates that cervicovaginal ABH(O) glycans influence microbiota-host interactions implicated in sPTB risk, suggesting a novel target for sPTB prediction and prevention.


Conflict of interest statement

Competing interests: The authors declare no competing interests.

Figures

Fig. 1
Fig. 1. Summary of study design and study population.
a Schematic representing study design: The iCARE study population included maternities identified via electronic healthcare records representing general population and the Prematurity Research study population included maternities with a pre-defined risk factor for spontaneous preterm birth (sPTB), a proportion of whom provided samples for vaginal microbial composition, cervicovaginal (CVF) immune mediators and CVF glycan profiles. b Pregnancy outcomes and ABO blood group status were analysed from a general obstetric population (iCARE population) across three inner London Hospitals between April 2014 and x 2023 (85,044 maternities). c Pregnancy outcomes and ABO blood group status were analysed from the Prematurity Research cohort of women defined as at risk of sPTB and/or who participated in the multi-centre VMET-2 study at four inner London hospitals, and Edinburgh (n = 2084).
Fig. 2
Fig. 2. Pregnancy outcomes according to ABO blood group.
In the iCARE cohort of 74,913 maternities with pregnancy outcomes, the rates of spontaneous preterm birth by ABO group are shown for (a) sPTB < 37 weeks (b) <34 weeks and (c) <28 weeks. No relationship between ABO blood group and iatrogenic preterm birth is seen (d) <37 weeks (e) < 34 weeks and (f) <28 weeks. g Adjusted odds model for sPTB < 37 weeks generated from logistic regression modelling (n = 74,913). Outcome was adjusted for blood group, ethnicity, past pregnancy history and history of previous cervical treatment. There was no improvement to the model with the addition of interaction terms between co-variates. h In women with a pre-defined risk factor, sPTB rates are increased in women with blood group B and O phenotype (n = 1886. all-risk factors), (i) and in blood group B with previous cervical treatment n = 724), j but in women with a history of previous sPTB and MTL an increased risk is seen in women of blood group O phenotype (n = 798). N.B. Previous PTB/MTL population excludes those with concurrent uterine anomaly or previous cervical treatment. Comparisons made using Chi-squared test and adjusted for multiple comparisons. P value significance: *<0.05, **<0.01, ***<0.001, ****<0.0001. Adjusted OR ± 95% CI and p value.
Fig. 3
Fig. 3. ABO blood group glycans at the cervicovaginal interface and interaction with common vaginal microbiota.
a Representative MALDI-TOF mass spectrum of O-glycans released from CVF of an A blood group and B blood group donors. Assignments are based on composition, tandem MS and knowledge of biosynthetic pathways. All molecular ions are [M+Na]+. b Semi-quantitative analyses of whole spectrum show higher percentages of A and B blood group epitopes expressed on O-glycans than on N-glycans. n = 64. c The highest abundance of the A blood group antigen on glycans isolated from CVF is detected in association with CST-I and term delivery, whereas the presence of the B antigen, which is lower in abundance, is seen across all CSTs, and is predominantly seen in women who have a preterm delivery. Mass range 3000-4000 for N-glycan analysis, whole spectrum for O-glycan analysis. n = 46. d A schema of glycan microarrays constructed to detect glycan binding with fluorescently labelled in-house cultured bacterial isolates of species and strains. e Heatmap showing the relative binding intensities to blood group glycan probes at pH4 and pH7 of fluorescently labelled bacteria. Differential binding of commensals and pathobionts is seen depending on ABH backbone and pH. The average rank of mean fluorescence intensities of quadruplicate spots from three binding assays was calculated and the resulting values coloured as follows: Dark blue (0-10%); Light blue (10-25%); Yellow (25-50%); Orange (50-70%); Red (70-100%). 100%, the maximum binding score observed across pH4 and pH7 for a given strain.
Fig. 4
Fig. 4. Vaginal Microbiome Community State Types (CSTs) according to blood group in women at risk of preterm birth.
a Proportions of CST I-V in women defined as being at risk of preterm birth by ABO blood group phenotype at timepoint 1 (12+0–15+6), b and at timepoint 2 (20+0–23+6). c Proportions of CST1-V in women categorised by risk factors of previous cervical treatment (CT) or previous preterm birth of mid-trimester loss (pPTB/ MTL) and by ABO blood group phenotype at timepoint 1 (12+0–15+6) and at (d) timepoint 2 (20+0-23+6). Proportions of CST I-V at timepoint 1 (12 + 0-15 + 6) in women categorised by outcomes of cervical length and pregnancy outcome in women with blood group (e) A, (f) B and (g) O. Comparisons made using Chi-squared and adjusted for multiple comparisons. P value significance: *<0.05, **<0.01, ***<0.001, ****<0.0001.
Fig. 5
Fig. 5. Cervicovaginal Fluid (CVF) cytokine concentrations by ABO blood group phenotype at timepoint 2 (20 + 0-23 + 6).
a CVF IL-1β (pg/ml) and community state type (CST) (n = 219). b CVF IL-8 (pg/ml) and CST (n = 219). c CVF IL-8 (pg/ml) and risk factor (n = 180). d CVF IL-8 (pg/ml) and risk factor (n = 180). e CVF IL-1β (pg/ml) and sPTB (iPTB excluded) (n = 202). f CVF IL-8(pg/ml) and sPTB (iPTB excluded) (n = 202). Wilcoxon Signed-Rank Test adjusted for multiple comparisons (p < 0.05*, p < 0.01**, p < 0.001***, p < 0.0001****).
Fig. 6
Fig. 6. Associations between cervicovaginal immune mediators, vaginal microbiota and ABO blood group at timepoint 2 (20 + 0-23 + 6).
a CVF IL-8 – classified as normal or high (according to tertile) by ABO blood group and Lactobacillus Crispatus dominance (defined as 80% relative abundance) with the shading in each quadrant indicating the percentage of sPTB <34 weeks gestational age at is shown in. b Correlation plots for gestational age at delivery, Lactobacillus crispatus proportion, CVF IL-8 and IL-1β concentrations for blood groups A (yellow), B (red) and O (blue) are shown in. (c-e), Canonical Correlation Analysis between 20 dominant bacterial taxa across samples (shown in blue) and CVF immune analytes (shown in red). Objects that are close together are correlated with each other. Distance from the centre represents strength of association. c Blood group A (n = 82). d blood group B (n = 33). e Blood Group O (n = 98). List of 20 dominant taxa: Lactobacillus crispatus, Lactobacillus iners, Gardnerella vaginalis, Lactobacillus gasseri, Lactobacillus jensenii, Bifidobacterium, Atopobium vaginae, Streptococcus, Lactobacillus spp., Prevotella timonensis, Aerococcus, Lachnospiraceae, Prevotella bivia, Prevotella amnii, Anaerococcus, Rothia, Finegoldia, Peptoniphilus, Atopobium rimae, Fusobacterium.

References

    1. Ohuma, E. O. et al. National, regional, and global estimates of preterm birth in 2020, with trends from 2010: a systematic analysis. Lancet402, 1261–1271 (2023). - PubMed
    1. Perin, J. et al. Global, regional, and national causes of under-5 mortality in 2000-19: an updated systematic analysis with implications for the Sustainable Development Goals. Lancet Child Adolesc. Health6, 106–115 (2022). - PMC - PubMed
    1. Goldenberg, R. L., Culhane, J. F., Iams, J. D. & Romero, R. Epidemiology and causes of preterm birth. Lancet371, 75–84 (2008). - PMC - PubMed
    1. Huang, C. et al. Meta-analysis reveals the vaginal microbiome is a better predictor of earlier than later preterm birth. BMC Biol.21, 199 (2023). - PMC - PubMed
    1. Manuck, T. A. et al. Preterm neonatal morbidity and mortality by gestational age: a contemporary cohort. Am. J. Obstet. Gynecol.215, 103 e1– e14 (2016). - PMC - PubMed

LinkOut - more resources