. 2025 Sep;57(9):2226-2237.
doi: 10.1038/s41588-025-02307-x. Epub 2025 Sep 10.

DNA methylation cooperates with genomic alterations during non-small cell lung cancer evolution

Collaborators, Affiliations

DNA methylation cooperates with genomic alterations during non-small cell lung cancer evolution

Francisco Gimeno-Valiente et al. Nat Genet. 2025 Sep.

Abstract

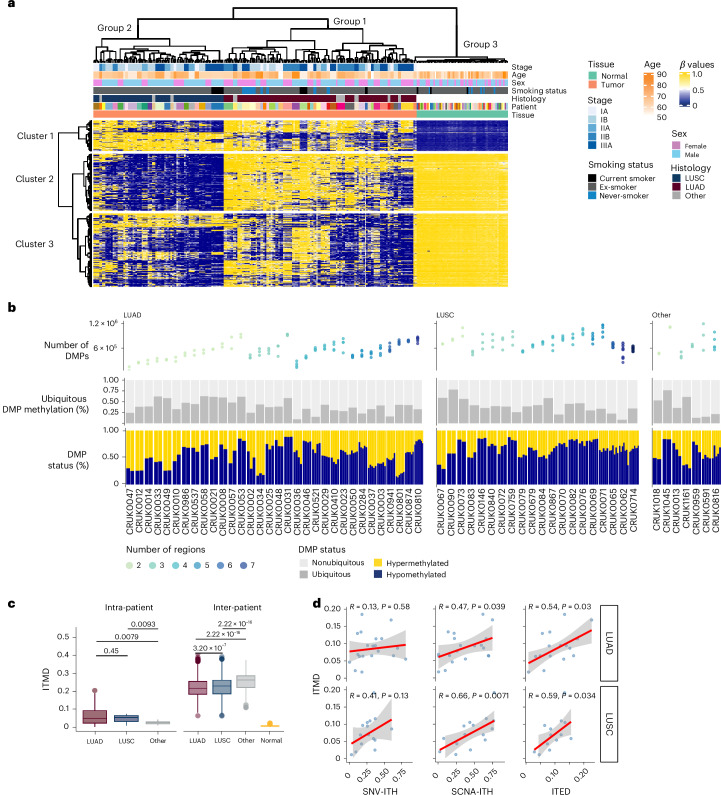
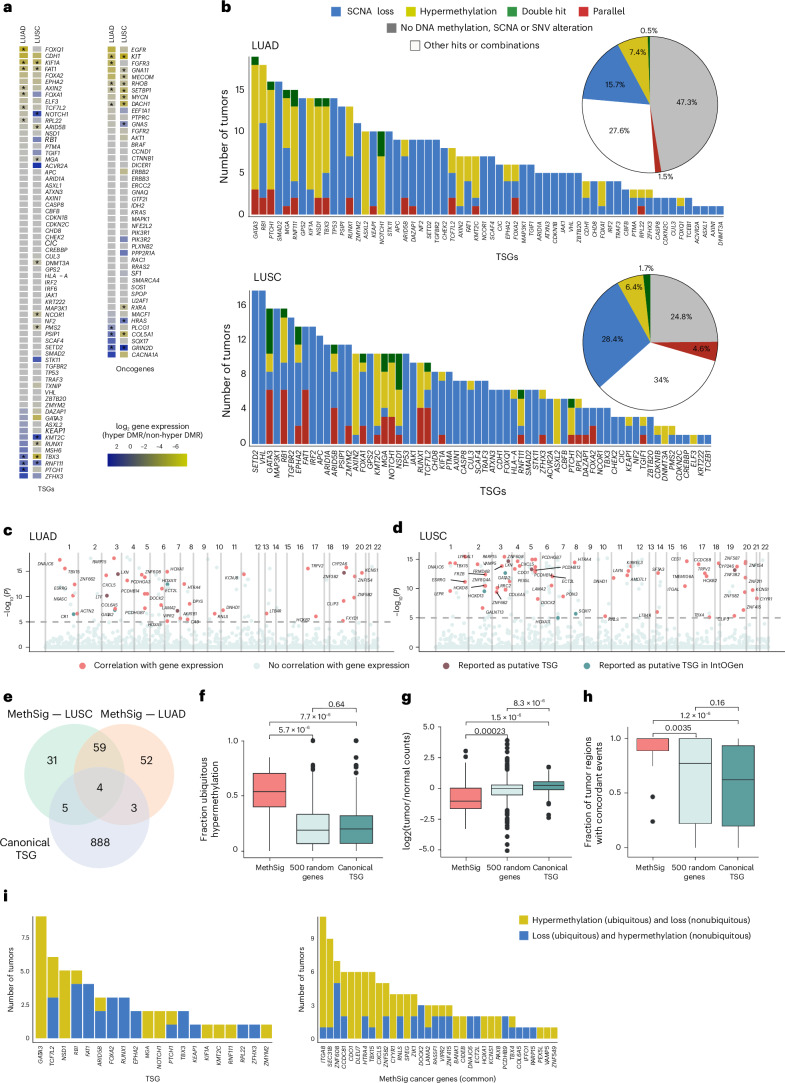
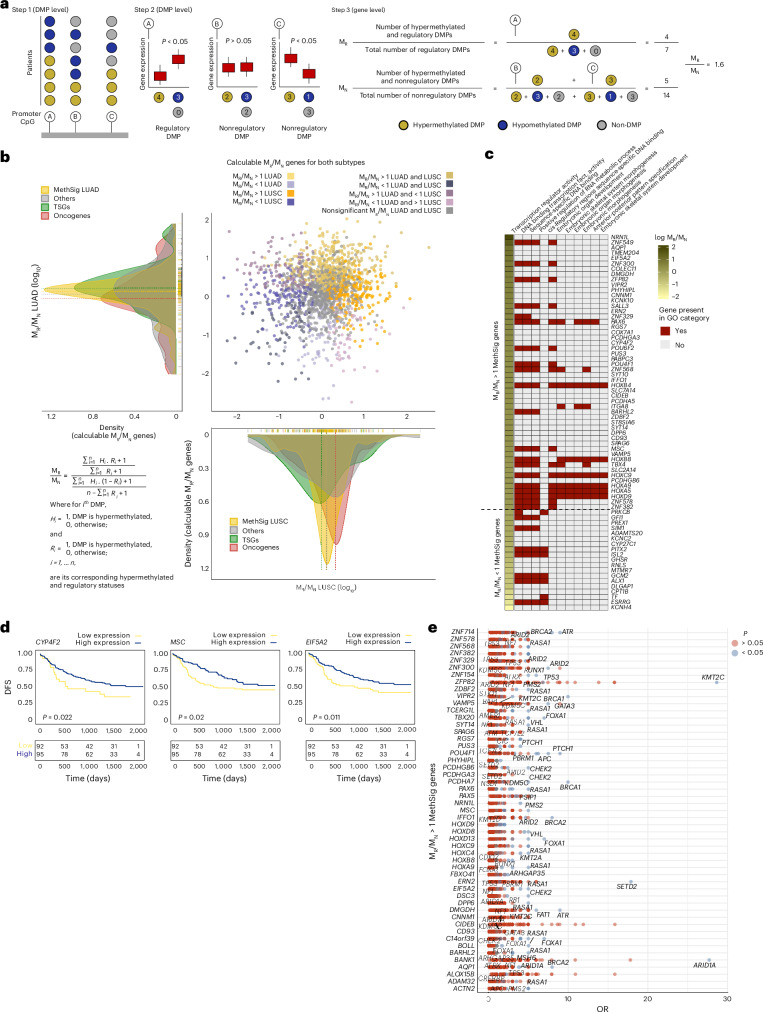
Aberrant DNA methylation has been described in nearly all human cancers, yet its interplay with genomic alterations during tumor evolution is poorly understood. To explore this, we performed reduced representation bisulfite sequencing on 217 tumor and matched normal regions from 59 patients with non-small cell lung cancer from the TRACERx study to deconvolve tumor methylation. We developed two metrics for integrative evolutionary analysis with DNA and RNA sequencing data. Intratumoral methylation distance quantifies intratumor DNA methylation heterogeneity. MR/MN classifies genes based on the rate of hypermethylation at regulatory (MR) versus nonregulatory (MN) CpGs to identify driver genes exhibiting recurrent functional hypermethylation. We identified DNA methylation-linked dosage compensation of essential genes co-amplified with neighboring oncogenes. We propose two complementary mechanisms that converge for copy number alteration-affected chromatin to undergo the epigenetic equivalent of an allosteric activity transition. Hypermethylated driver genes under positive selection may open avenues for therapeutic stratification of patients.


Conflict of interest statement

Competing interests: E.L.C. is currently employed by and holds shares in Achilles Therapeutics. N.K. acknowledges grant support from AstraZeneca. C.S. acknowledges grants from AstraZeneca, Boehringer Ingelheim, Bristol Myers Squibb, Pfizer, Roche-Ventana, Invitae (previously Archer Dx, a collaboration in minimal residual disease sequencing technologies), Ono Pharmaceutical and Personalis. He is Chief Investigator for the AZ MeRmaiD 1 and 2 clinical trials and is the Steering Committee Chair. He is also Co-Chief Investigator of the NHS Galleri trial funded by GRAIL and a paid member of GRAIL’s Scientific Advisory Board (SAB). He receives consultant fees from Achilles Therapeutics (he is also a SAB member), Bicycle Therapeutics (he is also a SAB member), Genentech, Medicxi, the China Innovation Centre of Roche, formerly the Roche Innovation Centre, Metabomed (until July 2022) and the Sarah Cannon Research Institute. C.S. has received honoraria from Amgen, AstraZeneca, Bristol Myers Squibb, GlaxoSmithKline, Illumina, MSD, Novartis, Pfizer and Roche-Ventana. C.S. has previously held stock options in Apogen Biotechnologies and GRAIL, and currently has stock options in Epic Bioscience and Bicycle Therapeutics, and has stock options and is co-founder of Achilles Therapeutics. C.S. declares a patent application (no. PCT/US2017/028013) for methods to lung cancer; for targeting neoantigens (no. PCT/EP2016/059401); for identifying patent response to immune checkpoint blockade (no. PCT/EP2016/071471); for determining HLA LOH (no. PCT/GB2018/052004); for predicting the survival rates of patients with cancer (no. PCT/GB2020/050221); for identifying patients who respond to cancer treatment (no. PCT/GB2018/051912); and for methods for lung cancer detection (no. US20190106751A1). C.S. is an inventor on a European patent application (no. PCT/GB2017/053289) relating to assay technology to detect tumor recurrence. This patent has been licensed to a commercial entity; under their terms of employment, C.S. is due a revenue share of any revenue generated from such license(s). J.D. has consulted for AvH. M.J.-H. has received funding from CRUK, the National Institutes of Health National Cancer Institute, the International Association for the Study of Lung Cancer, the Lung Cancer Research Foundation, the Rosetrees Trust, the UK and Ireland Neuroendocrine Tumour Society and the NIHR. M.J.-H. has consulted for, and is a member of, the Achilles Therapeutics SAB and Steering Committee, has received speaker honoraria from Pfizer, Astex Pharmaceuticals, the Oslo Cancer Cluster and Bristol Myers Squibb, and is listed as a co-inventor on a European patent application relating to methods to detect lung cancer (no. PCT/US2017/028013). This patent has been licensed to commercial entities and, under the terms of employment, M.J.-H. is due a share of any revenue generated from such license(s). A.M.F. is a co-inventor on a patent application to determine methods and systems for tumor monitoring (no. PCT/EP2022/077987). S.V. is a co-inventor on a patent of methods for detecting molecules in a sample (no. 10578620). The other authors declare no competing interests.

Figures

Fig. 1
Fig. 1. Global DNA methylation landscape in the TRACERx lung cancer study.
a, Unsupervised hierarchical clustering of the 5,000 most variable CpGs in 217 tumor regions from 59 patients and 59 matched NAT samples. Yellow, hypermethylated CpGs; blue, hypomethylated CpGs. Groups correspond to patient samples and clusters correspond to CpGs. b, The number of DMPs, the percentage of ubiquitous DMPs (fraction of regions in which the DMP is present) and the methylation status of the DMPs are illustrated, indicating the degree of ITH. Samples are stratified according to histological subtypes and arranged in ascending order from left to right based on the number of regions sampled. c, ITMD metric calculated across regions within (intra) and between (inter) tumors. The box plot shows the median, interquartile range (IQR) (Q1–Q3), whiskers extending to 1.5 times the IQR and outliers beyond this range (Wilcoxon rank-sum test). d, Correlations between ITMD score and other heterogeneity metrics; mutation (SNV-ITH), SCNA-ITH and ITED, depicted from left to right, for LUAD (top) and LUSC (bottom). The fitted line represents a smoothed trend estimated using a robust linear regression, with the shaded region indicating the 95% confidence interval.
Fig. 2
Fig. 2. Analysis of the impact of DNA methylation on driver gene expression.
a, Impact of promoter DMR status on gene expression for genomic TSGs (left) and oncogenes (right) for LUAD and LUSC separately. Negative values indicate decreased expression in samples where the gene promoter is hypermethylated (yellow); positive values indicate increased expression when the gene promoter is hypermethylated (blue). *P < 0.05 (t-test). b, Number of LUAD and LUSC tumors with CN loss (blue) or promoter hypermethylation (yellow) in genomic TSGs. Parallel events are defined as promoter hypermethylation and CN loss occurring in different regions of the same tumor (red). Double-hit events are defined as tumors exhibiting promoter hypermethylation and CN loss in the same region (green). Other combinations of events, including CN gains, mutations or promoter hypomethylation and combinations thereof (white), are shown. The pie chart summarizes the percentage of each type of event for all genomic TSGs. c,d, Manhattan plots illustrating the top MethSig cancer genes in LUAD (c) and LUSC tumors (d). P = 0.05 is indicated by the dashed horizontal line. e, Venn diagram showing the overlap between MethSig cancer genes and canonical genomic TSGs. f, Using multi-region DNA methylation data, the fraction of ubiquitous DNA hypermethylation of all MethSig cancer genes, the random set of genes and canonical TSGs, are reported (t-test). g, Relationship between the expression in tumor versus normal tissue for the MethSig cancer genes, for the random set of genes and for canonical TSGs (t-test). h, Percentage of regions exhibiting concordant alterations for both DNA hypermethylation and SCNAs in MethSig cancer genes, in the random set of genes and in canonical TSGs. Concordant events include DNA hypermethylation and CN loss, or hypomethylation with CN gain and amplification (t-test). The box plot shows the median, IQR (Q1–Q3), the whiskers extending to 1.5 times the IQR and outliers beyond this range. i, Number of tumors with ubiquitous/nonubiquitous DNA hypermethylation and CN loss events in MethSig cancer genes and canonical TSGs, used to determine the relative timing of the co-occurrence of these alterations in NSCLC.
Fig. 3
Fig. 3. Divergent interplay between DNA methylation and CN alterations.
a, Difference in median promoter methylation for genes when amplified versus when not amplified (y axis). A value greater than 0.2 indicates increased DNA methylation when amplified. The x axis indicates the ratio of gene expression between amplified versus non-amplified regions. Positive values indicate gene expression scales with CN amplification. Genes highlighted yellow are potentially under DNA-methylation-dependent dosage compensation, as their methylation, but not their expression, scales with CN. Genes with expression levels that scale with CN but do not scale with DNA methylation are highlighted red. b, Hallmarks in cancer functional enrichment of genes potentially under DNA-methylation-dependent dosage compensation. The bar lengths represent the P value; the proportion of overlap between the subset of genes (k) and the gene sets defining the hallmarks (K) are indicated by a red dot. c, Gene promoter methylation difference between samples with and without amplification located within 20 Mb of amplified oncogenes with expression levels that scale with CN, which are labeled red (HUGO Gene Nomenclature Committee name). Essential genes extracted from the Achilles project dataset are labeled yellow (HUGO Gene Nomenclature Committee name). d, Schematic illustrating the potential cooperation between CN alterations and DNA methylation around oncogenes. CN changes at the oncogene locus could trigger a focal AllChAT, affecting co-amplified essential and passenger genes. e, Validation of AllChAT on the gene pair TMTC1 as a passenger of the amplified oncogene KRAS, in primary cell cultures derived from patient tumors CRUK0977 and CRUK0577, and from a non-tumor-tissue-derived primary cell culture from patient CRUK0667. The CN for each locus is indicated numerically. The repressive histone mark H3K27me3 to identify closed chromatin (red), and the active histone mark H3K4me3 to identify open chromatin H3K4me3 (green), were extracted from the Integrative Genomics Viewer and illustrated using BioRender. The intensity of both histone marks was normalized according to the CN. Assessment of DNA methylation status in the promoter region of each gene was performed using the non-tumor PDC as a control for the two tumor PDCs.
Fig. 4
Fig. 4. Identification of cancer-related disruption events by applying MR/MN to MethSig.
a, Schematic of the development of the MR/MN metric. (1) The DMP status is assigned for each CpG in the gene promoter across the cohort. (2) Each DMP is characterized as regulatory or nonregulatory based on whether hypermethylation of the CpG reduces gene expression of the cognate gene across the cohort. (3) MR and MN values for each gene are calculated based on the aggregated DNA methylation status of regulatory and nonregulatory CpGs in each gene promoter across the entire cohort. b, log–log scatter plot displaying the common calculable MR/MN ratios for each gene in LUAD (y axis) and LUSC (x axis). On the density plot, subtype-specific calculable MR/MN ratios according to genes are indicated. The formula for determining the MR/MN ratio for each gene is illustrated in the lower left corner. The colors in the log–log scatter plot represent the direction of deviation of MR/MN from 1 for each subtype and its significance. c, Functional enrichment analysis with Gene Ontology (GO) terms for MethSig genes with MR/MN > 1 (top) and MR/MN < 1 (bottom). d, Kaplan–Meier curves based on the expression of the MethSig cancer genes with an MR/MN > 1 (CYP4F2, MSC and EIF5A2) associated with worse DFS in the TRACERx cohort (multivariate Cox analysis). e, Odds ratio (OR) highlighting the co-occurrence of promoter DNA hypermethylation events for MR/MN > 1 MethSig cancer genes and driver mutations in canonical TSGs in LUAD. Significant co-occurrences are labeled.
Extended Data Fig. 1
Extended Data Fig. 1. Global DNA methylation landscape in the TRACERx lung cancer study.
a) Unsupervised hierarchical clustering of the 5,000 most variable CpGs in the bulk DNA methylation data. Yellow, hypermethylated CpGs, blue, hypomethylated CpGs. Groups correspond to patient samples and clusters correspond to CpGs. b) Genomic features representation of the 5,000 most variable CpGs identified using CAMDAC in the three clusters and in the background of CpGs in RRBS capture regions c) Methylation rate of CpGs in Clusters 1, 2 and 3, corresponding to promoter regions of genes in tumor and normal, classified by subtype from left to right: LUAD, LUSC, and other subtypes. Wilcoxon test, P < 0.001 (***), P < 0.01 (**), P < 0.05 (*). d) Correlation between the number of differentially methylated positions (DMPs) and the number of reads per chromosomal copy (NRPCC), purity, ploidy, median CpG coverage in the tumor and normal samples and median β-value. Median mt and mn coverage correspond to the number of reads per CpG in the CAMDAC-deconvolved and normal data respectively (Pearson’s correlation test). The fitted line represents a smoothed trend estimated using a robust linear regression (RLM), with the shaded region indicating the 95% confidence interval. e) Proportion of ubiquitous DMPs with respect to the number of regions sampled (ANOVA test). f) Relationship between ITMD value and the number of regions sampled (ANOVA test). The boxplot shows the median, interquartile range (Q1–Q3), whiskers extending to 1.5×IQR, and outliers beyond this range. g) Correlation between the standard deviation (SD) of purities across regions from the same patient tumor versus CAMDAC-based methylomes (left) and nondeconvolved bulk methylomes (right) ITMD (Pearson’s correlation test). The fitted line represents a smoothed trend estimated using a robust linear regression (RLM), with the shaded region indicating the 95% confidence interval. h) Relationship between ITMD value and the genomic feature annotation. ANOVA test, P < 0.001 (***). The boxplot shows the median, interquartile range (Q1–Q3), whiskers extending to 1.5×IQR, and outliers beyond this range.
Extended Data Fig. 2
Extended Data Fig. 2. Analysis and characterization of cells of origin for LUAD and LUSC compared to normal adjacent tissue.
a) Principal component analysis based on known transcriptomic signatures of cells-of-origin for LUAD (AT2) and LUSC (BSC). Freshly isolated populations were obtained via flow cytometry from five normal-adjacent tissue samples from the TRACERx cohort. b) Correlation of the β-values of a random set of 1 million CpGs (minimum coverage of 10 reads) between the panel of normal (PON) from the FACS sorted cells-of-origin (y axis) and the PON from NAT (x axis). AT2 PON versus NAT PON (LUAD, left) and BSC PON versus NAT PON (LUSC, right). Color scale (count) corresponds to the number of CpGs with overlapping methylation rates in both PONs.
Extended Data Fig. 3
Extended Data Fig. 3. Convergent DNA methylation and genomic alterations in drivers.
a) Impact of SCNA loss status on gene expression for genomic TSGs (left) and oncogenes (right) for LUAD and LUSC separately. Negative values indicate decreased expression in tumors where the gene is lost by SCNA, positive values indicate increased expression in tumors where the gene is lost by SCNA, P < 0.05 (*) (t-test). b) Number of tumors with alterations based on SCNA loss (blue) or promoter hypermethylation (yellow) in genomic oncogenes. Parallel events, defined as hypermethylation and copy number loss occurring in different regions of the same tumor (red). Double hit events, defined as tumors exhibiting promoter hypermethylation and somatic copy number loss in the same region (green); other combinations of events, such as somatic copy number gains, mutations or promoter hypomethylation events and combinations thereof (white). Pie chart, summarising the percentage of each event for all genomic oncogenes.
Extended Data Fig. 4
Extended Data Fig. 4. Heatmap of gene expression by copy loss and/or DNA methylation.
TSG expression in samples with at least 2 tumor regions per category in LUAD (left) and LUSC (right). * indicates significance of the expression decrease relative to samples with no hypermethylation or copy number loss observed based on RRBS and WES analyses using a linear mixed model analysis. The colour scale (Z-score) is standardised by rows to allow comparisons within the same gene, with 0 being the mean value.
Extended Data Fig. 5
Extended Data Fig. 5. Identification of candidate DNA methylation cancer genes using MethSig.
a) Application of CAMDAC principles to PDR. Bulk PDR (PDRb) can be described as a combination of the tumor PDR (PDRt) and normal PDR (PDRn) weighted by the copy number and purity. b and c) Normal and CAMDAC PDRs correlated with PDRs estimated from WT (WT-LOH PDR) and mutated reads (SNV-LOH PDR) respectively in regions with loss of heterozygosity (LOH) phased to SNVs. d) Correlation between PDR estimated from purified diploid cell populations from five tumor samples experimentally separated using FACS (Methods) vs. matched normal adjacent tissue (NAT). e) Plots showing the median PDR per tumor for bulk (PDRb), CAMDAC tumor (PDRt) and normal (PDRn) data. In concordance with CAMDAC principles, CAMDAC PDR (PDRt) levels are usually higher than the PDRb when the PDRn from adjacent tissue is lower than the PDRb. f) and g) Q-Q plot showing top significant MethSig cancer genes in LUAD and LUSC respectively. h and i) Top enriched Reactome pathways in LUAD and LUSC respectively.
Extended Data Fig. 6
Extended Data Fig. 6. Divergent interplay between DNA methylation status and genomic alterations in genomic driver genes.
a) Number of concordant and discordant combinations of copy number, DNA methylation, and inactivating mutations impacting canonical TSGs in LUAD and LUSC. Double hits are defined as the combination of more than two types of concordant events identified within the same tumor region. Parallel events refer to concordant events identified in different regions of the same tumor. b) Differential expression analysis of essential genes comparing tumor regions with both hypomethylated DMRs and SCNA loss versus tumor regions with SCNA loss alone in LUAD and LUSC (t-test).
Extended Data Fig. 7
Extended Data Fig. 7. Divergent interplay between DNA methylation and copy number in amplified regions in LUAD and LUSC separately.
a) Difference in median promoter DNA methylation (y axis) versus log2-fold change in median expression for genes when amplified versus when not amplified (x axis). Genes highlighted in yellow are potentially under DNA methylation-dependent dosage compensation. Genes with expression levels that scale with copy number and do not scale with DNA hypermethylation are highlighted in red; LUSC (left); LUAD (right). b) GO terms highlighting the enriched pathways for genes under DNA methylation-dependent dosage compensation in LUSC (left) and in LUAD (right). c, d) DNA methylation-associated dosage compensation of genes co-amplified within 20 Mb of oncogenes in c) LUSC and d) LUAD. Genes with a DNA methylation difference > 0.2 when amplified versus non-amplified are labelled in yellow. Genes with expression levels that scale with copy number and do not scale with DNA hypermethylation are highlighted in red.
Extended Data Fig. 8
Extended Data Fig. 8. Implementation of MR/MN to stratify genes under DNA methylation-dependent regulatory selection.
a) Linear regression between the logarithm of the number of promoter CpGs and the MR/MN ratio per gene in LUAD and LUSC (95% confidence intervals are indicated in grey). b) Gene expression ratio between the tumor and the normal adjacent tissue (NAT) for the top 1000 genes with highest MR/MN and bottom 1000 MR/MN in the LUAD TRACERx RRBS cohort and the LUAD TCGA cohort. c) Gene expression ratio between the tumor and the NAT for the top 1000 genes with highest MR/MN and bottom 1000 MR/MN in the LUSC TRACERx RRBS cohort and the LUSC TCGA cohort (t-test). d) Mean value ± SEM of MR/MN of known essential genes extracted from the Achilles dataset project versus the mean value ± SEM of MR/MN from a random iteration of selected genes (t-test). e) Validation of the promoter CpG assignments (regulatory and non-regulatory) using an additional 17 regions from 10 LUAD from the TRACERx cohort as an independent validation cohort using CpGs significantly assigned as regulatory (left boxplot), and significantly non-regulatory (right boxplot) in the discovery cohort (t-test). f) Confusion matrix showing the percentages of CpGs selected in panel ‘e’ in both the discovery and validation cohorts that are associated with reduced gene expression (or not) when hypermethylated versus when non hypermethylated. For the validation cohort, ‘reduced’ CpGs have been assigned when the expression ratio between when the CpG is hypermethylated versus when it is not is less than 0.5, while ‘Not reduced’ has been considered when the ratio is greater than 1.5. Significance has been evaluated using a chi-squared test. g) Validation of the MR/MN metric by comparing the value of MR/MN in the discovery vs the validation cohort (Correlation coefficient calculated using the Spearman method, 95% confidence intervals are indicated in grey).

References

    1. Sung, H. et al. Global Cancer Statistics 2020: GLOBOCAN estimates of incidence and mortality worldwide for 36 cancers in 185 countries. CA Cancer J. Clin.71, 209–249 (2021). - PubMed
    1. Frankell, A. M. et al. The evolution of lung cancer and impact of subclonal selection in TRACERx. Nature616, 525–533 (2023). - PMC - PubMed
    1. Martínez-Ruiz, C. et al. Genomic–transcriptomic evolution in lung cancer and metastasis. Nature616, 543–552 (2023). - PMC - PubMed
    1. Gopal, P. et al. Clonal selection confers distinct evolutionary trajectories in BRAF-driven cancers. Nat. Commun.10, 5143 (2019). - PMC - PubMed
    1. Rosenthal, R. et al. Neoantigen-directed immune escape in lung cancer evolution. Nature567, 479–485 (2019). - PMC - PubMed

MeSH terms