. 2025 Nov;12(42):e04426.
doi: 10.1002/advs.202504426. Epub 2025 Sep 11.

Optimized Monothiol Thioredoxin Derivative (ORP100S) Protects In Vitro and In Vivo from Radiation and Chemotoxicity Without Promoting Tumor Proliferation

Affiliations

Optimized Monothiol Thioredoxin Derivative (ORP100S) Protects In Vitro and In Vivo from Radiation and Chemotoxicity Without Promoting Tumor Proliferation

Jian Wu et al. Adv Sci (Weinh). 2025 Nov.

Abstract

Human thioredoxin-1 (TRX) is a target-selective disulfide reductase with antioxidant, anti-inflammatory, and regulatory functions that mitigates cellular stresses in various organ systems, providing a compelling rationale for therapeutic use as a broad-spectrum cell protectant. However, clinical application of recombinant TRX (rhTRX) is constrained by rapid clearance and proliferative intracellular activity. To overcome these limitations, a rationally designed TRX variant, ORP100S, was engineered for enhanced stability, prolonged extracellular target engagement, and improved protective function, with development of novel single-turnover insulin reduction and hybrid-immunocapture LC-MS assays. ORP100S demonstrates high-yield expression in E. coli (16 g L-1) and exhibits significant in vivo mitigating effects when administered subcutaneously to rodents and non-human primates exposed to otherwise-lethal total-body ionizing radiation. Compared to native TRX, ORP100S displays improved pharmacokinetic and pharmacodynamic properties without promoting murine or human cancer cell proliferation. Additionally, ORP100S protects hematopoietic stem/progenitor cells (HSPCs) from chemotherapy-induced toxicity in vitro and in vivo synergistically with co-administered granulocyte-macrophage colony-stimulating factor (GM-CSF). Mechanistic studies revealed that ORP100S modulates the Kruppel-like factor 4 (KLF4)-p53 pathway to selectively inhibit ferroptosis in HSPCs but not cancer cells. These findings highlight the potential of ORP100S as a novel therapeutic agent for mitigating acute radiation injury and improving the safety and efficacy of chemotherapy without compromising antitumor activity.

Keywords: cell protection; chemoprotection; ferroptosis; hematopoietic stem cells; radiation mitigation; thioredoxin.


Conflict of interest statement

The authors declare no conflict of interest. OrPro Therapeutics and Duke University are applicants for patents relating to monothiol thioredoxin technology (inventors HM, PH, YK).

Figures

Figure 1
Figure 1
Improved properties of monothiol C35S TRX (ORP‐100 and ORP100S) versus rhTRX and thiol reducing agents. A) Codon‐optimized human TRX‐1 with mutation of the active site Cys35 to Ser (C35S TRX; ORP‐100) forms a stable mixed‐disulfide with a Cys thiol of a target protein disulfide when it reacts in the reduced state. Based on rational protein design three additional amino acid modifications were introduced in order to eliminate sites of protein:protein interactions hypothesized to negatively regulate disulfide reductase activity or redox stability (ORP100S). B) Reverse‐phase (RP)‐HPLC traces for heterodimeric human insulin at time 0 (blue) and following 60 min incubation (red) with rhTRX (top) or C35S TRX ORP‐100 (bottom). C) Relative insulin disulfide activity for rhTRX (diamonds) versus ORP‐100 (squares) calculated from change in the insulin heterodimer peak areas from 0 to 60 min determined by RP‐HPLC. D) Attenuation of inflammation in cystic fibrosis (CF) HBECs by ORP‐100. Pro‐inflammatory cytokine TNF‐alpha levels in primary human bronchial epithelial cultures from Normal (blue) and CF patient donors (red) stimulated with isotonic phosphate buffered saline (PBS; solid black bars) or PBS with 100 µm ORP‐100 (solid blue or red bars) or native TRX (hatched blue or red bars). Double arrow denotes significant difference (P < 0.05). E) Percentage of Cys thiols in the deprotonated, active form as a function of pH for thioredoxin/ORP‐100/ORP100S versus classical thiol agents cysteamine, glutathione, Mesna and N‐acetyl cysteine (NAC). Active thiolate fractions were calculated at each pH using the Henderson‐Haselbalch equation and published or experimentally determined (ORP‐100, ORP100S) pKa values. Blue shading: pH range of the normal human airway surface liquid (ASL) layer; pink shading: pH range of the ASL from patients with CF. F) RP‐HPLC traces for insulin reduction following 60 min incubation with either 12.5 mM NAC or 0.025 mM ORP100S (500‐fold lower concentration) at pH 6.0, 7.0, 8.0, and 9.0. Blue traces: time 0; red traces: 60 min. Overlapping red and blue traces indicate lack of reduction activity, e.g. NAC at pH 6.0. G) Relative insulin disulfide activity for ORP100S versus NAC at each pH level is shown in the boxed rectangle at right. *: p < 0.05; **: p < 0.01; ***: p < 0.001.
Figure 2
Figure 2
ORP100S is effective in rescuing EML cells from radiation and exhibits differential effects on EML cells versus cancer cells. A) EML cells, human cord blood CD34+ cells, MM1.R myeloma cells, and MV4‐11 leukemia cells were treated with various concentrations of ORP100S or recombinant human TRX (rhTRX) for 48 h and cell viability (MTT) was measured. Cell viability treated with PBS control buffer was set as 100%. B) EML, MM1.R, and MV4‐11 cell lines were treated with ORP100S or rhTRX in PBS (40 µg mL−1) for 48 h and intracellular ROS (DCF), NAD+/NADPH, and total GSH were measured. C) EML cells, human cord blood CD34+ cells, MM1.R, and MV4‐11 were irradiated (5 Gy) and treated with PBS buffer, ORP100S in PBS (40 µg mL−1) or rhTRX (40 µg mL−1) in PBS for 48 h. Cell viabilities were determined by MTS assay. Cell viability treated with PBS control buffer was set as 100%. D) For p53 transcription assay, the p53 promoter region (−1600 to −100) was cloned into a pGL3 firefly/renilla luciferase (Luc) reporter system and transduced into EML cells and human cord blood CD34+ cells. Relative Luc activity (Luc; fold change) was calculated from the ratio of p53‐pGL3 Luc activity after normalization to renilla. E) Protein lysates from samples as described in C were subjected to western blotting using the indicated antibodies. *: p < 0.05, **: p < 0.01; ***: p < 0.001.
Figure 3
Figure 3
ORP100S is effective in rescuing EML and human CD34+ cells from chemotoxicity and exhibits differential effects on EML versus cancer cells. A) EML, MM1.R, and MV4‐11 cell lines were treated with 5‐FU (25 µm, upper panel) or cisplatin (1 µm, lower panel) with/without ORP100S or rhTRX (40 µg mL−1) for 48 h. Cell counts were determined by Trypan blue dye. Data represent the mean ± SD of three experiments. Cell number at baseline before treatment was normalized as 1. B) EML, human CD34+ HPSCs, MM1.R, and MV4‐11 cells were treated with 5‐FU (25 µm, upper panel) or cisplatin (1 µm, lower panel) with/without ORP100S or rhTRX (40 µg mL−1) for 48 hr. Cell viability was measured by MTT assay. Data represent mean ± SD of three experiments. Cell viability at baseline before treatment was set as 100%. C) EML cells (left panel) and MM1.R cells (right panel) were treated with 5‐FU (25 µM) or cisplatin (1 µM) with/without ORP100S or rhTRX (40 µg mL−1) for 48 h. Cells were lysed to obtain total protein of each group. Protein lysates were subjected to western blot analysis with indicated antibodies. *: p < 0.05, **: p,0.01; ***: p < 0.001.
Figure 4
Figure 4
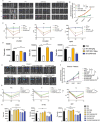
ORP100S mitigates radiation injury in mice and in cynomolgus macaques. A) C57Bl/6 mice were exposed to gamma TBI (9.5 Gy, TB) and 24 h later were administered PBS buffer or ORP100S in PBS (320 µg, IV, every other day for five doses) and survival was measured. n = 10 mice per treatment group, 5 males and 5 females. B) C57BL/6 mice received 8.45 Gy TBI and 24 h later were administered PBS buffer or ORP100S (32, 64, 128 or 320 µg, IV, 128 µg, SC) in PBS every other day for five doses. n = 10 mice per treatment group, 5 male and 5 females. C) C57BL/6 mice received 8.5 Gy TBI and were administered PBS or ORP100S in PBS (64 or 128 µg at 24 h post‐exposure QOD for five doses; 128 µg given at 24 h once; or 128 µg given at 72 h QOD for five doses). n = 10 mice per treatment group, 5 males and 5 females. Mice were monitored twice daily for weight loss and clinical symptoms and were euthanized upon reaching the humane endpoints. Overall survival was calculated from Kaplan‐Meier curves and log‐rank analysis performed from the first day of ORP100S injection until death or reaching humane endpoint. D) Female cynomolgus macaques were irradiated (single‐fraction whole body 4 Gy dose) using 6 MV X‐rays at a dose rate of 0.69 Gy min−1 with a Varian 2100 EX dual energy linear accelerator. Twenty‐four hours later, animals were given PBS (n = 2), ORP100S (14.2 mg m−2, equivalent to 128 µg per mouse, n = 3), or ORP100S (7.1 mg m−2, equivalent to 64 µg per mouse, n = 3) SC every other day for a total of 5 doses. Some non‐human primates had to be euthanized due to uncontrolled menses, reaching humane endpoints. These animals were humanely euthanized not due to classical hematopoietic syndrome failure but due to this unexpected issue. We treated these cases as censored data points in Kaplan‐Meier survival curves. Survival following was evaluated using Kaplan‐Meier curves and log‐rank analysis from the first day of ORP100S injection until death or reaching humane endpoints. E) Blood samples were collected before radiation, at day 1, 3, 5, 7, 9, 16, 23, 30, 37, 44, 51, and 58 post radiation. White blood cell count (WBC), hemoglobin (Hb), red blood cell count (RBC), platelets (PLT), neutrophils, lymphocytes, and monocytes were measured by cell counter. F) Cytokines and chemokines from blood samples taken at the indicated time points were measured by Thermo Fisher ProcartaPlex™ NHP 37‐plex cytokine/chemokine/growth factor panel (cat. no. EPX370‐40045‐901). The data shown are the ratios of levels between low dose/PBS‐treated and high dose/PBS‐treated. *: p < 0.05, **: p < 0.01; ***: p < 0.001.
Figure 5
Figure 5
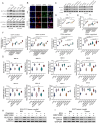
ORP100S protects hematopoietic stem cells from chemotherapy induced injury and is additive/synergistic with GM‐CSF. A–D) C57Bl/6 mice were implanted with luciferase‐expressing EG7 cells (1 × 106 cells per animal), and once tumors were established, mice were treated with 5‐FU (IP, 50 mg kg−1, one dose) followed by PBS vehicle or ORP100S (128 µg, SC every other day for five doses). (A) Tumor volume was monitored weekly by bioluminescence. Bioluminescence intensity of individual animals from week one to week three in four groups of mice, ie., PBS (CTL), 5‐FU, ORP100S, or the combination (5‐FU and ORP100S), was measured (10 mice per group). B) Bioluminescence activity was quantified by determining the total flux (photons/sec) in each mouse from week one to week three. C) Peripheral blood was collected weekly for the measurement of white blood cell count (WBC), hemoglobin (HB) and platelet (PLT). D) Experiments were terminated at two weeks post 5‐FU injection and mice were sacrificed. Total numbers of bone marrow long‐term (LT)‐HSPC (Lin‐Scal+C‐Kit+CD150+CD48‐), short‐term (ST)‐HSPC (Lin‐Scal+C‐Kit+CD150‐CD48‐), and multi‐potential progenitor cells (MPP) (Lin‐Scal+C‐Kit+CD150‐CD48+) were measured. E–H) C57Bl/6 mice were implanted with luciferase‐expressing EG7 cells and treated subsequently with PBS or 5‐FU IP (50 mg kg−1, one dose). The mice were then given PBS control buffer, ORP100S (128 µg, SC every other day for five doses total), GM‐CSF (2 µg, SC, daily for five d), or a combination of ORP100S and GM‐CSF. Tumor volume was quantified weekly by measuring bioluminescence intensity and peripheral blood was drawn for hematological analysis. Mice were sacrificed at two weeks post 5‐FU injection. E) Bioluminescence imaging of tumor burden at week three for C57BL/6 mice implanted with EG7 tumor cells and treated as described (eight groups). F) Change in tumor volume over time for the indicated treatments. Bioluminescence was quantified by determining the total flux (photons/sec) in each mouse from week one to week three. G) Change in WBC, HB, and PLT in peripheral blood for the indicated groups and treatments. H) Total numbers of bone marrow LT‐HSC, ST‐HSC, and MPP cells at termination for each of the indicated treatments. Data represent mean ± SD for n = five to six mice per group. *: p < 0.05, **: p,0.01; ***: p < 0.001.
Figure 6
Figure 6
ORP100S pharmacokinetics, pharmacodynamics, and toxicology. A) PK: C57Bl/6 mice were injected iv (tail vein) or sc (dorsal) with 64 or 128 µg ORP100S in PBS. Blood samples were collected at 0, 0.25, 0.5, 1, 2, 4, 8, and 16 h post‐injection and the plasma fraction was separated. ORP100S levels in plasma were determined using hybrid immunocapture LC/MS‐MS (KCAS Bioanalytical & Biomarker Services) with appropriate dilution (assay linearity 1 to 2000 ng mL−1). PK parameters were determined using WinNonlin non‐compartmental analysis. n = 5 mice per time‐point. B) PD: mice were injected iv (tail vein) or sc (dorsal) with 64 or 128 µg ORP100S in PBS. Blood samples were collected at 0, 0.25, 0.5, 1, 2, 4, 8, and 16 h post‐injection. ROS levels in blood mononuclear cells were measured using a DCFDA assay kit. n = 5 mice per each time‐point. C) PK study in cynomolgus macaques. NHPs were injected sc ORP100S 7.1 mg m−2 (equivalent to 64 µg per mouse, low dose) or 14.2 mg m−2 (equivalent to 128 µg per mouse, high dose). Blood samples were collected at 0, 0.25, 0.5, 0.75, 1, 2, 6, and 24 h post‐injection and ORP100S levels in plasma were quantified by hybrid immunocapture LS/MS‐MS with appropriate sample dilution. D) Repeat‐dose acute toxicology study: Animals were injected with 0, 128, 1280, 2560, or 5120 µg IV or SC in a volume of 200 µl once daily for five days. Mice were weighed daily and monitored for changes in activity and behavior. Body weight was measured and presented as means ± SD. Body weights over time in 2 highest doses (2560 µg and 5120 µg) were shown. E) Mice were euthanized 1d after the final dose. Terminal blood samples were also collected at euthanasia. CBC: white blood cell count (WBC), hemoglobin (HB) and platelets were measured by cell counter. *: p < 0.05, **: p < 0.01; ***: p < 0.001.
Figure 7
Figure 7
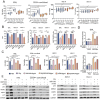
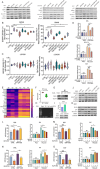
ORP100S attenuates ferroptosis induced by radiation and chemotherapy in stem cells but not in cancer cells. A) EML cells, HT29 cells, TRAMP cells, and B16‐F10 cancer cells were treated with PBS, 40 µg mL−1 ORP100S or 40 µg mL−1 rhTRX in PBS for 48 h. Cells were harvested and protein lysates were subjected to Western blotting using SLC7A11 antibody, GPX4 antibody or GAPDH antibody. B) EML cells and B16‐F10 cancer cells were treated with PBS, 40 µg mL−1 ORP100S or 40 µg mL−1 rhTRX in PBS for 48 h. The cells were transferred to pre‐coated slides and stained with immunofluorescence labeled SLC7A11 antibody, immunofluorescence labeled GPX4 antibody or 4',6‐diamidino‐2‐phenylindole (DAPI). The levels of SLC7A11 and GPX4 were detected under fluorescent microscope. Representative images were shown. C) EML cells and B16‐F10 cancer cells were treated with PBS, 40 µg mL−1 ORP100S or 40 µg mL−1 rhTRX in PBS with or without 10 µm Erastin (ferroptosis inducer) for 48 h. Cells were harvested and protein lysate was subjected to Western blot analysis with indicated antibodies. D) EML cells were irradiated with 1 Gy, 3 Gy or 5 Gy and treated with PBS, 40 µg mL−1 ORP100S or 40 µg mL−1 rhTRX in PBS for 48 h. The cells were incubated with 5 µM boron‐dipyrromethene (BODIPY) 581/911 C11 reagent in PBS at 37 °C for 30 min. Labeled cells were washed and analyzed by flow cytometry. For lipid peroxidation analysis, the peroxidation state of each group was calculated by mean fluorescence intensity (MFI) ratio of the FL1 channel (590 nm) to that of FL3 channel(510 nm). E) EML cells were irradiated with 1 Gy, 3 Gy or 5 Gy and treated with PBS, 40 µg mL−1 ORP100S or 40 µg mL−1 rhTRX in PBS for 48 h. The cells were labeled with Bio Tracker Far‐red Labile Fe2+ Dye at 5 µm for 90 min in PBS at 37 °C. Intracellular ferrous iron was measured by quantifying mean fluorescence intensity using Image J. F) Human CD34+ HSPCs were irradiated with 1 Gy, 3 Gy or 5 Gy and treated with PBS, 40 µg mL−1 ORP100S or 40 µg mL−1 rhTRX in PBS for 48 h. The cells were labeled with Bio Tracker Far‐red Labile Fe2+ Dye at 5 µm for 90 min in PBS at 37 °C. Intracellular ferrous iron was measured by quantifying mean fluorescence intensity using Image J. G) MM1.R and MV4‐11 cells were treated with 5 Gy or 5‐FU (25 µm) or cisplatin (1 µM) with or without ORP100S (40 µg mL−1) or rhTRX (40 µg mL−1) for 48 hr. Lipid peroxidation (top panels) and intracellular ferrous iron level (lower panels) were measured. H) C57Bl/6 mice were implanted with EG7 and subsequently treated with 5‐FU ± ORP100S as described in Figure 5A. At 3 weeks tumors and bone marrow were collected for SLC7A11 and GPX4 western blot analysis. I) C57Bl/6 mice were implanted with B16‐F10. Following tumor development, mice were treated with cisplatin ± ORP100S as described Figure S7 (Supporting Information). Protein lysates were subjected to Western blotting with indicated antibodies. *: p < 0.05, **: p < 0.01, ***: p < 0.001.
Figure 8
Figure 8
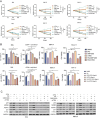
ORP100S mediates ferroptosis inhibition via the KLF4/p53 axis. (A) EML cells (left panel), B16‐F10 cancer cells (middle panel), and EG7 cancer cells (right panel) were transduced with control or p53‐specific CRISPR/Cas9 then treated with ORP100S (40 µg mL−1) or rhTRX (40 µg mL−1) and after 48 h cells were harvested, lysed and protein lysates were subjected to Western blotting with indicated antibodies. (B) SW48 cells were treated with 5‐FU (10 µM) or cisplatin (3 µM) with or without ORP100S (40 µg mL−1) or rhTRX (40 µg mL−1) for 48 hr. Cellular lipid peroxidation (left panel) and intracellular labile ferrous iron Fe2+ levels (lower panel) were measured by BODIPY 581/591 C11 and BioTracker Fe2+ fluorescence staining, respectively. C) LS1034 cells were treated with 5‐FU (5 µM) or cisplatin (10 µM) with or without ORP100S (40 µg mL−1) or rhTRX (40 µg mL−1) for 48 h and lipid peroxidation (left panel) and intracellular ferrous iron levels (right panel) were measured as described above. D) p53 promoter regions were cloned into the PGL3 firefly/renilla reporter system and the resultant PGL3‐p53‐reporter plasmids were transduced into EML cells, B16‐F10 and EG7 cell lines. Cells were treated with ORP100S (40 µg mL−1) or rhTRX (40 µg mL−1) for 48 hr, and luciferase bio‐luminescence activity was measured. E) RNA sequence heat map of enriched HSPCs from TRX knockout (KO) and WT mice (KLF4 is highlighted). F) KLF4 expression in TRX KO versus WT mice. G) Co‐immunoprecipitation (Co‐IP) of TRX with KLF4. Total cell lysates were immunoprecipitated using an anti‐TRX antibody or IgG control and the pull‐down was probed for KLF4 by immunoblotting. H) Representative images of ChIP‐PCR products amplified by primers (100 bp) on 2% agarose gel in EML cells. I) EML cells were treated with PBS or ORP100S (40 µg mL−1) for 48 hr. Cells were harvested and KLF4 mRNA levels were measured by qPCR (top panel). Additionally, KLF4 protein levels were measured by Western blot (lower panel). J,K) EML and EG7 cells were treated with 5‐FU (25 µM), ORP100S (40 µg mL−1) or TRX (40 µg mL−1) for 48 hr. Protein lysates were subjected to western blotting with indicated antibodies. L,M) EML cells (L) and EG7 cells (M) were transduced with a control vector or KLF4‐overexpression plasmid and then treated with PBS or 40 µg mL−1 ORP100S. Chromatin immunoprecipitation (ChIP)‐PCR was performed to measure the binding (occupancy) of KLF to the p53 promoter (left panel). EML and EG7 cells transduced initially with a control vector or KLF4 overexpression plasmid were subsequently transfected with a PGL3‐p53 firefly luciferase reporter vector construct and treated with ORP100S (40 µg mL−1), following which p53 transcription‐driven luciferase bioluminescence was measured (right panel). N,O): KLF4 in EML cells (N) and EG7 cells (O) was knocked out by CRISPR/Cas9 and cells were then treated with 40 µg mL−1 ORP100S. ChIP‐PCR was performed to measure the binding (occupancy) of KLF to the p53 promoter (left panel). EML and EG7 cells transduced initially with control vector or KLF4 KO plasmids were subsequently transfected with a PGL3‐p53 firefly luciferase reporter vector construct and treated with ORP100S (40 µg mL−1), following which p53 transcription‐driven luciferase bioluminescence was measured (right panel). Data represent means ± SD of three independent experiments *: p < 0.05, **: p < 0.01, ***: p < 0.001.

References

    1. Holmgren A., Structure 1995, 3, 239. - PubMed
    1. Rubartelli A., Bajetto A., Allavena G., Wollman E., Sitia R., J. Biol. Chem. 1992, 267, 24161. - PubMed
    1. Sudhadevi T., Harijith A., Pediatric Research 2024, 96, 1117. - PMC - PubMed
    1. Arner E. S., Holmgren A., Eur. J. Biochem. 2000, 267, 6102. - PubMed
    1. Lee S., Kim S. M., Lee R. T., Antioxid. Redox Signaling 2013, 18, 1165. - PMC - PubMed

LinkOut - more resources