. 2025 Sep 11;23(9):e3003362.
doi: 10.1371/journal.pbio.3003362. eCollection 2025 Sep.

The mTORC2 subunit RICTOR drives breast cancer progression by promoting ganglioside biosynthesis through transcriptional and epigenetic mechanisms

Affiliations

The mTORC2 subunit RICTOR drives breast cancer progression by promoting ganglioside biosynthesis through transcriptional and epigenetic mechanisms

Mohammad Nafees Ansari et al. PLoS Biol. .

Abstract

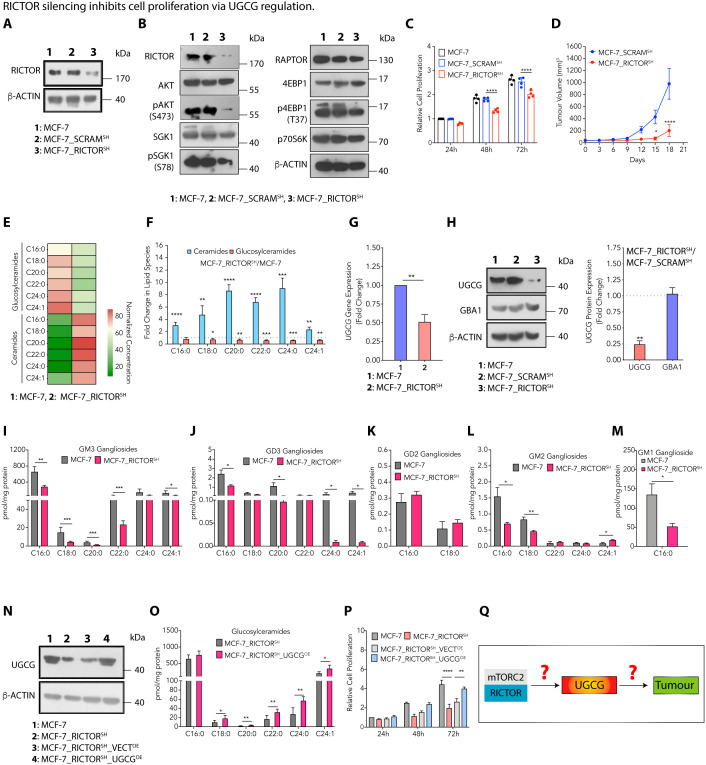
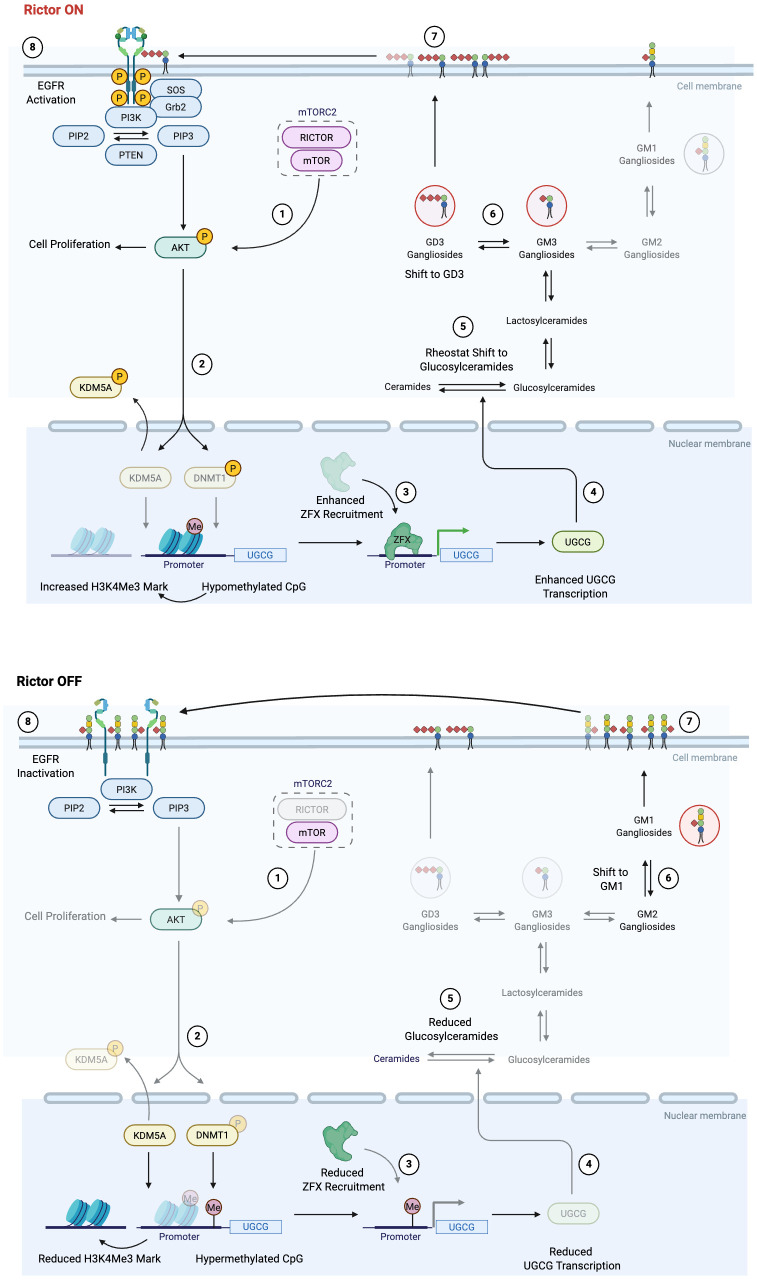
Sphingolipid and ganglioside metabolic pathways are crucial components of cell signaling, having established roles in cancer cell proliferation, invasion, and migration. However, regulatory mechanisms controlling sphingolipid and ganglioside biosynthesis in mammalian cells are less known. Here, we show that RICTOR, the regulatory subunit of mTORC2, regulates the synthesis of sphingolipids and gangliosides in human luminal breast cancer-specific MCF-7 and BT-474 cells through transcriptional and epigenetic mechanisms. We observe that RICTOR regulates glucosylceramide levels by modulating the expression of UDP-Glucose Ceramide Glucosyl transferase (UGCG). We identify Zinc Finger protein X-linked (ZFX) as a RICTOR-responsive transcription factor whose recruitment to the UGCG promoter is regulated by DNA methyltransferase 1 and histone demethylase (KDM5A), which are known AKT substrates. We further demonstrate that RICTOR regulates the synthesis of GD3 gangliosides through ZFX and UGCG, and triggers the activation of the EGFR signaling pathway, thereby promoting tumor growth. In line with our findings in human cell culture and mouse models, we observe an elevated expression of RICTOR, ZFX, and UGCG in Indian luminal breast cancer tissues and in TCGA and METABRIC datasets. Together, we establish a key regulatory circuit, RICTOR-AKT-ZFX-UGCG-Ganglioside-EGFR-AKT, and elucidate its contribution to breast cancer progression.


Conflict of interest statement

The authors have declared that no competing interests exist.

Figures

Fig 1
Fig 1. Luminal tumors have a deregulated sphingolipid and ganglioside profile and high RICTOR expression.
(A) A schematic presentation showing the ceramide-glucosylceramide rheostat connecting the sphingolipid and ganglioside metabolic pathways. (B) The glucosylceramide to ceramide ratio (mean ± SEM, n = 27) for luminal tumor tissues (labeled as T) and adjacent normal tissues (labeled as N) indicates that the balance is shifted towards glucosylceramides. (C) Heat map showing the levels of different ganglioside species in luminal tumor tissues and adjacent normal tissues. (DH) Absolute quantification (mean ± SEM, n = 5) of GM3 (D), GD3 (E), GD2 (F), GM2 (G), and GM1 (H) gangliosides in luminal tumor tissues and adjacent normal tissues shows an increase in GM3 and GD3 gangliosides and a decrease in GM1 gangliosides in luminal tumor tissues. (I) Immunoblot confirming an increase in UGCG expression in MCF-7_UGCGOE cells. (J) Absolute quantification of glucosylceramides (mean ± SEM, n = 5) confirms an increase in MCF-7_UGCGOE cells over MCF-7 cells. (KO) Absolute quantification (mean ± SEM, n = 5) of GM3 (K), GD3 (L), GD2 (M), GM2 (N), and GM1 (O) ganglioside species shows an increase of GM3, GD3, and GM2 gangliosides and a decrease of GM1 gangliosides in MCF-7_UGCGOE cells compared to MCF-7 cells. (P) Cell proliferation (mean ± SEM, n = 5) assay demonstrates an increase in the proliferation of MCF-7_UGCGOE cells over MCF-7_VECTOE cells. (Q) Tumor growth kinetics reveal enhanced growth of MCF-7_UGCGOE tumors compared to MCF-7_VECTOE tumors (mean ± SEM, n = 5–6). (R) Immunoblots show the expression of RICTOR, RAPTOR, AKT, pAKTSer473, SGK1, pSGK1Ser78, 4EBP1, p4EBP1Thr37, and p70S6K in MCF-7_UGCGOE cells in comparison to MCF-7_UGCGDEAD cells. (S) Immunoblots for RICTOR, pAKTSer473, and UGCG in tumor tissues from luminal cancer patients show higher expression than adjacent normal tissues. (T) A schematic diagram showing the questions to be answered to understand the mTORC2-mediated regulation of the sphingolipid metabolic pathway and its role in tumor progression. Data among groups were analyzed using a paired Student t test (for patient data), One-way ANOVA among multiple groups or Two-way ANOVA in time-dependent studies. P-value: *p < 0.05, **p < 0.01, ***p < 0.0005, ****p < 0.0001. Numerical data can be found in S1 Data.
Fig 2
Fig 2. RICTOR silencing inhibits cell proliferation via UGCG regulation.
(A) Immunoblots confirm knockdown of RICTOR expression in MCF-7_RICTORSH cells. (B) Immunoblots show changes in expression of RICTOR, RAPTOR, and their downstream effectors in MCF-7_RICTORSH cells compared to MCF-7_SCRAMSH cells. (C) Cell proliferation studies show a decrease in the proliferation of MCF-7_RICTORSH cells (mean ± SEM, n = 4) compared to MCF-7_SCRAMSH cells. (D) Tumor growth kinetics show significantly slower growth of MCF-7_RICTORSH (mean ± SEM, n = 5) tumors compared to the MCF-7_SCRAMSH tumors. (E) Heat map representing normalized absolute quantitation of ceramides and glucosylceramides in MCF-7_RICTORSH and MCF-7 cells. (F) Fold change (mean ± SEM, n = 5) in different sphingolipid species reveals an increase in ceramides and a decrease in glucosylceramides in MCF-7_RICTORSH cells compared to MCF-7 cells. (G, H) qRT-PCR (mean ± SEM, n = 4) (G) and immunoblots and their quantification (mean ± SEM, n = 3) (H) demonstrate downregulation of UGCG without any change in GBA1 expression in MCF-7_RICTORSH cells compared to MCF-7_SCRAMSH cells. (IM) Absolute quantification (mean ± SEM, n = 3) of GM3 (I), GD3 (J), GD2 (K), GM2 (L), and GM1 (M) ganglioside species shows a decrease in GM3, GD3, GM2, and GM1 gangliosides in MCF-7_RICTORSH cells compared to MCF-7 cells. (N) Immunoblot confirming UGCG overexpression in MCF-7_RICTORSH cells. (O) The absolute quantification of glucosylceramides (mean ± SEM, n = 4) in MCF-7_RICTORSH_UGCGOE cells compared to MCF-7_RICTORSH cells confirms an increase in glucosylceramides. (P) Cell proliferation assay demonstrates an increase in cell proliferation (mean ± SEM, n = 4) of MCF-7_RICTORSH cells on UGCG overexpression. (Q) A schematic diagram showing the role of putative factors modulating the RICTOR/pAKT-mediated UGCG expression that can lead to altered glucosylceramides, thereby controlling tumor progression. Data among groups were analyzed using an unpaired Student t test or One-way ANOVA among multiple groups or by Two-way ANOVA in time-dependent studies. p-value: *p < 0.05, **p < 0.01, ***p < 0.0005, ****p < 0.0001. Numerical data can be found in S2 Data.
Fig 3
Fig 3. RICTOR regulates UGCG expression via transcription factor Zinc Finger X-linked (ZFX).
(A) A schematic diagram showing the workflow to identify RICTOR-regulated transcription factors that bind to the UGCG promoter. (B) Results from qRT-PCR (mean ± SEM, n = 3) confirm reduced expression of RICTOR-regulated ELF1, ZFX, and CTCF transcription factors in MCF-7_RICTORSH cells. (C) ChIP-qPCR (mean ± SEM, n = 3) results show reduced binding of ZFX to UGCG promoter in MCF-7_RICTORSH cells. (D) EMSA shows the binding of ZFX to UGCG promoter (lanes 2 and 3) in MCF-7_ZFXOE cells, shift-ablation assay in MCF-7_ZFXOE cells (lane 4), competition assay with specific (lane 5) and unrelated oligo as a control (lane 6). “*” denotes nonspecific complexes. (E) EMSA comparing endogenous ZFX-DNA binding activity in MCF-7_SCRAMSH and MCF-7_RICTORSH cells. (F, G) Immunoblots (F) and their quantification (mean ± SEM, n = 3) (G) confirm downregulation of ZFX in MCF-7_RICTORSH cells. (H, I) Immunoblots (H) and their quantification (mean ± SEM, n = 3) (I) confirm overexpression and silencing of ZFX in MCF-7_ZFXOE and MCF-7_ZFXSL cells. (J, K) Immunoblots (J) and their quantification (mean ± SEM, n = 3) (K) show upregulation and downregulation of UGCG upon overexpression and silencing of ZFX in MCF-7_ZFXOE and MCF-7_ZFXSL cells. (L, M) Fold change (mean ± SEM, n = 5) in ceramides (L) and glucosylceramides (M) confirms a decrease in ceramides and an increase in glucosylceramides in MCF-7_ZFXOE cells. In contrast, MCF-7_ZFXSL cells show higher ceramides and reduced glucosylceramides. (N–R) Absolute quantification (mean ± SEM, n = 3-5) of GM3 (N), GD3 (O), GD2 (P), GM2 (Q), and GM1 (R) gangliosides shows an increase in GM3, GD3, and GM2 gangliosides and attenuated GM1 gangliosides on ZFX overexpression in MCF-7 cells. (S) Cell proliferation (mean ± SEM, n = 4) demonstrates increased proliferation of MCF-7_ZFXOE cells, whereas MCF-7_ZFXSL cells show reduced cell proliferation. (T) Tumor growth kinetics recorded a significantly higher growth of MCF-7_ZFXOE (mean ± SEM, n = 4-6) than MCF-7_VECTOE tumors. (U, V) Cell proliferation demonstrates a decrease in proliferation of MCF-7_ZFXOE cells on UGCG silencing (U) (mean ± SEM, n = 4), whereas MCF-7_ZFXSH cells show enhanced cell proliferation on UGCG overexpression (mean ± SEM, n = 3) (V). (W) siRNA-mediated silencing of UGCG leads to reduced tumor growth kinetics in MCF-7_ZFXOE tumors. Data among two groups were analyzed using an unpaired Student t test, among multiple groups using One-way ANOVA, and by Two-way ANOVA in time-dependent studies. p-value: *p < 0.05, **p < 0.01, ***p < 0.0005, ****p < 0.0001. Numerical data can be found in S3 Data.
Fig 4
Fig 4. AKT regulates UGCG expression via epigenomic alterations.
(A) A schematic diagram showing AKT-mediated phosphorylation of DNMT1 leading to hypomethylation of CpG islands that further enhances UGCG expression. (B) Immunoblot showing alteration in phosphorylation of DNMT1 by pan-phospho-ser antibody in MCF-7_RICTORSH and MCF-7_ZFXOE cells compared to MCF-7 cells. (C) Immunoblots showing a dose-dependent decrease in pAKT and UGCG expression in MCF-7_ZFXOE cells on treatment with AKT inhibitor MK2206. (D) Results from qRT-PCR (mean ± SEM, n = 4) show a decrease in UGCG expression in MCF-7_ZFXOE cells on AKT inhibition by MK2206. (E) Immunoblot reveals a decrease in phosphorylation of DNMT1 on treatment of MCF-7_ZFXOE cells with AKT inhibitor MK2206. (F, G) Results from qRT-PCR (mean ± SEM, n = 3) (F) and immunoblot (G) show increased UGCG expression in MCF-7_RICTORSH cells on DNMT inhibition by DAC. (H) ChIP-qPCR results (mean ± SEM, n = 3) confirm enhanced binding of ZFX to UGCG promoter in MCF-7_RICTORSH cells on DAC (5 μM) treatment. (I) A schematic representation of pAKT-mediated regulation of histone demethylase KDM5A that regulates UGCG transcription via histone methylation. (J) Immunoblot showing the change in phosphorylation of KDM5A using the pan-phospho-Ser antibody in MCF-7_RICTORSH cells compared to MCF-7 cells. (K, L) Immunoblot (K) and its quantification (mean ± SEM, n = 3) (L) show alterations in KDM5A expression in nuclear and cytoplasmic extracts in MCF-7_RICTORSH cells compared to MCF-7 cells. (M) Immunoblot reveals a decrease in phosphorylation of KDM5A on treatment of MCF-7_ZFXOE cells with AKT inhibitor MK2206. (N, O) Results from qRT-PCR (mean ± SEM, n = 3) (N) and immunoblot (O) show increased UGCG expression in MCF-7_RICTORSH cells on KDM5A inhibition. (P) ChIP-qPCR results (mean ± SEM, n = 3) show a reduced H3K4Me3 mark on UGCG promoter in MCF-7_RICTORSH cells that increases on treatment with KDOAM-25 inhibitor (30 μM). Data among two groups were analyzed using an unpaired Student t test and among multiple groups using One-way ANOVA. p-value: *p < 0.05, **p < 0.01, ***p < 0.0005, ****p < 0.0001. Numerical data can be found in S4 Data.
Fig 5
Fig 5. GD3-mediated EGFR activation drives cell proliferation and tumor progression.
(A) Immunoblots reveal an increase in pEGFRY1068, pEGFRY1173, pAKTS473, and pERK1/2(Y202, Y204) in MCF-7_UGCGOE and MCF-7_ZFXOE cells compared to MCF-7 cells. (B) Immunoblots show attenuated EGFR activation on shRNA-mediated silencing of GD3 synthase (ST8SIA1) in MCF-7 cells. (C) Cell proliferation assay demonstrates a decrease in cell proliferation (mean ± SEM, n = 3) of MCF-7_ST8SIA1SH cells compared to MCF-7 cells. (D) Immunoblots show enhanced EGFR activation on overexpression of ST8SIA1 in MCF-7 cells. (E) Cell proliferation assay demonstrates increased proliferation (mean ± SEM, n = 3) of MCF-7_ST8SIA1OE cells compared to MCF-7 cells. (F) Absolute quantification (mean ± SEM, n = 3–4) of GD3 gangliosides validates the silencing and overexpression of ST8SIA1 in MCF-7 cells. (G) Immunoblots confirm overexpression of B3GALT4 in MCF-7 cells. (H) Cell proliferation assay demonstrates decreased cell proliferation (mean ± SEM, n = 4) of MCF-7_B3GALT4OE cells compared to MCF-7 cells. (I) Absolute quantification (mean ± SEM, n = 5) of gangliosides validates the overexpression of B3GALT4. (J) Cell proliferation assay (mean ± SEM, n = 3) showing an increase in proliferation of MCF-7_RICTORSH cells upon supplementing GD3 gangliosides and a decrease in cell proliferation upon feeding with GM1 gangliosides. (K) Immunoblots show attenuated EGFR activation on siRNA-mediated silencing of ST8SIA1 in MCF-7_ZFXOE cells. (L) Cell proliferation assay demonstrates a decrease in cell proliferation (mean ± SEM, n = 4) of MCF-7_ZFXOE cells on siRNA-mediated inhibition of ST8SIA1. (M) Tumor growth kinetics using xenograft studies show a decrease in growth kinetics (mean ± SEM, n = 4–6) of MCF-7_ZFXOE tumors on siRNA-mediated inhibition of ST8SIA1. Data among groups were analyzed using an unpaired Student t test, among multiple groups using One-way ANOVA, and by Two-way ANOVA in time-dependent studies. p-value: *p < 0.05, **p < 0.01, ***p < 0.001, ****p < 0.0001. Numerical data can be found in S5 Data.
Fig 6
Fig 6. ZFX expression is strongly associated with UGCG in luminal patients.
(A) A schematic diagram showing the PAM50 classification of the TCGA tumor dataset used for analysis. (B, C) Gene expression of UGCG (B) and ZFX (C) in different breast cancer subtypes (PAM50) of the TCGA dataset confirms high expression of UGCG and ZFX in luminal subtypes compared to other subtypes. (DG) Change in expression of UGCG (D, F) and ZFX (E, G) with respect to ER (D, E) and PR (F, G) status in breast tumors of the TCGA dataset confirms high UGCG (D, F) and high ZFX (E, G) expression in ER+ and PR+ tumors. (H) Percentage of tumors having high expression of UGCG and ZFX among luminal subtype tumors in the TCGA dataset. (I) Representative immunohistochemical images show enhanced cytoplasmic UGCG and increased nuclear stain of ZFX in luminal breast tissues. All images are at 100× magnification, and insets are at 400× magnification. (J) Percentage of luminal tumors from the Indian cohort (N = 90) positive for both UGCG and ZFX on immunohistochemical staining. (K) qRT-PCR (mean ± SEM, n = 10) validation showing high UGCG and high ZFX expression from luminal subtype tumors in comparison to adjacent normal tissues in an Indian cohort. (L) Change in tumor growth kinetics of MCF-7 tumors on treatment with Eliglustat (Mean ± SEM, n = 5). (M) Changes in glucosylceramides and lactosylceramides (Mean ± SEM, n = 4) in eliglustat-treated tumors compared to untreated MCF-7 tumors. (N) Change in tumor growth kinetics of BT-474 tumors on treatment with eliglustat (Mean ± SEM, n = 6). (O) Changes in glucosylceramides and lactosylceramides (Mean ± SEM, n = 3) in eliglustat-treated tumors compared to untreated BT-474 tumors. Data among two groups were analyzed using an unpaired Student t test, among multiple groups using One-way ANOVA, and by Two-way ANOVA in time-dependent studies. p-value: *p < 0.05, **p < 0.01, ****p < 0.0001. Numerical data can be found in S6 Data.
Fig 7
Fig 7. Schematic showing the metabolite-cell signaling-gene regulatory circuit connecting mTORC2/RICTOR signaling to ganglioside metabolism, regulating uncontrolled breast cancer cell proliferation.
Stages 1–8 sequentially represent the mTORC2/RICTOR signaling-mediated epigenetic regulations modulating UGCG transcription, which leads to ganglioside-mediated EGFR activation and tumor progression. The solid black lines represent increased activation and signaling in the circuit, whereas gray lines represent attenuated signaling. Proteins/metabolites in solid colors are upregulated, and blurred colors are downregulated.

References

    1. Hannun YA, Obeid LM. Sphingolipids and their metabolism in physiology and disease. Nat Rev Mol Cell Biol. 2018;19(3):175–91. doi: 10.1038/nrm.2017.107 - DOI - PMC - PubMed
    1. Zhang X, Kiechle FL. Review: glycosphingolipids in health and disease. Ann Clin Lab Sci. 2004;34(1):3–13. - PubMed
    1. Ogretmen B. Sphingolipid metabolism in cancer signalling and therapy. Nat Rev Cancer. 2018;18(1):33–50. doi: 10.1038/nrc.2017.96 - DOI - PMC - PubMed
    1. Sonnino S, Mauri L, Chigorno V, Prinetti A. Gangliosides as components of lipid membrane domains. Glycobiology. 2007;17(1):1R-13R. doi: 10.1093/glycob/cwl052 - DOI - PubMed
    1. Julien S, Bobowski M, Steenackers A, Le Bourhis X, Delannoy P. How do gangliosides regulate RTKs signaling? Cells. 2013;2(4):751–67. doi: 10.3390/cells2040751 - DOI - PMC - PubMed

MeSH terms

Substances