. 2025 Sep 29;12(9):ENEURO.0453-24.2025.
doi: 10.1523/ENEURO.0453-24.2025. Print 2025 Sep.

Cell Type-Specific Contributions of UBE3A to Angelman Syndrome Behavioral Phenotypes

Affiliations

Cell Type-Specific Contributions of UBE3A to Angelman Syndrome Behavioral Phenotypes

Nicholas W Ringelberg et al. eNeuro. .

Abstract

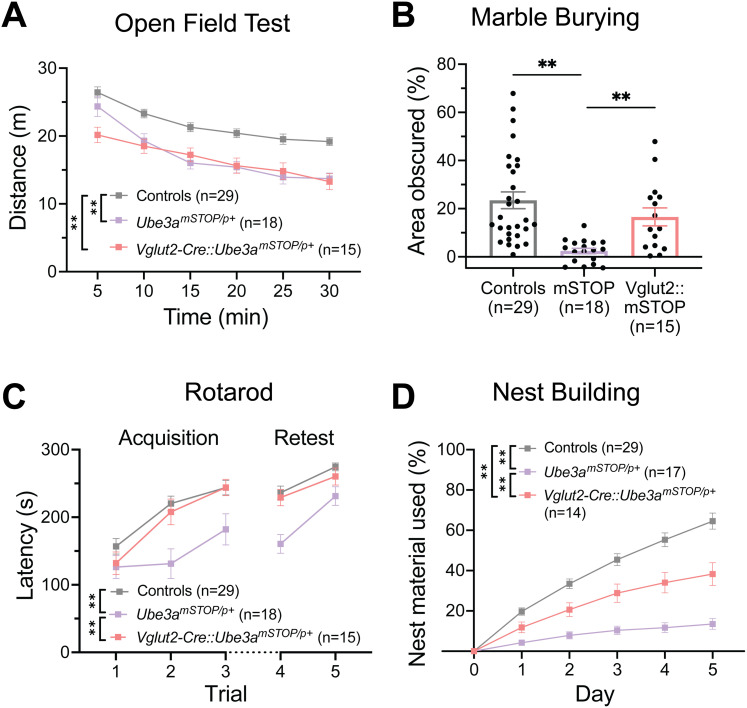
Angelman syndrome (AS) is a rare neurodevelopmental disorder caused by loss of expression of the maternal UBE3A allele and is characterized by a constellation of impactful neurologic symptoms. While previous work has uncovered outsized contributions of GABAergic neuron-selective Ube3a deletion to seizure susceptibility and electroencephalography (EEG) phenotypes in a mouse model of AS, the neuronal populations governing a broader range of behaviors have not been studied. Here, we used male and female mice to test the consequences of Ube3a deletion from GABAergic or glutamatergic neurons across a well-characterized battery of AS-relevant behaviors. Surprisingly, we observed deficits in numerous motor and innate behaviors in mice with glutamatergic Ube3a deletion and relatively few consequences of GABAergic Ube3a deletion. Furthermore, genetic Ube3a reinstatement in glutamatergic neurons rescued multiple motor and innate behaviors. When tested for sleep-wake behaviors, the selective loss of Ube3a from glutamatergic neurons disrupted sleep similarly to that of AS model mice (Ube3am-/p+ ), and glutamatergic Ube3a reinstatement overcame the lack of active cycle "siesta" and decreased REM phenotypes observed in AS model mice. Altogether, this work demonstrates a major role of glutamatergic neuron UBE3A loss in mediating multiple AS behavioral features, suggesting a divergence from the circuitry underlying enhanced seizure susceptibility. Our findings imply that neuronal cell type-agnostic UBE3A reinstatement is likely required for successful AS genetic therapies-with reinstatement of UBE3A in GABAergic neurons necessary for overcoming epileptic and EEG phenotypes, and reinstatement in glutamatergic neurons necessary for overcoming most other behavioral phenotypes.

Keywords: Angelman; behavior; mouse; neurodevelopment; sleep; ube3a.


Conflict of interest statement

The authors declare no competing financial interests.

Figures

Figure 1.
Figure 1.
Mice with maternal allele Ube3a deletion from GABAergic neurons (Gad2-Cre::Ube3amFLOX/p+) exhibit only modest behavioral deficits. A, UBE3A immunostaining in Ube3amFLOX/p+ and Gad2-Cre::Ube3amFLOX/p+ mice. Dashed lines indicate the largely GABAergic caudate putamen, in which UBE3A is robustly deleted in Gad2-Cre::Ube3amFLOX/p+ mice. Zoom images demonstrate cell type-specific UBE3A expression in the somatosensory cortex. Arrows indicate NeuN+, GAD+ neurons. Hemi-section scale bar, 1 mm. Zoom image scale bar, 10 µm. B, Nuclear UBE3A intensity of individual excitatory (NeuN+, GAD−) and inhibitory (NeuN+, GAD+) cells in the somatosensory cortex displayed as violin plots with mean ± SD. C, Schematic of behavioral battery. D, Distance traveled in the open field across 5 min bins. Two-way RM ANOVA. E, Quantification of marble burying behavior by threshold-based analysis of area obscured. Unpaired t test. F, Latency to fall or first passive rotation on the rotarod across each acquisition (Day 1) and retest (Day 2) trial. Two-way RM ANOVA. G, Quantification of percent nesting material used across 5 d test. Two-way RM ANOVA. Behavioral data presented as mean ± SEM. *p < 0.05, **p < 0.01. Individual data points labeled by genotype and sex are reported in Extended Data Figure 1-1. Statistical tests and output statistics for all figures are reported in Extended Data Figure 1-2. Created with BioRender (https://BioRender.com/a9rsfhy).
Figure 2.
Figure 2.
Mice with Ube3a deletion from glutamatergic neurons (Vglut2-Cre::Ube3amFLOX/p+) exhibit motor and innate behavioral deficits. A, UBE3A immunostaining in Ube3amFLOX/p+ and Vglut2-Cre::Ube3amFLOX/p+ mice. Zoom images demonstrate cell type-specific UBE3A expression in the somatosensory cortex. Asterisks indicate excitatory (NeuN+, GAD−) cells. Arrows indicate inhibitory (NeuN+, GAD+) neurons. Arrowhead indicates example excitatory neuron with intact UBE3A expression in Vglut2-Cre::Ube3amFLOX/p+ mouse. Hemi-section scale bar, 1 mm. Zoom image scale bar, 10 µm. B, Nuclear UBE3A intensity of individual excitatory (NeuN+, GAD−) and inhibitory (NeuN+, GAD+) cells in the somatosensory cortex displayed as violin plots with mean ± SD. C, Distance traveled in the open field across 5 min bins. Two-way RM ANOVA. D, Quantification of marble burying behavior by threshold-based analysis of area obscured in Cre-negative controls, Vglut2-Cre controls, and Vglut2-Cre::Ube3amFLOX/p+ mice. Brown–Forsythe test with Dunnett's T3 post hoc multiple comparisons. E, Latency to fall or first passive rotation on the rotarod across each acquisition (Day 1) and retest (Day 2) trial. Two-way RM ANOVA. F, Quantification of percent nesting material used across 5 d test. Two-way RM ANOVA. Behavioral data presented as mean ± SEM. *p < 0.05, **p < 0.01. Individual data points labeled by genotype and sex are reported in Extended Data Figure 2-1.
Figure 3.
Figure 3.
Glutamatergic neuron-selective Ube3a reinstatement (Vglut2-Cre::Ube3amSTOP/p+) rescues AS motor and innate behavioral deficits. A, Distance traveled in the open field across 5 min bins. Two-way RM ANOVA with Tukey's post hoc comparisons of genotype effect. B, Quantification of marble burying behavior by threshold-based analysis of area obscured. Brown–Forsythe test with Dunnett's T3 post hoc multiple comparisons. C, Latency to fall or first passive rotation on the rotarod across each acquisition (Day 1) and retest (Day 2) trial. Two-way RM ANOVA with Tukey's post hoc comparisons of genotype effect. D, Quantification of percent nesting material used across 5 d test. Two-way RM ANOVA with Tukey's post hoc comparisons of genotype effect. Data presented as means ± SEM. *p < 0.05, **p < 0.01. Histological validation of glutamatergic UBE3A reinstatement in the Vglut2-Cre::Ube3amSTOP/p+ model is reported in Extended Data Figure 3-1. Individual data points labeled by genotype and sex are reported in Extended Data Figure 3-2.
Figure 4.
Figure 4.
AS mice exhibit altered sleep patterns. A, Piezoelectric quantification of hourly percent sleep in AS and WT mice. B, Average percent sleep across light and dark cycles. C, Mean sleep bout durations across 4 h time bins. D, Mean sleep bout duration during light and dark cycle, averaged from 4 h bins. All panels analyzed using two-way RM ANOVA with Šídák's post hoc tests. Data presented as mean ± SEM. *p < 0.05, **p < 0.01. Individual data points labeled by genotype and sex are reported in Extended Data Figure 4-1.
Figure 5.
Figure 5.
Gad2-Cre::Ube3amFLOX/p+ mice exhibit fragmented sleep. A, Piezoelectric quantification of hourly percent sleep in Cre-negative controls, Gad2-Cre controls, and Gad2-Cre::Ube3amFLOX/p+ mice. B, Average percent sleep across light and dark cycles. C, Mean sleep bout durations across 4-hour time bins in Controls and Gad2-Cre::Ube3amFLOX/p+ mice. D, Mean sleep bout duration during light and dark cycle, averaged from 4 h bins. All panels analyzed using two-way RM ANOVA with Šídák's post hoc tests. Data presented as mean ± SEM. *Cre-negative controls versus Gad2-Cre::Ube3amFLOX/p+, #Gad2-Cre controls versus Gad2-Cre::Ube3amFLOX/p+, &Cre-negative controls versus Gad2-Cre controls. *p < 0.05, **p < 0.01. Individual data points labeled by genotype and sex are reported in Extended Data Figure 5-1.
Figure 6.
Figure 6.
Vglut2-Cre::Ube3amFLOX/p+ mice exhibit altered sleep behavior. A, Piezoelectric quantification of hourly percent sleep in Vglut2-Cre::Ube3amFLOX/p+ mice and controls. B, Average percent sleep across light and dark cycles. C, Mean sleep bout durations across 4 h time bins. D, Mean sleep bout duration during light and dark cycle, averaged from 4 h bins. All panels analyzed using two-way RM ANOVA with Šídák's post hoc tests. Data presented as mean ± SEM. *p < 0.05, **p < 0.01. Individual data points labeled by genotype and sex are reported in Extended Data Figure 6-1.
Figure 7.
Figure 7.
Glutamatergic neuron-selective reinstatement of Ube3a rescues sleep patterns in AS model mice. A, Piezoelectric quantification of hourly percent sleep in Vglut2-Cre::Ube3amSTOP/p+, Ube3amSTOP/p+, and control mice. B, Average percent sleep across light and dark cycles. C, Mean sleep bout durations across 4 h time bins. D, Mean sleep bout duration during light and dark cycle, averaged from 4 h bins. All panels analyzed using two-way RM ANOVA with Šídák's post hoc tests. Data presented as mean ± SEM. *Controls versus Ube3amSTOP/p+, #Ube3amSTOP/p+ versus Vglut2-Cre::Ube3amSTOP/p+, &Controls versus Vglut2-Cre::Ube3amSTOP/p+. *p < 0.05, **p < 0.01. Individual data points labeled by genotype and sex are reported in Extended Data Figure 7-1.
Figure 8.
Figure 8.
AS model mice exhibit decreased REM sleep. A, Piezoelectric estimation of hourly percent REM sleep in AS and WT mice. B, Average percent REM across light and dark cycles. C, Estimated hourly percent NREM sleep in AS and WT mice. D, Average percent NREM across light and dark cycles. All panels analyzed using two-way RM ANOVA with Šídák's post hoc tests. Data presented as mean ± SEM. *p < 0.05, **p < 0.01. Individual data points labeled by genotype and sex are reported in Extended Data Figure 8-1.
Figure 9.
Figure 9.
Glutamatergic neuron-selective reinstatement of Ube3a normalizes sleep composition. A, Piezoelectric estimation of hourly percent REM sleep in Vglut2-Cre::Ube3amSTOP/p+, Ube3amSTOP/p+, and control mice. B, Average percent REM across light and dark cycles. C, Estimated hourly percent NREM sleep in AS and WT mice. D, Average percent NREM across light and dark cycles. All panels analyzed using two-way RM ANOVA with Šídák's post hoc tests. Data presented as mean ± SEM. *Controls versus Ube3amSTOP/p+, #Ube3amSTOP/p+ versus Vglut2-Cre::Ube3amSTOP/p+, &Controls versus Vglut2-Cre::Ube3amSTOP/p+. *p < 0.05, **p < 0.01. Individual data points labeled by genotype and sex are reported in Extended Data Figure 9-1 (REM sleep estimates) and Extended Data Figure 9-2 (NREM sleep estimates).

References

    1. Anaclet C, Ferrari L, Arrigoni E, Bass CE, Saper CB, Lu J, Fuller PM (2014) The GABAergic parafacial zone is a medullary slow wave sleep-promoting center. Nat Neurosci 17:1217–1224. 10.1038/nn.3789 - DOI - PMC - PubMed
    1. Born HA, Dao AT, Levine AT, Lee WL, Mehta NM, Mehra S, Weeber EJ, Anderson AE (2017) Strain-dependence of the Angelman syndrome phenotypes in Ube3a maternal deficiency mice. Sci Rep 7:8451. 10.1038/s41598-017-08825-x - DOI - PMC - PubMed
    1. Buiting K, Williams C, Horsthemke B (2016) Angelman syndrome - insights into a rare neurogenetic disorder. Nat Rev Neurol 12:584–593. 10.1038/nrneurol.2016.133 - DOI - PubMed
    1. Chao H-T, et al. (2010) Dysfunction in GABA signalling mediates autism-like stereotypies and Rett syndrome phenotypes. Nature 468:263–269. 10.1038/nature09582 - DOI - PMC - PubMed
    1. Colas D, Wagstaff J, Fort P, Salvert D, Sarda N (2005) Sleep disturbances in Ube3a maternal-deficient mice modeling Angelman syndrome. Neurobiol Dis 20:471–478. 10.1016/j.nbd.2005.04.003 - DOI - PubMed

LinkOut - more resources