. 2025 Sep 11;16(1):8196.
doi: 10.1038/s41467-025-63277-6.

Social exposome and brain health outcomes of dementia across Latin America

Affiliations

Social exposome and brain health outcomes of dementia across Latin America

Joaquin Migeot et al. Nat Commun. .

Abstract

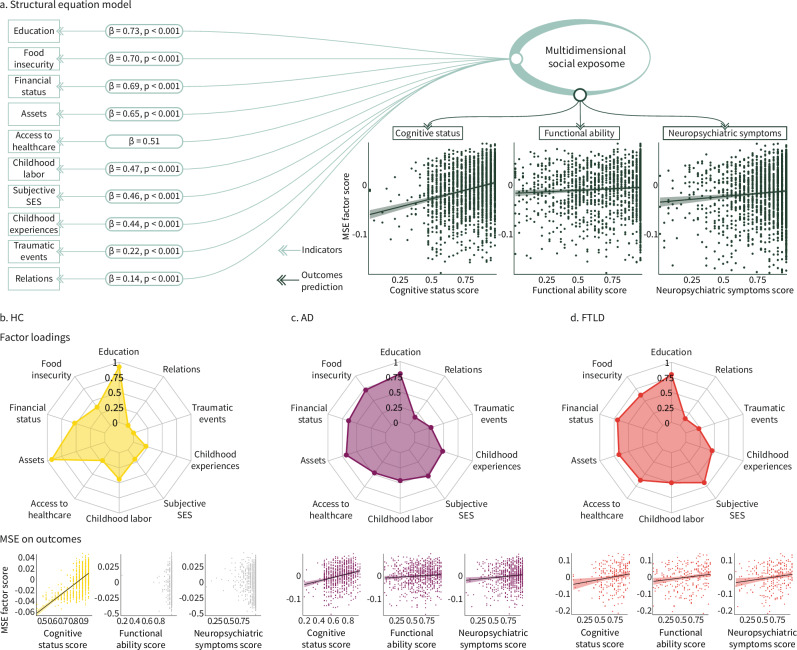
A multidimensional social exposome (MSE)-the combined lifespan measures of education, food insecurity, financial status, access to healthcare, childhood experiences, and more-may shape dementia risk and brain health over the lifespan, particularly in underserved regions like Latin America. However, the MSE effects on brain health and dementia are unknown. We evaluated 2211 individuals (controls, Alzheimer's disease, and frontotemporal lobar degeneration) from a non-representative sample across six Latin American countries. Adverse exposomes associate with poorer cognition in healthy aging. In dementia, more complex exposomes correlate with lower cognitive and functional performance, higher neuropsychiatric symptoms, and brain structural and connectivity alterations in frontal-temporal-limbic and cerebellar regions. Food insecurity, financial resources, subjective socioeconomic status, and access to healthcare emerge as critical predictors. Cumulative exposome measures surpass isolated factors in predicting clinical-cognitive profiles. Multiple sensitivity analyses confirm our results. Findings highlight the need for personalized approaches integrating MSE across the lifespan, emphasizing prevention and interventions targeting social disparities.


Conflict of interest statement

Competing interests: The authors declare no competing interests.

Figures

Fig. 1
Fig. 1. Study design and analysis pipeline.
a Healthy controls (HC) and participants with Alzheimer’s disease (AD) and frontotemporal lobar degeneration (FTLD) were recruited from six Latin American countries: Argentina, Brazil, Chile, Colombia, Mexico, and Peru. b The assessment protocol included a comprehensive multidimensional social exposome (MSE) evaluation alongside clinical, cognitive, and neuroimaging measures. For MSE quantification, all items underwent imputation for missing values (NaN) and were then min-max scaled between 0 and 1, with higher values indicating lower levels of social adversity. Composite scores for each participant were calculated by averaging variables within specific categories: education, food insecurity, financial status, assets, access to healthcare, childhood labor, subjective socioeconomic status (SES), childhood experiences, traumatic events, and relationships. c These domain-specific scores, ranging from 0 to 1, served as inputs in structural equation models (SEM) to predict cognitive function, functional ability, and neuropsychiatric symptoms in the whole sample (green), HC (yellow), AD (purple), and FTLD (red). d The global MSE score, extracted from the latent variable, was employed to predict brain structure and functional connectivity. The coverage of regions within the top clusters identified in whole-brain voxel-based morphometry analyses using magnetic resonance imaging (MRI) was examined. Specific regions may include the middle frontal gyrus (MFG), insula (INS), rolandic operculum (ROL), and anterior cingulate cortex (ACG). In resting-state functional magnetic resonance imaging (rsfMRI) analyses, region of interest (ROI)-to-ROI connectivity was assessed by identifying the top regions with the highest number of connections. For illustration purposes, critical regions such as the cerebellum (CCRU cerebellum crus, CER cerebellum lobule), and middle frontal gyrus (MFG) are highlighted. All analyses were controlled for age, sex, total intracranial volume (TIV, for voxel-based morphometry analyses), and scanner. Created in BioRender. Migeot, J. (2025) https://BioRender.com/rxcmtgq (sample size, assessment protocol, covariate icons and MRI device).
Fig. 2
Fig. 2. Structural equation modeling (SEM) of multidimensional social exposome and clinical-cognitive phenotypes.
SEM between the multidimensional social exposome (MSE) and cognitive status, functional ability and neuropsychiatric symptoms. Top factor loadings (exact p-values: education = 1 × 10−308; food insecurity = 1 × 10−308; financial status =  1 × 10−308; assets = 1 × 10−308; childhood labor = 1 × 10−308; subjective SES = 1 × 10−308; childhood experiences = 1 × 10−308; traumatic events = 1 × 10−15; relations = 1 × 10−8) and distribution of association with outcomes for a the whole sample (green), b healthy controls (HC, yellow), c persons with Alzheimer’s disease (AD, purple) and d frontotemporal lobar degeneration (FTLD, red). No adjustments were made for multiple comparisons. The SEM was implemented as a two-sided model by default. Functional ability and neuropsychiatric symptoms score were inverted to facilitate the interpretability of associations relative to the cognitive status score, so that the higher the value, the higher the functional capacity and the lower the neuropsychiatric symptoms. In the scatter plots, each point represents an individual observation. The black line indicates the linear regression fit, and the shaded area represents the 95% confidence interval of the fit. Source data are provided as a Source Data file.
Fig. 3
Fig. 3. Association between multidimensional social exposome and brain structure.
a Whole-brain analysis for persons with Alzheimer’s disease (AD, purple) shows regions with significant associations between the multidimensional social exposome (MSE) and gray matter volume (GMV), highlighted by threshold-free cluster enhancement (TFCE) values. Circular barplot charts are included for the top cluster, indicating the percentage coverage of the top region within the cluster. Scatterplots illustrate the relationship between MSE scores and clusters’ GMV. b Whole-brain analysis for persons with frontotemporal lobar degeneration (FTLD, red) highlights regions significantly associated with MSE, with TFCE values similarly visualized. Corresponding scatterplots depict the associations between MSE scores and GMV for each identified cluster. In the scatter plots, each point represents an individual observation. The black line indicates the linear regression fit, and the shaded area represents the 95% confidence interval of the fit. ACG anterior cingulate gyrus, CCRU cerebellum crus, CER cerebellum lobule, FFG fusiform gyrus, IFGoperc inferior frontal gyrus, opercular part, IFGtriang inferior frontal gyrus, triangular part, INS insula, LING lingual gyrus, MFG middle frontal gyrus, ORBinf inferior frontal gyrus, orbital part, ORBmed medial orbital gyrus, PUT putamen, REC rectus gyrus, ROL rolandic operculum, SFG superior frontal gyrus, SFGdor superior frontal gyrus, dorsolateral, SFGmed medial superior frontal gyrus, VER vermis lobule. Source data are provided as a Source Data file.
Fig. 4
Fig. 4. Associations between multidimensional social exposome and brain connectivity.
a Functional connectivity in persons with Alzheimer’s disease (AD) displayed through region of interest (ROI)-to-ROI connectivity maps, where color-coded edges represent significant t-values for decreased (red) and increased (blue) connectivity associated with MSE. The connectome ring provides a simplified visualization of interconnections between key regions. The circular barplot chart highlights the top regions with the highest number of connections in this group (purple). b In persons with frontotemporal lobar degeneration (FTLD), ROI-to-ROI connectivity maps similarly provide visualizations of significant connections associated with MSE, with the connectome ring displaying interconnections between key regions and a circular barplot chart showing key regions with the highest number of connections in this group (red). AG angular gyrus, Cer cerebellum, CG cingulate gyrus, Cun Cuneus, FuG fusiform gyrus, Hipp hippocampus, IFG inferior frontal gyrus, INS insula, ITG inferior temporal gyrus, MFG middle frontal gyrus, MTG middle temporal gyrus, OcG occipital gyrus, PCL paracentral lobule, Pcun precuneus, PhG parahippocampal gyrus, PoCG postcentral gyrus, PrG precentral gyrus, SFG superior frontal gyrus, SmG supramarginal gyrus, SPL superior parietal lobule, STG superior temporal gyrus, Str striatum, Thal thalamus. Source data are provided as a Source Data file.

References

    1. Ibanez, A. et al. Neuroecological links of the exposome and One Health. Neuron112, 1905–1910 (2024). - PMC - PubMed
    1. Moguilner, S. et al. Brain clocks capture diversity and disparities in aging and dementia across geographically diverse populations. Nat. Med. 10.1038/s41591-024-03209-x (2024). - PMC - PubMed
    1. Livingston, G. et al. Dementia prevention, intervention, and care: 2024 report of the Lancet standing Commission. The Lancet10.1016/S0140-6736(24)01296-0 (2024). - PubMed
    1. Sakowski, S. A., Koubek, E. J., Chen, K. S., Goutman, S. A. & Feldman, E. L. Role of the exposome in neurodegenerative disease: recent insights and future directions. Ann. Neurol.95, 635–652 (2024). - PMC - PubMed
    1. Migeot, J. et al. Allostasis, health, and development in Latin America. Neurosci. Biobehav. Rev.162, 105697 (2024). - PMC - PubMed

LinkOut - more resources