. 2025 Aug 27:16:1532318.
doi: 10.3389/fimmu.2025.1532318. eCollection 2025.

IFIT3 activation significantly contributes to HIV-1-associated neurodegenerative disorder-mediated neuroinflammation

Affiliations

IFIT3 activation significantly contributes to HIV-1-associated neurodegenerative disorder-mediated neuroinflammation

Ranjit Kumar Das et al. Front Immunol. .

Abstract

Introduction: The advent of effective combination antiretroviral therapy (cART) has significantly improved HIV-1 treatment, saving millions of lives. However, HAND remains a concern, particularly among aging individuals with HIV-1. The mechanisms underlying HAND are not well understood.

Methods: This study investigated the role of interferon-induced protein with tetratricopeptide repeats 3 (IFIT3) and its upstream regulator, signal transducer, and activator of transcription 1 (STAT1), in HAND pathology. Using the SH-SY5Y neuroblastoma cell line and HIV-infected humanized mice, we examined the effects of the cART drugs, HIV Tat protein, and HIV-1 virus on STAT1 and IFIT3 expression.

Results: The results showed that HIV-1 exposure significantly upregulated STAT1 and IFIT3, contributing to neuroinflammation.

Discussion: This study identified IFIT3 as a critical molecular marker for HAND, suggesting its potential as a therapeutic target and offering new insights into disease pathology and treatment strategies.

Keywords: HAND; HIV; IFIT3; SH-SY5Y cells; STAT1; Tat protein; cART.


Conflict of interest statement

The authors declare that the research was conducted in the absence of any commercial or financial relationships that could be construed as a potential conflict of interest. The author(s) declared that they were an editorial board member of Frontiers, at the time of submission. This had no impact on the peer review process and the final decision.

Figures

Figure 1
Figure 1
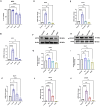
Effects of antiretroviral drugs on IFIT3 and STAT1 gene expression and cell viability in differentiated SH-SY5Y cells. Effects of individual and combined antiretroviral drugs on cell viability and gene expression in differentiated SH-SY5Y cells. (A) Cell viability assessed by MTS assay after 24-hour treatment with tenofovir disoproxil fumarate (TDF, 1.8 μM), dolutegravir (DTG, 20 μM), emtricitabine (FTC, 21 μM), or their combination (cART). (B, C) Relative mRNA expression levels of IFIT3 and STAT1, respectively, in cells treated with lower drug concentrations (TDF at 0.06 μM, DTG at 0.8 μM, FTC at 0.7 μM). (D, E) Relative mRNA expression levels of IFIT3 and STAT1 in cells treated with higher drug concentrations (TDF at 1.8 μM, DTG at 20 μM, FTC at 21 μM). Gene expression was quantified by RT-qPCR, with fold changes calculated relative to untreated control samples. MTS assay results represent the percentage of viable cells compared to control. Independent experiments included n = 9 replicates for RT-qPCR and n = 18 replicates for MTS assay. Statistical significance was determined by one-way ANOVA followed by Dunnett’s multiple comparisons test. *P < 0.0177; **P < 0.0015; ***P < 0.0011; ****P < 0.0001; ns, not significant.
Figure 2
Figure 2
Effects of Tat and cART on IFIT3 and STAT1 gene expression and cell viability in differentiated SH-SY5Y cells. Effects of HIV-1 Tat protein and cART on SH-SY5Y cell viability, gene expression, and protein levels of IFIT3 and STAT1. (A) Cell viability of differentiated SH-SY5Y cells following treatment with 10, 50, and 100 ng/mL Tat protein for 24 hours, assessed by MTS assay. (B, C) Relative mRNA expression levels of IFIT3 and STAT1 following Tat treatment, evaluated by RT-qPCR. (D, E) IFIT3 and STAT1 gene expression levels after treatment with cART alone or combined Tat+cART treatment. (F, H) Representative Western blot images showing IFIT3 and STAT1 protein levels under different treatment conditions. (G, I) Densitometric analysis of IFIT3 and STAT1 protein expression normalized to β-actin. (J, K) Gene expression analysis of IFIT3 and STAT1 in SH-SY5Y cells treated with HIV, HIV+cART, or cART alone. Fold changes were calculated based on Ct values relative to untreated controls. Western blot quantification was performed using ImageJ, normalizing protein band intensities to β-actin. Independent experiments were performed for RT-qPCR (n = 9), MTS assay (n = 18), and Western blot analysis (n = 3). Statistical significance was determined using one-way ANOVA followed by Dunnett’s multiple comparisons test. *P < 0.05; **P < 0.0082; ***P < 0.001; ****P < 0.0001; ns, not significant.
Figure 3
Figure 3
Immunocytochemical analysis of IFIT3 and STAT1 protein expression in differentiated SH-SY5Y cells. Immunocytochemical analysis of IFIT3 and STAT1 expression in differentiated SH-SY5Y cells following HIV Tat and cART treatments. (A, D) Representative confocal microscopy images showing IFIT3 and STAT1 protein expression in cells treated with HIV Tat protein, combination cART, or Tat+cART for 24 hours. IFIT3 and STAT1 were detected using Alexa Fluor 488-conjugated antibodies (green), and nuclei were counterstained with DAPI (blue). Phase contrast images detail cellular morphology, and composite images combine all fluorescence channels. (B, E) Quantitative analysis of IFIT3 and STAT1 expression under different treatment conditions. Data were collected from three independent experiments, with 5–6 images per experiment and 5–10 cells analyzed per image. (C, F) Machine learning analysis evaluating classification accuracy based on IFIT3 and STAT1 expression patterns. Statistical significance was assessed using one-way ANOVA followed by Dunnett’s multiple comparisons test. *P < 0.05; **P < 0.0027; ****P < 0.0001; ns, not significant.
Figure 4
Figure 4
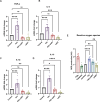
Effects of HIV on cytokine production and ROS induction in SH-SY5Y cells. HIV-1 exposure modulates cytokine expression and induces oxidative stress in differentiated SH-SY5Y cells. (A–D) mRNA expression levels of proinflammatory cytokines TNF-α, IL-1β, and IL-6, as well as the anti-inflammatory cytokine IL-10, were assessed by RT-qPCR following 24-hour treatment with HIV, HIV+cART, or cART alone, compared to untreated control cells. (E) Intracellular ROS levels were quantified using H2DCFDA fluorescence in control, Tat-treated, and Tat+cART-treated groups. Hydrogen peroxide (H2O2) served as a positive control for ROS induction, while catalase treatment served as a negative control. For cytokine gene expression analysis, three biological replicates (n=3) were used, and for ROS measurements, twelve replicates (n=12) were analyzed. Gene expression was normalized to GAPDH, and fold changes were calculated relative to control samples. Statistical significance was determined using one-way ANOVA followed by Dunnett’s multiple comparisons test. *P < 0.05; **P < 0.01; ***P < 0.001; ****P < 0.0001; ns, not significant.
Figure 5
Figure 5
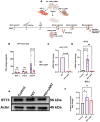
HIV-1 infection increases IFIT3 expression and viral burden in a humanized mouse model. (A) Experimental workflow: Humanized NSG-PBMC mice were engrafted with human PBMCs (Day -2), infected with HIV-1 (Day -1), and initiated on cART (Day 0). Three groups were established: control, HIV-infected, and HIV-infected + cART. Plasma samples were collected on Days 1, 5, and 14 for HIV-1 P24 quantification. On Day 14, brain tissues were harvested for RT-qPCR, Western blot, and immunohistochemistry. (B) Plasma P24 levels confirmed elevated systemic viral load in HIV-infected mice compared to controls. (C) Brain HIV-LTR expression was significantly higher in HIV-infected mice and partially reduced with cART. (D) IFIT3 gene expression was upregulated in brain tissues of HIV-infected mice and attenuated by cART treatment. (E) Western blot analysis showed increased IFIT3 protein expression with HIV infection and partial normalization following cART, with densitometric quantification (F) normalized to β - actin. Statistical significance was determined using one-way ANOVA with Dunnett’s multiple comparisons test for IFIT3 gene and protein expression and a t-test for HIV-LTR results. Significance is indicated as *p = 0.219, ****p < 0.0001, and ns, not significant.
Figure 6
Figure 6
(A) Immunohistochemical analysis of cerebellum brain tissue from humanized mice subjected to HIV-1 and cART is shown in the remaining panels. Representative images illustrate IFIT3 expression (green fluorescence), neuronal cells labeled with the NeuN marker (red fluorescence), and nuclear staining with DAPI (blue fluorescence). Column 1 shows IFIT3 expression. Column 2, NeuN labeling; Column 3, DAPI staining; Column 4, a composite image of IFIT3, NeuN, and DAPI. Column 5 shows phase contrast (PC) imaging to detail the cellular morphology. Column 6 shows a composite overlay of IFIT3/NeuN/DAPI with phase contrast imaging to provide a holistic view of expression patterns within the cellular architecture. (B) shows the fluorescence intensity, and (C) shows the accuracy analysis via MATLAB. The study included brain tissue samples from six individual mice (n=6) in each treatment group.Differences in IFIT3 expression were statistically analyzed via one-way ANOVA with Dunnett’s multiple comparisons test. Significance levels are indicated as *p = 0.219, ****p < 0.0001 and ns, not significant.

References

    1. Danforth K, Granich R, Wiedeman D, Baxi S, Padian N. Global mortality and morbidity of HIV/AIDS. Major Infect Dis. (2018) 2017:6. doi: 10.1596/978-1-4648-0524-0_ch2, PMID: - DOI - PubMed
    1. WHO . The Global Health Observatory (2022). Available online at: https://www.who.int/data/gho/data/themes/hiv-aids/data-on-the-size-of-th....
    1. Saylor D, Dickens AM, Sacktor N, Haughey N, Slusher B, Pletnikov M, et al. HIV-associated neurocognitive disorder—pathogenesis and prospects for treatment. Nat Rev Neurol. (2016) 12:234–48. doi: 10.1038/nrneurol.2016.27, PMID: - DOI - PMC - PubMed
    1. Ghosn J, Delaugerre C. Can we avoid treatment interruption studies in the search for an HIV cure? Aids. (2015) 29:1575–7. doi: 10.1097/QAD.0000000000000763, PMID: - DOI - PubMed
    1. Kaduszkiewicz H, Eisele M, Wiese B, Prokein J, Luppa M, Luck T, et al. Prognosis of mild cognitive impairment in general practice: results of the German AgeCoDe study. Ann Family Med. (2014) 12:158–65. doi: 10.1370/afm.1596, PMID: - DOI - PMC - PubMed

MeSH terms

Substances