. 2025 Sep 10;6(5):e70085.
doi: 10.1002/pei3.70085. eCollection 2025 Oct.

Light Spectrum, Intensity, and Photoperiod Are Key for Production as Well as Speed Breeding of Spring Wheat in Indoor Farming

Affiliations

Light Spectrum, Intensity, and Photoperiod Are Key for Production as Well as Speed Breeding of Spring Wheat in Indoor Farming

Jinglai Li et al. Plant Environ Interact. .

Abstract

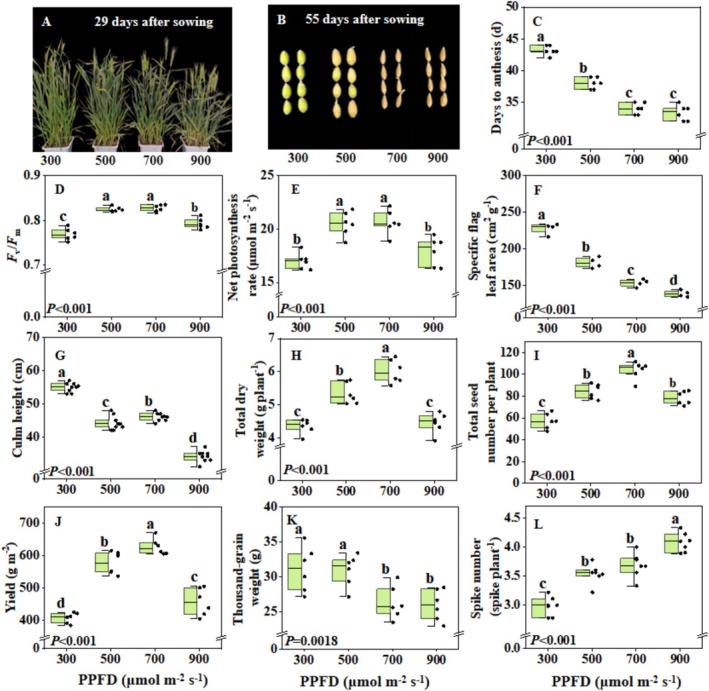
Wheat (Triticum aestivum L.) is the 3rd largest food crop worldwide. Growing wheat in indoor farming is a possible option for increasing future production and to facilitate speed breeding. Light is one of the most important environmental factors, but the light recipe for growing wheat in indoor farming is not well researched. We aimed to investigate the effects of light spectrum (including color temperature), intensity, photoperiod, and pattern on spring wheat growth, flowering time, and yield. Under full-spectrum white LEDs, a color temperature of 3500 K caused anthesis to be 4 days earlier and increased yield by 13% compared with 4500 K at a light intensity of 500 μmol m-2 s-1. At a light intensity of 700 μmol m-2 s-1, plants entered anthesis 3-10 days earlier compared to those under 300-500 μmol m-2 s-1, and achieved the highest yield. Continuous light caused 3-4 days earlier anthesis but caused a 13% yield reduction compared to a photoperiod of 22 h at the same daily light integral (~40 mol m-2 day-1). Under a dynamic light intensity pattern (~300 μmol m-2 s-1 from emerging to tillering; ~700 μmol m-2 s-1 from elongation to heading; ~400 μmol m-2 s-1 after flowering), flowering was triggered as early as under constant 700 μmol m-2 s-1 while saving ~30% of light input. We suggest that both a constant and a dynamic lighting recipe can be used to grow spring wheat indoors, potentially leading to more than seven generations per year.

Keywords: indoor farming; light intensity; light spectrum; photoperiod; speed breeding; wheat.


Conflict of interest statement

The authors declare no conflicts of interest.

Figures

FIGURE 1
FIGURE 1
Relative photon flux density of growth light spectrum in different experiments. (A) spectrum of white LED panel with color temperature of 5000 K; (B–D) relative photon flux density of white LED plus blue LED (W + B), white LED plus green LED (W + G) and white LED plus red LED (W + R) panels. (E and F) spectrum of white LED panels with color temperatures of 4500 and 3500 K, respectively.
FIGURE 2
FIGURE 2
Effects of light quality on spring wheat growth and production. (A) Image of plants at 43 days after sowing; (B) days from sowing to anthesis (n = 6); (C) net photosynthesis rate at 300 μmol m−2 s−1 (n = 6); (D) maximum photochemical efficiency of photosystem II (F v/F m) (n = 6); (E) total dry weight (including stem and spike) (n = 6); (F) yield (n = 6); (G) spike number (n = 6); (H) total seed number per plant (n = 6). Wheat was grown under four different light quality treatments: White (W), white + green (W + G), white + blue (W + B), white + red (W + R) at PPFD of ~300 μmol m−2 s−1. Box plots indicate 0% (maximum), 25%, 50% (median), 75%, and 100% (minimum) and points show single data. Different letters represent significant differences between treatments according to Duncan's analysis at p = 0.05.
FIGURE 3
FIGURE 3
Effects of light intensity on spring wheat growth and production. (A) image of plants at 29 days after sowing; (B) image of seeds at 55 days after sowing; (C) days from sowing to anthesis (n = 6); (D) maximum photochemical efficiency of photosystem II (F v/F m) (n = 6); (E) net photosynthesis rate (at corresponding growth light intensity) (n = 6); (F) specific flag leaf area (n = 4); (G) culm height (n = 9); (H) total dry weight (including stem and spike) (n = 6); (I) total seed number per plant (n = 6); (J) wheat yield (n = 6); (K) thousand‐grain weight (n = 6); (L) spike number per plant (n = 6). Box plots indicate 0% (maximum), 25%, 50% (median), 75%, and 100% (minimum), and points show single data. Different letters represent significant differences between treatments according to Duncan's analysis at p = 0.05.
FIGURE 4
FIGURE 4
Effects of light regimes on growth and development of wheat. (A) Image of plants at 53 days after sowing; (B) image of seeds at 53 days after sowing; (C) days from sowing to anthesis (n = 6); (D) net photosynthesis rate (n = 6); (E) maximum photochemical efficiency of photosystem II (F v/F m) (n = 6); (F) culm height (n = 8); (G) total dry weight (including stem and spike) (n = 6); (H) flag leaf area (n = 4); (I) total seed number per plant (n = 6); (J) wheat yield (n = 6); (K) spike number per plant (n = 6); (L) seed protein content (n = 4). Plants were grown in substrate cultivation under three different light regimes with similar daily light integral: (1) Control: 500 μmol m−2 s−1 PPFD with 22 h photoperiod; (2) Continuous: 458 μmol m−2 s−1 PPFD with 24 h photoperiod (continuous light); (3) Dynamic: Different light intensities used during different developmental stages, at a photoperiod of 22 h (Table 3). Box plots indicate 0% (maximum), 25%, 50% (median), 75%, and 100% (minimum), and points show single data. Different letters represent significant differences between treatments according to Duncan's analysis at p = 0.05.
FIGURE 5
FIGURE 5
Effects of color temperature on spring wheat growth and development. (A) Days from sowing to anthesis (n = 6); (B) net photosynthesis rate (n = 6); (C) culm height (n = 8); (D) total dry weight (including stem and spike) (n = 6); (E) thousand‐grain weight (n = 6); (F) wheat yield (n = 6); (G) total seed number per plant (n = 6), (H) seed protein content (n = 4). Box plots indicate 0% (maximum), 25%, 50% (median), 75%, and 100% (minimum), and points show single data. Different letters for each column represent significant differences between treatments according to Duncan's analysis at p = 0.05.
FIGURE 6
FIGURE 6
Seed germination rate at different stages of maturity. (A) seeds harvested at different developmental stages (no. days after sowing) and dried at 38°C for 2 days until water content reached ~15%; (B) image of seed germination; (C) seed germination rate. Data are presented as means ± SE (n = 3, where each replicate represents the mean of thirty biological replicates). Means were compared using ANOVA, and different letters represent significant differences between treatments according to Duncan's analysis at p = 0.05.
FIGURE 7
FIGURE 7
Summary of cultivation environment and lighting strategy for spring wheat grown in indoor farming. PPFD scheme 1, constant light intensity. PPFD scheme 2, dynamic light intensity.

References

    1. Asseng, S. , Foster I. A. N., and Turner N. C.. 2011. “The Impact of Temperature Variability on Wheat Yields.” Global Change Biology 17: 997–1012. 10.1111/j.1365-2486.2010.02262.x. - DOI
    1. Asseng, S. , Guarin J. R., Raman M., et al. 2020. “Wheat Yield Potential in Controlled‐Environment Vertical Farms.” Proceedings of the National Academy of Sciences 117: 19131–19135. 10.1073/pnas.2002655117. - DOI - PMC - PubMed
    1. Baiyin, B. , and Yang Q. C.. 2024. “Applications of Vertical Farming in Urban Agriculture.” European Journal of Horticultural Science 89: 7. 10.17660/eJHS.2024/020. - DOI
    1. Bao, Y. , Liu X., Feng C.‐H., et al. 2024. “Light and Light Signals Regulate Growth and Development in Woody Plants.” Forests 15: 523. 10.3390/f15030523. - DOI
    1. Burattini, C. , Mattoni B., and Bisegna F.. 2017. “The Impact of Spectral Composition of White LEDs on Spinach (Spinacia oleracea) Growth and Development.” Energies 10: 1383. 10.3390/en10091383. - DOI