. 2025 Oct 10;11(10):2795-2813.
doi: 10.1021/acsinfecdis.5c00477. Epub 2025 Sep 12.

Larval Ascariasis Triggers Unresolved Anemia, Persistent Inflammation, and Chronic Pulmonary Disease after Single and Reinfection in a Dose-Dependent Manner in Mice

Affiliations

Larval Ascariasis Triggers Unresolved Anemia, Persistent Inflammation, and Chronic Pulmonary Disease after Single and Reinfection in a Dose-Dependent Manner in Mice

Jorge Lucas Nascimento Souza et al. ACS Infect Dis. .

Abstract

Although different studies have investigated the pathophysiological aspects of ascariasis using experimental models, the long-term effects following the peak of larval migration in the lungs remain poorly understood, especially in different doses of infection, such as those that mimic better the natural infection scenario. In this study, we evaluated the impact of different infection doses (250, 1250, and 2500 eggs) and amount of exposure (single vs reinfection) on the host's immune response over an extended period. Our findings demonstrate that even the lowest dose (250 eggs) can induce persistent, though less severe, pathological damages compared to higher doses. These include anemia resulting from alveolar hemorrhage and the development of chronic pulmonary disease. Notably, while lower doses elicit a milder immune response, clinical manifestations tend to appear later, indicating a delayed pathological impact. Importantly, inflammatory infiltrates and altered cytokine levels (including Th1/Th2/Th17) were still observed in the lungs more than 100 days postinfection, even after larval clearance. The humoral immune response against Ascaris suum remained active for at least 100 days postinfection, with the potential for longer persistence. Notably, even with lower doses, only two exposures were sufficient to trigger an immune pattern similar to that observed at higher doses. These findings highlight the need for further investigation into the chronic inflammatory effects of Ascaris infection, including its impact on distant organs and its potential contribution to the development of noncommunicable diseases and comorbidities. A better understanding of these mechanisms is essential for developing improved strategies to control ascariasis in endemic areas.

Keywords: ACO; chronic inflammation; comorbidities; larval ascariasis; lung disease; murine model.


Figures
1
1
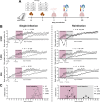
Experimental design and mice alterations postinfection by A. suum according to the dose of infection and the amount of exposure. (A) Experimental design of the A. suum infection in mice according to different infection doses and amount of exposures and euthanasia at 35 dpi (n = 8, per group) and 100 dpi (n = 8 per group). (B) Body weight variation throughout 80 days of evaluation according to different doses and amount of exposure. (C) Evaluation of clinical alterations throughout 80 days. Highlights in red indicate the period of larval migration in the host after the first exposure, while gray highlights indicate the period of larval migration in the host after the second exposure. Arrows indicate the exact moment of gavage (filtered water or infection) according to the evaluation day. In B, results are expressed in percentages from the initial weight of the mice before the experimental design, and multiple t tests were used to evaluate variations in body weight. In C, the two-way ANOVA test, followed by the multiple comparisons test, was used to assess variations in clinical signs. The results are shown as mean ± SEM, and statistical differences are represented by an asterisk, where * represents differences between groups, where p < 0.05, **p < 0.01, and ***p < 0.001 or and (a) represent significant differences (p ≤ 0.05) with the NI group, (b) 250 group, (c) 1250 group, and (d) 2500 group.
2
2
Larvae recovered from lung and BAL, hematological analysis, and characterization of alveolar hemorrhage among groups of mice BALB/c infected by A. suum in different doses and amount of exposures at 35 dpi and 100 dpi. (A) Number of larvae recovered from the lung and BAL. (B) Hematological changes including hemoglobin dosage, hematocrit determination, mean corpuscular volume calculation, and mean corpuscular hemoglobin calculation according to different doses and amount of exposure at 35 dpi. (C) Variation of hemoglobin and hematocrit in single-infection groups at 35 dpi and 100 dpi. (D) Levels of total proteins and hemoglobin in BAL at 35 dpi. (E) Correlation between levels to total protein and hemoglobin in BAL in groups single-infected. (F) Levels of hemoglobin in BAL at 8 dpi per dose. Results are expressed in mean ± SEM. Red values in A indicate a reduction (%) in larvae compared to the first exposure, and a t-test was used to evaluate differences between groups (n = 8 per group). In B, C, D, and F, the one-way ANOVA test, followed by Tukey’s test, was used to evaluate differences among NI, SI, and RE groups in each dose or between times (n = 8 per group). In E, the Pearson correlation test was used to verify the correlation between the levels of total protein and hemoglobin in BAL. Statistical differences are represented by an asterisk, where * without the bar represents differences with the NI group and differences between the amount of exposure (SI × RE) in respective dose are represented by the asterisk with the bar where p < 0.05, **p < 0.01, and ***p < 0.001 or in C, the bar indicates the differences between the groups in 35 and 100 dpi where (a) represents significant differences of NI group, (b) 250 group, (c) 1250 group, and (d) 2500 group.
3
3
Blood leukocyte counts, platelets, and evaluation of leukocyte counts in BAL from mice infected with A. suum at different days postinfection according to different doses or amounts of exposures. (A) Blood leukocyte counts including eosinophils, neutrophils, monocytes, and lymphocytes count at 35 dpi. (B) Platelets counts. (C) Leukocyte counts in BAL including macrophages, hemosiderin-laden macrophages, lymphocytes, neutrophils, and eosinophils count at 35 dpi. (D) Hemosiderin-laden alveolar macrophages observed in mice infected with 1250 and 2500 larvated eggs of A. suum. (E) Leukocyte counts in BAL including, macrophages, hemosiderin-laden macrophages, lymphocytes, neutrophils, and eosinophils count at 100 dpi divided according to the amount of exposure. A one-way ANOVA test followed by Tukey’s test was used to evaluate differences among NI, SI, and RE groups in each dose (n = 8 per group). The results are shown as the mean ± SEM, and statistical differences are represented by an asterisk, where * without the bar represents differences between the NI group and differences between the amount of exposure (SI × RE) in respective doses are represented by the asterisk with the bar and p < 0.05, **p < 0.01, and ***p < 0.001 or in E, the bar indicates differences between the groups in 35 and 100 dpi where (a) represents significant differences of the NI group, (b) 250 group, (c) 1250 group, and (d) 2500 group.
4
4
Characterization of the cellularity of lung tissue of mice infected with A. suum at 35 dpi. (A) Indirect activity of macrophages (NAG), eosinophils (EPO), and neutrophils (MPO) in lung tissue. (B) Hemosiderin-laden alveolar macrophages observed in lung tissue at 35 dpi. (C) Representative hematoxylin and eosin staining of lung sections where hemorrhage area (arrows), hemosiderin-laden alveolar macrophages (arrowhead), inflammatory infiltrate (★), and bar = 30 μm. (D) Scores of lung inflammation in lung tissue and evaluation of inflammatory infiltrate areas. One-way ANOVA test followed by Tukey’s test was used in A and D Kruskal–Wallis test followed by Dunn’s test were used to evaluate differences among NI, SI, and RE groups in each dose (n = 8 per group). In the evaluation of inflammatory infiltrate areas in D, a t-test was used between the amount of exposure (SI × RE) in the respective dose of infection. The results are shown as the mean ± SEM, and statistical differences are represented by an asterisk, where * without the bar represents differences between the NI group and differences between the amount of exposure (SI × RE) in respective doses are represented by the asterisk with the bar and p < 0.05, **p < 0.01, and ***p < 0.001.
5
5
Evaluation of fibrosis area in the lung of mice infected by A. suum at 35 dpi. (A) Representative Masson’s trichrome staining in the lung of the NI group. (B) Representative Masson’s trichrome staining in the lung of the SI 250 group. (C) Representative Masson’s trichrome staining in lung of the SI 1250 group. (D) Representative Masson’s trichrome staining in the lung of the SI 2500 group. (E) Representative Masson’s trichrome staining in the lung of the RE 250 group. (F) Representative Masson’s trichrome staining in the lung of the RE 1250 group. (G) Representative Masson’s trichrome staining in the lung of the RE 1250 group. (H) Analysis of the area of fibrosis formation. t-Test was used to evaluate differences between groups between the amount of exposure (SI × RE) in respective doses (n = 8 per group). The results are shown as the mean ± SEM, and statistical differences are represented by an asterisk, where * with the bar indicates differences between the groups in respective dose, where p < 0.05, **p < 0.01, and ***p < 0.001.
6
6
Profile of cytokines present in lung tissue of mice BALB/c infected with A. suum at 35 and 100 dpi according to the different doses and amount of exposure. (A) Levels of IL-2 at 35 dpi; (B) TNF-α at 35 dpi; (C) IL-5 at 35 dpi; (D) IL-6 at 35 dpi; (E) IL-13 at 35 dpi; (F) IL-17A at 35 dpi; (G) IL-10 at 35 dpi; (H) TGF-β at 35 dpi; (I) IL-2 at 100 dpi; (J) TNF-α at 100 dpi; (K) IFN-γ at 100 dpi; (L) IL-5 at 100 dpi; (M) IL[1]­6 at 100 dpi; (N) IL-13 at 100 dpi; (O) IL-17A at 100 dpi; (P) IL-10 at 100 dpi; and (Q) TGF-β at 100 dpi. The results are shown as the mean ± SEM. A one-way ANOVA test followed by Tukey’s test was used to evaluate differences among NI, SI, and RE groups in each dose (n = 8 per group). Statistical differences are represented by an asterisk, where * without the bar represents differences between the NI group and differences between the amount of exposure (SI × RE) in respective doses are represented by an asterisk with the bar and p < 0.05, **p < 0.01, and ***p < 0.001.
7
7
Changes in respiratory mechanics at 35 and 100 dpi according to the amount of exposure and between the same doses. (A) Parameters evaluated in spirometry at 35 dpi including lung resistance, TV, IC, Tiffeneau index, static, and dynamic compliance. (B) Parameters evaluated in spirometry at 35 and 100 dpi divided into infection doses, and parameters such as lung resistance, TV, IC, Tiffeneau index, static, and dynamic compliance. A one-way ANOVA test followed by Tukey’s test was used to evaluate differences among NI, SI, and RE groups in each dose (n = 8 per group). The results are shown as the mean ± SEM, and statistical differences are represented by the asterisk, where * without the bar represents differences between the NI group and differences between the amount of exposure (SI × RE) in respective doses are represented by the asterisk with the bar and p < 0.05, **p < 0.01, and ***p < 0.001 or in B, the bar indicates differences between the groups in 35 and 100 dpi where (a) represents significant differences of the NI group, (b) 250 group, (c) 1250 group, and (d) 2500 group.
8
8
Evaluation of antibody anti-Ascaris responses at 35 and 100 dpi according to different doses and amounts of exposure. (A) Determination of the presence of anti-Ascaris IgG (O.D 492 nm) in serum and anti-Ascaris IgA (O.D 492 nm) in BAL of animals according to different doses in the SI and RE groups at 35 dpi. (B) Determination of the presence of anti-Ascaris IgG and anti-Ascaris IgA in SI groups, at 0, 35, and 100 dpi. (C) Determination of the presence of anti-Ascaris IgG and anti-Ascaris IgA in RE groups at 0, 35, and 100 dpi. A one-way ANOVA test followed by Tukey’s test was used to evaluate differences among NI, SI, and RE groups in each dose (n = 8 per group). The results are shown as the mean ± SEM and statistical differences are represented by the asterisk, where * without the bar represents differences between the NI group and differences between the amount of exposure (SI × RE) in respective doses are represented by the asterisk with the bar and p < 0.05, **p < 0.01, and ***p < 0.001 or in B, the bar indicates differences between the groups in 35 and 100 dpi where (a) represents significant differences of the NI group, (b) 250 group, (c) 1250 group, and (d) 2500 group.
9
9
PCA of damage and repair mechanisms in BALB/c mice infected with A. suum. Analysis of observations of cellularity, host damage intensity, and repair mechanisms in different groups exposed to infection. Segregation between groups indicates distinct immune responses and repair patterns.

References

    1. Holland C., Sepidarkish M., Deslyper G., Abdollahi A., Valizadeh S., Mollalo A., Mahjour S., Ghodsian S., Ardekani A., Behniafar H., Gasser R. B., Rostami A.. Global Prevalence of Ascaris Infection in Humans (2010–2021): A Systematic Review and Meta-Analysis. Infect. Dis. Poverty. 2022;11(1):113. doi: 10.1186/s40249-022-01038-z. - DOI - PMC - PubMed
    1. Gazzinelli-Guimarães P. H., Gazzinelli-Guimarães A. C., Silva F. N., Mati V. L. T., Dhom-Lemos L. D. C., Barbosa F. S., Passos L. S. A., Gaze S., Carneiro C. M., Bartholomeu D. C., Bueno L. L., Fujiwara R. T.. Parasitological and Immunological Aspects of Early Ascaris Spp. Infection in Mice. Int. J. Parasitol. 2013;43(9):697–706. doi: 10.1016/j.ijpara.2013.02.009. - DOI - PubMed
    1. Silva T. E. D., Barbosa F. S., Magalhães L. M. D., Gazzinelli-Guimarães P. H., Dos Santos A. C., Nogueira D. S., Resende N. M., Amorim C. C., Gazzinelli-Guimarães A. C., Viana A. G., Geiger S. M., Bartholomeu D. C., Fujiwara R. T., Bueno L. L.. Unraveling Ascaris Suum Experimental Infection in Humans. Microb. Infect. 2021;23(8):104836. doi: 10.1016/j.micinf.2021.104836. - DOI - PubMed
    1. Else K. J., Keiser J., Holland C. V., Grencis R. K., Sattelle D. B., Fujiwara R. T., Bueno L. L., Asaolu S. O., Sowemimo O. A., Cooper P. J.. Whipworm and Roundworm Infections. Nat. Rev. Dis. Primers. 2020;6(1):44. doi: 10.1038/s41572-020-0171-3. - DOI - PubMed
    1. Hotez P. J., Alvarado M., Basáñez M.-G., Bolliger I., Bourne R., Boussinesq M., Brooker S. J., Brown A. S., Buckle G., Budke C. M., Carabin H., Coffeng L. E., Fèvre E. M., Fürst T., Halasa Y. A., Jasrasaria R., Johns N. E., Keiser J., King C. H., Lozano R., Murdoch M. E., O’Hanlon S., Pion S. D. S., Pullan R. L., Ramaiah K. D., Roberts T., Shepard D. S., Smith J. L., Stolk W. A., Undurraga E. A., Utzinger J., Wang M., Murray C. J. L., Naghavi M.. The Global Burden of Disease Study 2010: Interpretation and Implications for the Neglected Tropical Diseases. PLoS Negl. Trop. Dis. 2014;8(7):e2865. doi: 10.1371/journal.pntd.0002865. - DOI - PMC - PubMed

MeSH terms