. 2025 Sep 2;66(12):30.
doi: 10.1167/iovs.66.12.30.

Selective Impairment of Rod-Driven Vision in Vitamin A Deficiency: Insights From Examining the Effect of Desensitizing Backgrounds

Affiliations

Selective Impairment of Rod-Driven Vision in Vitamin A Deficiency: Insights From Examining the Effect of Desensitizing Backgrounds

Megan Margetts et al. Invest Ophthalmol Vis Sci. .

Abstract

Purpose: The purpose of this study was to explore whether nyctalopia in vitamin A deficiency (VAD) is attributable to simple reduction in quantal catch or to an "equivalent background" phenomenon.

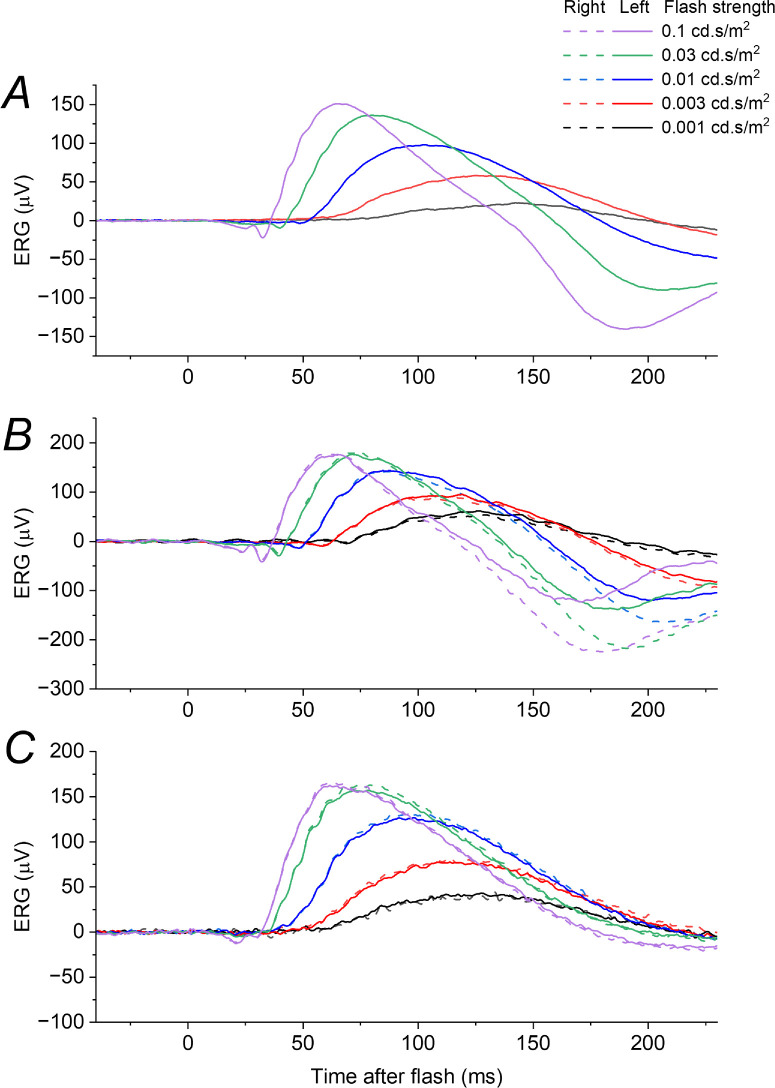
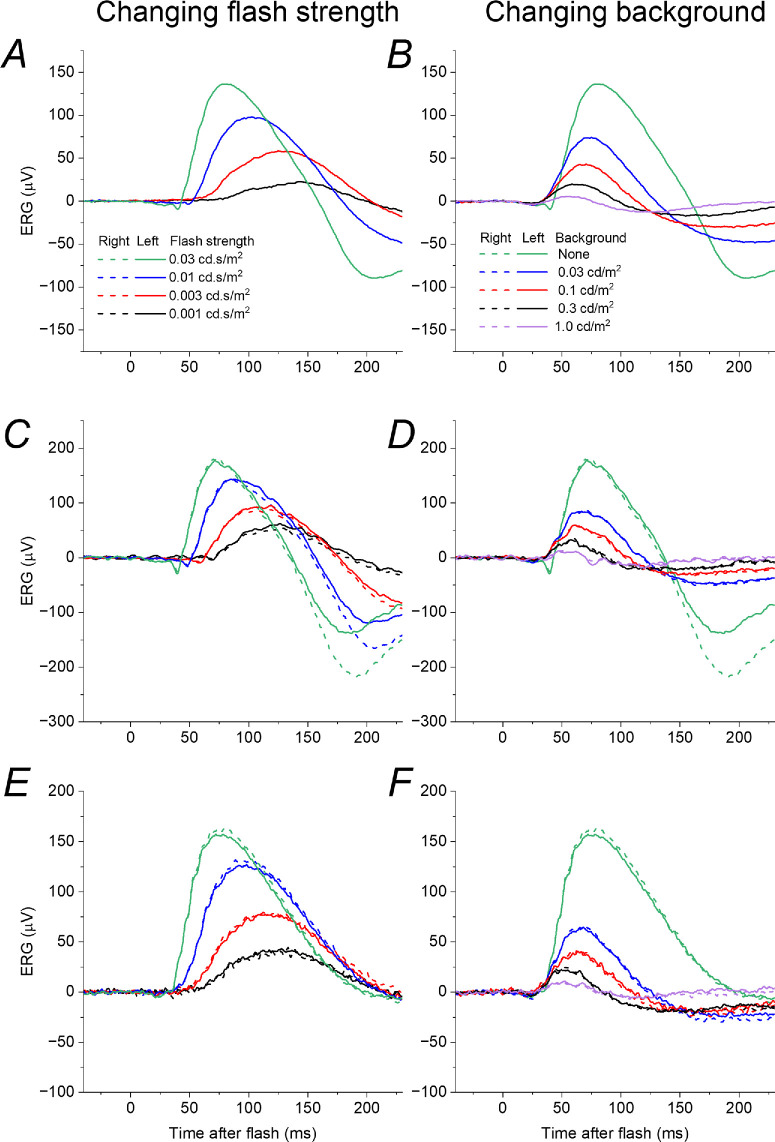
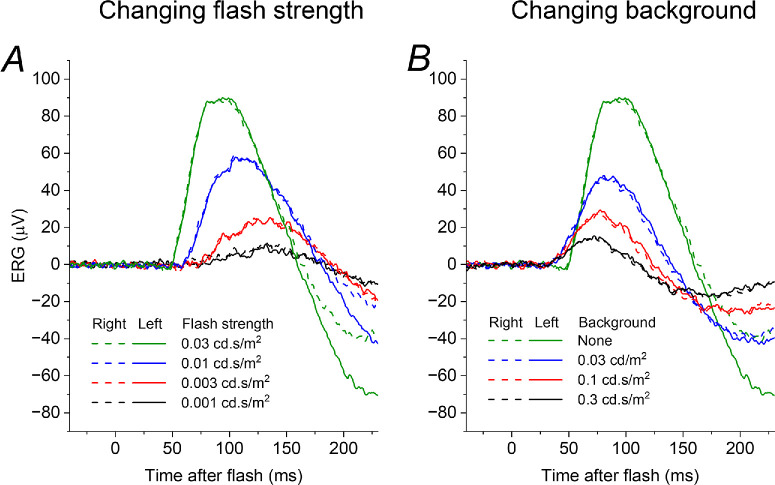
Methods: Five individuals were recruited for experimental electroretinograms (ERGs), including three healthy participants (aged 21 to 47 years), one patient with VAD (aged 70 years), and one patient with GNAT2-associated achromatopsia (aged 43 years). Recordings used conductive fiber electrodes and followed dark adaptation and mydriasis. Dim flashes of varying strengths were delivered in the dark to mimic reduction in quantal catch; flashes of fixed strength (0.03 scotopic cd·s/m2) were delivered on dim blue backgrounds.

Results: International standard recordings in the patient with VAD showed selective attenuation of dark-adapted responses in severe deficiency, which normalized following treatment. Light-adapted responses did not change. In experimental recordings, both reducing flash strength and applying dim backgrounds reduced ERG amplitude. Reducing flash strength also increased latency of the response, whose rising phase and peak became progressively delayed. Dim backgrounds did not prolong latency. This was seen in all participants, including the patient with achromatopsia, indicating that this was a property of the rod system. In moderate VAD, the dim-flash response was reduced, but not delayed, resembling the response seen in the presence of a dim background.

Conclusions: Our findings indicate that rod system desensitization in VAD likely arises from an "equivalent background" effect, probably arising from activation of phototransduction by free opsin. Activation to a similar degree is known not to occur in cones, helping explain why VAD selectively affects night vision.


Conflict of interest statement

Disclosure: M. Margetts, None; R. Rufus-Toye, None; X. Jiang, None; S.M. Leo, None; I. Chow, None; M. Indusegaran, None; P.G. Hysi, None; A.R. Webster, None; C.J. Hammond, None; O.A. Mahroo, None

Figures

Figure 1.
Figure 1.
ISCEV standard ERGs in vitamin A deficiency before and after replacement. (DA 3 ERGs are not shown, but revealed similar findings to the DA 10 stimulus.) All stimuli are white. Left panels show example ERGs from a healthy individual. Right panels show ERGs from 70-year-old female patient with severe VAD before (black traces) and after (red traces) vitamin A replacement. (A, B) ERGs to DA 0.01 stimulus (dark-adapted response to flash delivering 0.01 photopic cd·s/m2). (C, D) ERGs to DA 10 stimulus (dark-adapted response to flash delivering 10 photopic cd·s/m2). (E, F) ERGs to LA 30 Hz stimulus (light-adapted response to 30 Hz flickering stimulus delivering 3.0 photopic cd·s/m2 in the presence of white background of 30 photopic cd/m2). (G, H) ERGs to LA 3 stimulus (light-adapted response to flashes delivering 3.0 photopic cd·s/m2 in the presence of white background of 30 photopic cd/m2). All traces are averages of multiple stimulus presentations.
Figure 2.
Figure 2.
ERGs elicited by very dim flashes delivered in the dark in healthy participants. Each panel shows dark-adapted ERGs to flashes of a range of strengths; each trace is the average of multiple flash presentations. The green traces in each panel correspond to the ISCEV standard DA 0.01 stimulus. (A) ERGs from a 47-year-old man (recordings only undertaken in the left eye). (B) ERGs from a 20-year-old woman. (C) ERGs from a 29-year-old man. In all cases, as flash strength decreases, the response latency appears to increase, with the initial rise of the b-wave and the subsequent peak occurring at progressively later post-flash times.
Figure 3.
Figure 3.
Effect of varying flash or background strength on dim-flash ERGs in healthy participants. Left panels show ERGs elicited by dim flashes of varying strength: these are replotted from Figure 2, omitting flash strengths greater than the test flash (0.03 cd·s/m2). Right panels show ERGs in the same participants in response to the test flash delivered in the dark or on very dim backgrounds of varying strength (up to 1 cd/m2). (A, B) ERGs from a 47-year-old man (recordings only undertaken in the left eye). (C, D) ERGs from a 20-year-old woman. (E, F) ERGs from a 29-year-old man. As background strength increases (right panels) the response rises at a similar time and peaks earlier (in contrast to the delayed rise and later peak seen in the left panels).
Figure 4.
Figure 4.
Effect of varying flash or background strength on dim-flash ERGs in a patient with molecularly proven achromatopsia. The patient is a 43-year-old man with bi-allelic pathogenic variants in GNAT2. (A) ERGs in response to dim flashes of varying strength in the dark. (B) ERGs elicited by a flash of constant strength (0.03 cd.s/m2) delivered in the dark and on different strengths of dim background. The ERGs show similar features to those seen in the healthy participants (Figs. 2, 3), indicating that these features arise in the rod system.
Figure 5.
Figure 5.
Dim-flash ERGs in a patient with VAD when replete and moderately deficient. (A, B) ERGs recorded in response to varying strengths of dim flash delivered in the dark (A) and to a flash of constant strength delivered on dim backgrounds of different strength (B), in a 70-year-old woman with normal vitamin A levels (2.7 micromol/L) following replacement after prior deficiency. ERGs show the same features seen in the other participants (Figs. 3, 4). (C) ERGs recorded to the test flash delivered in the dark in the setting of subsequent moderate vitamin A deficiency (0.58 micromol/L; purple traces). ERGs elicited by the same flash when vitamin A replete (green traces) are also shown for comparison. The ERG in vitamin A deficiency resembles the effect of a background (B) rather than the response to a dimmer flash (A). (D) ERGs in the three contexts plotted on an expanded time scale to show the rising phase of the response: this is progressively delayed for dimmer flashes, but occurs at the same post-flash time on the backgrounds and in vitamin A deficiency. Grey curves highlight the rising phase of the responses.

References

    1. Liu Z, Liu Y, Yang J, Yan L, Li Q, Gao Y.. Global, regional and national trends in the burden of nutritional deficiencies in children, 1990-2021. Front Nutr. 2025; 12: 1565620. - PMC - PubMed
    1. Dowling JE, Wald G. Vitamin A deficiency and night blindness. Proc Natl Acad Sci USA. 1958; 44(7): 648–661. - PMC - PubMed
    1. McBain VA, Egan CA, Pieris SJ, et al.. Functional observations in vitamin A deficiency: diagnosis and time course of recovery. Eye (Lond). 2007; 21(3): 367–376. - PubMed
    1. Mata NL, Radu RA, Clemmons RC, Travis GH.. Isomerization and oxidation of vitamin A in cone-dominant retinas: a novel pathway for visual-pigment regeneration in daylight. Neuron. 2002; 36(1): 69–80. - PMC - PubMed
    1. Matthews HR, Cornwall MC, Fain GL.. Persistent activation of transducin by bleached rhodopsin in salamander rods. J Gen Physiol. 1996; 108(6): 557–563. - PMC - PubMed

LinkOut - more resources